Florida elementary and middle schools were asked to solve mathematical prob- lems printed .... Computer Visualizations and Visual Representations. Another ...
Chapter 5
Visualizations and Mathematics
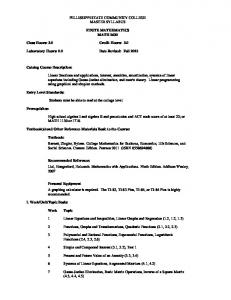
The question of whether visualizations help develop mathematical concepts has an ambiguous, and oftentimes contradicting, response. We reviewed over 40 articles focusing on visualizations in mathematics classrooms, with the majority focused on general mathematics, followed by geometry (see Fig. 5.1). Two central issues arose: (1) a theoretical issue over the function of visualization objects as mathematical entities and (2) a practical issue over the effectiveness of visualization objects in learning and in doing mathematics. Intermingled with the two issues are the goals of mathematics instruction, which depending upon their formulation can emphasize or deemphasize the need for visualization. Hershkowitz (1989) studied the role of visualization in the process of geometrical concept attainment for middle school students, 142 pre-service elementary teachers, and 25 in-service senior elementary teachers. She claimed that “we cannot form an image of a concept and its examples without visualizing its elements” (p. 61) and stated further that visualization is complex and works in two opposing ways. First, we need to visualize elements in order to form an image of a concept. Second, a concept image may be narrowed by the visual elements. Hershkowitz presented participants with a verbal definition of two contrived geometrical concepts (“bitrian” and “biquad”) and then asked half the students and teachers to identify those concepts from a set of shapes, while the other half were asked to draw the concepts. She found that the majority of participants identified the simplest examples of each concept or drew at least one example correctly. The results showed that despite the identical attributes
Algebra/Geometry Calculus
Fig. 5.1 Percentage of mathematics-related articles by specific subject
General Math
L.M. Phillips et al., Visualization in Mathematics, Reading and Science Education, Models and Modeling in Science Education 5, DOI 10.1007/978-90-481-8816-1_5, � C Springer Science+Business Media B.V. 2010
45
46
5 Visualizations and Mathematics
in the examples, certain examples were viewed differently by the participants, and these were prototypes. She explains: “if we examine the prototypical examples we will find in each of them some specific attribute(s), in addition to the critical attributes of the concepts. . .which are dominant and ‘draw our attention’. . .[because they] usually register in our mind spontaneously via visual codes” (pp. 73–74). Hershkowitz concludes that the prototypes create visual–perceptual limitations, and that in turn can affect identification abilities for people of all ages and stages of education. However, “individuals do not usually attain any example of the concept unless they have already attained the prototypical example” (p. 74).
Visual–Spatial Images In a study by van Garderen (2006) 66 grade six students from four urban south Florida elementary and middle schools were asked to solve mathematical problems printed individually on a card presented to them by the author and a research assistant. The students “represented three levels of problem-solving ability: students with learning disabilities (LD), average-achieving (AA) students, and gifted (G) students” (p. 498). After solving each problem, they were interviewed to determine “how they solved it and whether a visual image had been used” (p. 498). Using three measures (the number of problems solved correctly, whether a visual image was used while solving the problem, and whether that visual image was pictorial or schematic in nature) the author found that “students with high spatial visualization ability (defined as ‘the ability to mentally manipulate, rotate, or twist, or invert a pictorially presented stimulus object’ (McGee, 1979, p. 893)) tended to produce images that were primarily schematic in nature, whereas students with low spatial visualization ability tended to produce images that were primarily pictorial in nature” (p. 504). This study suggests that “deficits in visual-spatial competencies may interfere with the ability to solve word problems” (p. 504). With increased aptitude for spatial visualization, students will have the ability to use the more sophisticated schematic imagery when solving math problems. Presmeg (1986) claims that most gifted math students are non-visualizers. She states that “it emerged strongly in the task-based interviews that for success in school mathematics the one-case concreteness of an image or a diagram must be transcended, and that many if not most visualizers are not aware of how to accomplish this task. For non-visualizers this problem does not arise” (p. 301). She maintains that the practice of procedures and formulas in math leads to habituation, which takes a learner away from the visual method. Presmeg summarized reasons that gifted mathematicians are not visualizers. The internal reasons are that single-example concreteness may tie thoughts to irrelevant details and may induce inflexible thinking, and that an uncontrollable image may arise which prevents multiple avenues of thought. The external reasons are that mathematics simply might favour the non-visual thinker due to the verbal–logical component involved in mathematical abilities (Krutetskii, 1976), and that school curriculum is developed in such
Visual–Spatial Images
47
a way that the time constraints of examinations do not permit a full exploration of the visual side of the problems. Another external reason again points to the classroom, where the teaching emphasis is most always on non-visual methods, with a focus on orderly logical progression of information that does not include visual proofs or examples (pp. 306–307). Habre (1999) reemphasized the latter point in a discussion about a university calculus class in which 26 students were exposed to both analytical and visual methods of solving problems. Habre noted that even with instructor emphasis on visualization, most students tended to prefer the analytical approach, likely because “many students might be coming from traditional schools of mathematical instruction. Consequently, their view of mathematics is entirely algebraic” (p. 21). The author maintained that students did have an appreciation for the visualization skill, even if they had yet to acquire proper knowledge and experience in applying it to problem solving. Several other studies emphasized the negative outcomes that could arise from the use of visuals in mathematics classrooms. Aspinwall, Shaw, and Presmeg (1997) examined the role of imagery in the conceptual understanding of one college-level calculus student. They state that the historical use of graphics in mathematics was to express a solution to the problem, rather than using graphics within the methods of solving the problem. The authors tested their participant with 20 different nonroutine problems, observing when the student used graphics and how he was able to control the images that appeared in his mind while solving the problems. They concluded that “there is a tendency for thought to be riveted to an image which is inappropriate or which prevents mathematical generalization” (p. 304), and that “vivid and dynamic imagery invoked by calculus graphs can create an impediment to mathematical understanding” (p. 314). Counter to the above-described articles, Palais (1999) discussed and encouraged mathematical visualization as well as the integrations of computer graphics into the math classroom. He stated that “applied mathematicians find that the highly interactive nature of the images produced by recent mathematical visualization software allows them to do mathematical experiments with an ease never before possible” (1999, p. 648). Palais examined three major software programs, the drawback of all being that they have unique programming languages that the user must learn. He argues that the main task of a mathematical visualization programme should be to display the mathematical process, rather than the product. Tomas, Johnson, and Stevenson (1996) examined the prevalence of computer visualizations in middle and high school math classrooms. They define visualization as “a computer graphic technology developed to extend the use of our visual system to contexts and problem-solving situations where sight itself is not directly possible or in which normal vision fails to provide adequate opportunity for analysis” (p. 268). They claimed that “specialized educational products that include curricular materials with the scientific data and visualization tools have enormous potential to motivate and empower students to explore their world” (p. 290). The authors provided guidelines for the use of visualizations, suggesting factors that teachers need to take into account before automatically using this method of instruction in the classroom: versatility and power of the visualization (How accessible is it to all
48
5 Visualizations and Mathematics
levels of learners?); the ease of operations (Is the computer program created in such a way that there are limited malfunctions that the student may experience?); and costs of the visualization.
Computer Visualizations and Visual Representations Another interesting approach was taken by Rivera (2007) when he interviewed 22 ninth grade students in a beginning algebra course to assess how they established a generalization for a tiling squares problem. The study was motivated by the fact that the results of a 5-year district-wide study involving patterns and functions found that “[w]hile 70 percent of ninth graders tested could extend patterns one by one, less than 15 percent of them could develop an algebraic generalization in closed form” (p. 69). In order to find out which strategies might enable ninth graders to see beyond the particulars to develop an algebraically useful generalization, interviews were conducted. They were asked questions about specific patterns: for example, a tile H configuration that systematically increases in size through the addition of tiles. Three patterns emerged from students’ responses: a figural additive strategy wherein some students saw an additive growth in the figural sequence but unfortunately some jumped to an invariant formula that in the end required them to count individually the number of tiles in each figure; two figural multiplicative strategies in which students resorted to counting by sides because they saw symmetry among the figural cues—these students thought in multiples of “side”; and finally a technique of concentric versus visual counting that resulted in students repeating the addition of one square on each side or arm of a figural cue. Rivera concluded that if algebraic generalizations are promoted through visualizations, then patterns must be seen as mathematical objects rather than everyday objects. He further reiterated Raymond Duval’s (2006) claim that students’ way of seeing, observing, and noticing patterns may be in an everyday way and not in a mathematical way. “When we focus on visualization, we are facing a strong discrepancy between the common way to see the figures, generally in an iconic way, and the mathematical way they are expected to be looked at. There are many ways of ‘seeing’” (p. 115). The spatial visualization ability of seven mathematically gifted students (six in grade six and one in grade seven) was studied by Ryu, Chong, and Song (2007). The task included a regular icosahedron pictured in two dimensions and four specific problems of comparing side lengths and angle sizes. Students had 60 min to solve the tasks followed by an interview. These gifted students shared the ability to imagine the rotation of a depicted object, to visualize its configuration, to transform it into a different form, and to manipulate it in their imagination. Only two of the seven students displayed spatial visualization ability of 3D objects in a 2D representation. The remaining five were challenged to manipulate mentally an object depicted in a plane as a spatial object. If students are presented visual facts in a planar picture, confusion is likely to occur if they are asked to distinguish the edges of a spatial object from the depicted illustration and to distinguish planes in a 3D object from its 2D representation.
Computer Visualizations and Visual Representations
49
Attempts to make mathematics easier and more interesting are commonplace. In a study by Figueira-Sampaio, Ferreira dos Santos, and Carrijo (2009), 46 students in their sixth year of primary school were divided into two groups. Group A used the computer laboratory to study and analyse five first-degree polynomial equations of increasing difficulty (x + 4 = 10 + 4) to (5x + 50 = 3x + 290) using a prepared visual panel. Group B went to the mathematics laboratory where the equations were written on the blackboard and students were to use a conventional beam balance as a metaphor for the equation. Both classes lasted 50 min and students were observed to determine whether the visual panel was an advantage. Regrettably, no measures of students’ understanding of first-degree equations were taken. Using the computer tool in pairs seemed to help students but the authors made no claim about improved mathematical understanding of either group to solve first-degree equations. Visual representations constructed by emergent mathematics learners (38 kindergarteners aged 5–6 years and 34 first graders aged 6–7 years) were investigated by Deliyianni et al. (2009). Their study was designed to investigate and compare the modes of representations used by the children and to examine the extent to which the children used the rules of the didactic (systematic use of rules and mathematical knowledge) contract. Over a 2-week period the children were given four problems one at a time (two standard and two problematic—could not be solved). For example, Problem 1 was a standard addition: “In a fruit dish there are four apples. Mother put two more apples. How many apples are there in the fruit dish?” (p. 102). Problem 3 had no solution: “Mrs. Maria gave George 2 candies and 3 chocolates. George put them in a box. How old is George?” (p. 102). Children were instructed to listen carefully to the problem being read and to use their paper, crayons, and pencils to solve the problems. The children’s types of representations were analysed into five categories: pictorial, symbolic (equation), symbolic (numerical), pictorial and symbolic (equation), and pictorial and symbolic (numerical). The types of representations as well as children’s responses to the didactic contract were also analysed. The results showed that all children used a picture to reach an answer. The kindergarteners drew pictures of varying details: some drew six apples while some drew circles; some drew a fruit dish with six apples in it; some drew two fruit dishes, one with four and the other with six apples; some drew the apples in two rows; and some drew the mother holding the two apples or standing near the fruit dish. The grade one children tended to use a symbolic equation to solve the standard problems and the remainder gave the equation accompanied by a picture. The kindergarteners tried to solve the problematic problem by drawing a picture and attempting to give a numerical response, whereas the first graders tried to obey the didactic contract because they gave the sum of the candies and chocolates as an answer, even though they doubted the structure of the problem. Overall, the kindergarten children tended to generate pictorial and descriptive representations of the context of the problem, whereas the first graders tended to use symbolic representations in an effort to solve each problem. The authors concluded that their study presented “a strong case for the role of spontaneous or functional visual representations not only in solving standard problems, but principally in solving problematic problems. Furthermore, the influence of the didactic contract rules
50
5 Visualizations and Mathematics
on pupils’ responses appears to be a function of pupils’ age” (Deliyianni et al., 2009, p. 109). Whether the children would have performed similarly if they had been provided varied visual representations remains an interesting and unresolved question.
Concluding Comments In conclusion, as we said at the onset, the research is mixed. Not only is there a theoretical controversy over whether visualizations have anything but a possible heuristic role in mathematics, it seems the usefulness of visualizations is tied to the goals themselves of mathematics instruction. If the goal is analytic proficiency then it seems visualization may interfere. As well, visualizations seem to work differently for more and less gifted students and for older and younger students, although the trends appear unclear. The research indeed is ambiguous and often contradictory.