We describe a visual analytics platform to handle high- volume micropost streams from multiple social media channels. For each post we extract key contextual ...
Visualizing Contextual and Dynamic Features of Micropost Streams Alexander Hubmann-Haidvogel, Adrian M.P. Braúoveanu, Arno Scharl, Marta Sabou, Stefan Gindl MODUL University Vienna Department of New Media Technology Am Kahlenberg 1 1190 Vienna, Austria
{alexander.hubmann, adrian.brasoveanu, arno.scharl, marta.sabou, stefan.gindl}@modul.ac.at ABSTRACT Visual techniques provide an intuitive way of making sense of the large amounts of microposts available from social media sources, particularly in the case of emerging topics of interest to a global audience, which often raise controversy among key stakeholders. Micropost streams are context-dependent and highly dynamic in nature. We describe a visual analytics platform to handle highvolume micropost streams from multiple social media channels. For each post we extract key contextual features such as location, topic and sentiment, and subsequently render the resulting multidimensional information space using a suite of coordinated views that support a variety of complex information seeking behaviors. We also describe three new visualization techniques that extend the original platform to account for the dynamic nature of micropost streams through dynamic topography information landscapes, news flow diagrams and longitudinal cross-media analyses.
Categories and Subject Descriptors H.5.2 [Information Interfaces and Presentation]: User Interfaces – interaction styles. I.3.6. [Computer Graphics]: Methodology and Techniques – Interaction Technique.
General Terms Algorithms, Measurement, Design, Human Factors
Keywords Social Media Analytics, Microposts, Contextual Features, News Flow, Dynamic Visualization, Information Landscape
1. INTRODUCTION The ease of using social media channels has enabled people from around the world to express their opinions and propagate local or global news about virtually every imaginable topic. In doing so, they most often make use of short text messages (tweets, status updates) that we collectively refer to as microposts. Given the high volume, diversity and complex interdependency of social media-specific micropost streams, visual techniques play an increasingly important role in making sense of these novel data sources. Visual techniques can support analysts, journalists and
marketing managers alike in taking the pulse of public opinion, in understanding the perceptions and preferences of key stakeholders, in detecting controversies, and in measuring the impact and diffusion of public communications. This is particularly true for domains that pose challenges through their global reach, the competing interests of many different stakeholders, and the dynamic and often conflicting nature of relevant evidence sources (e.g., environmental issues, political campaigns, financial markets). To support such scenarios across application domains, we have developed a (social) media monitoring platform with a particular focus on visual analytics (Hubmann, 2009). The platform enables detecting and tracking topics that are frequently mentioned in a given data sample (e.g., a collection of Web documents crawled from relevant sources). The advanced data mining techniques underlying the platform extract a variety of contextual features from the document space. A visual interface based on multiple coordinated views allows exploring the evolution of the document space along the dimensions defined by these contextual features (temporal, geographic, semantic, and affective), and subsequent drill-down functionalities to analyze details of the data itself. In essence, the platform has the key characteristics of a decision support system, namely: 1) it aggregates data from many diverse sources; 2) it offers an easy to use visual dashboard for observing global trends; 3) it allows both a quick drill-down and complex analyses along the dimensions of the extracted contextual features. We briefly report on the overall platform in Section 3. The platform has been originally designed to analyze traditional news media, but from early 2011 we have adapted it to support micropost analysis, taking advantage of the robust infrastructure for crawling, analyzing and visualizing Web sources. The multidimensional analysis enabled by the original design of the portal is well suited for analyzing contextual features of microposts. However, the visualization metaphors did not properly capture the highly dynamic nature of micropost streams, nor did they allow cross-comparison between social and traditional media sources. Our latest research therefore focuses on novel methods to support temporal analysis and cross-media visualizations. In sections 4, 5 and 6 we describe these novel visualizations.
2. RELATED WORK c 2012 held by author(s)/owner(s). Copyright � Published as part of the #MSM2012 Workshop proceedings, available online as CEUR Vol-838, at: http://ceur-ws.org/Vol-838 #MSM2012, April 16, 2012, Lyon, France.
· #MSM2012 · 2nd Workshop on Making Sense of Microposts ·
With the rise of the social networks (Heer, 2005), understanding large-scale events through visualization emerged as an important research topic. Various visual interfaces have been designed for inspecting news or social media streams in diverse domains such as sports (Marcus, 2011), politics, (Diakopoulos, 2010; Shamma, 2009; Shamma, 2010), and climate change (Hubmann, 2009).
34
Researchers have emphasized different aspects of extracting useful information including (sub-)events (Adams, 2011), topics (Hubmann, 2009), and video fragments (Diakopoulos, 2011). Vox Civitas, for example, is a visual analytic tool that aims to support journalists in getting useful information from social media streams related to televised debates and speeches (Diakopoulos, 2010). In terms of the number and type of social media channels that are visualized, most approaches focus primarily on Twitter, while streams from Facebook and YouTube are visualized to a lesser extent (Marcus, 2010). We regard these three channels as equally important and visualize their combined content. To reflect the dynamic nature of social media channels, some visualizations provide real-time updates displaying messages as they are published, and also projecting them onto a map – e.g., TwitterVision.com or AWorldofTweets.frogdesign.com. Given the computational overhead, however, real-time visualizations are the exception rather than the norm, since most projects rely on update times anywhere between a few minutes and a few days. Visual techniques render microposts along dimensions derived from their contextual features. Most frequently, visualization rely on temporal and geographic features, but increasingly they exploit more complex characteristics such as the sentiment of the micropost, its content (e.g., expressed through relevant keywords), or characteristics of its author. Indeed, user clustering as seen in ThemeCrowds (Archambault, 2011) or geographical maps (e.g., (Marcus, 2011), TwitterReporter (Meyer, 2011)) are must-have features for every system that aims to understand local news and correlate them with global trends. Commercial services such as SocialMention.com and AlertRank.com use visualizations to track sentiment across tweets. During the 2010 U.S. Midterm Elections, sentiment visualizations have been present in all major media outlets from New York Times to Huffington Post (Peters, 2010). Fully utilizing contextual features requires the use of appropriate visual metaphors. In general, social media visualizations rely on one of the following three visual metaphors: x
x
Multiple Coordinated Views, also known as linked or tightly coupled views in the literature (Scharl, 2001), (Hubmann, 2009), ensures that a change in one of the views triggers an immediate update within the others. For example, the interface of Vox Civitas uses coordinated views to synchronize a timeline, a color-coded sentiment bar, a Twitter flow and a video window which helps linking parts of the video to relevant tweets (Diakopoulos, 2010). Additionally, (Marcus, 2011) use the multiple coordinated views in their system geared towards Twitter events and offer capabilities to drill down into sub-events and explore them based on geographic location, sentiment and link popularity. Visual Backchannels (Dork, 2010) represent interactive interfaces synchronizing a topic stream (e.g., a video) with real-time social media streams and additional visualizations. This concept has evolved from the earlier concept of digital backchannel, referring to news media outlets supplementing their breaking news coverages with relevant tweets – e.g., during political debates or sport games (Shamma, 2010). However, additionally to the methods described in Hack the Debate (Shamma, 2009) and Statler (Shamma, 2010), tools that use the visual backchannel metaphor display not only the Twitter flow that corresponds to certain media events such as debates, but also a wealth of graphics and statistics.
· #MSM2012 · 2nd Workshop on Making Sense of Microposts ·
x
Timelines follow the metaphor with the longest tradition, well suited for displaying the evolution of topics over time. Aigner et al. present an extensive collection of commented timelines (Aigner, 2011). The work by Adams et al. (Adams, 2011) is similar to our approach as it combines a color-coded sentiment display with interactive tooltips.
Beyond understanding micropost streams, a challenging research avenue compares the content of social media coverage with that of traditional news outlets. Cross-media analysis based on social sources is a relatively new field, but promising results have been published recently. In most cases comparisons are made between two sources such as Twitter and New York Times (Zhao, 2011), or Twitter and Yahoo! News (Hong, 2011). (Zhao, 2011) compares a Twitter corpus with a New York Times corpus to detect trending topics. For the New York Times, they apply a direct Latent Dirichlet Allocation (LDA), while for Twitter they use a modified LDA under the assumption that most tweets refer to a single topic. They use metrics including the distribution of categories, breadth of topics coverage, opinion topic and the spread of topics through re-tweets, and show that most Twitter topics are not covered appropriately by traditional news media channels. They conclude that for spreading breaking world news, Twitter seems to be a better platform than a traditional medium such as New York Times. Hong et al. compare Twitter with Yahoo! News to understand temporal dynamics of news topics (Hong, 2011). They show that local topics do not appear as often in Twitter, and they go on to compare the performance of different models (LDA, Temporal Collection, etc). (Lin, 2011) conducts a study on media biasing on both social networks and news media outlets, but is focused only on the quantity of mentions. While these studies highlight differences between social and news media, they typically lack visual support for monitoring diverse news sources.
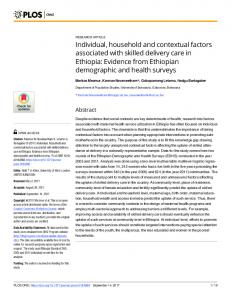
3. ACQUISITION AND AGGREGATION OF CLIMATE CHANGE MICROPOSTS Climate Change is a global issue characterized by diverse opinions of different stakeholders. Understanding the key topics in this area, their global reach and the opinions voiced by different parties is a complex task that requires investigating how these dimensions relate to each other. The Media Watch on Climate Change portal (www.ecoresearch.net/climate) addresses this task by providing advanced analytical and visual methods to support different types of information seeking behavior such as browsing, trend monitoring, analysis and search. The underlying technologies have originally been developed for monitoring traditional news media (Hubmann, 2009) and have recently been adapted for use with social media sources, in particular micropost content harvested from Twitter, YouTube and Facebook. Between April 2011 and March 2012, the system has collected and analyzed an estimated 165,000 microposts from these channels. To support a detailed analysis of the collected microposts, we use a variety of visual metaphors to interact with contextual features along a number of dimensions: temporal, geographic, semantic and attitudinal. A key strength of the interface is the rapid synchronization of multiple coordinated views. It allows selecting the relevant data sources and provides trend charts, a document viewing panel as well as just-in-time information retrieval agents to retrieve similar documents in terms of either topic or geographic location. The right side of the interface contains a total of four different visualizations (two of which are being shown in Figure 1), which capture global views on the dataset. In addition to the shown semantic map (= information
35
laandscape; see Section S 4) and tag t cloud, users can also selectt a ggeographic map and an ontology y graph. Any of these t views can be b cclosed, maximizzed, or opened in a separate pop-up window to aallow a more tho orough inspection (the views rem main synchronizeed eeven when placeed in different windows). w While the Media Watcch oon Climate Chan nge focuses on environmental e co overage, the sam me teechnologies are currently being g used for other domains as weell, ffor example, forr the Web intellligence platform ms of the Nation nal O Oceanic and Atm mospheric Admiinistration (NOA AA), the Nation nal C Cancer Institute (NCI), and thee Vienna Chamb ber of Commerce aand Industry (seee www.weblyzarrd.com). T The portal's visu ualizations proviide a good startiing point for an nalyyzing micropostts along a variety y of contextual features, f in partiicuular in the area of o climate change. The system does d not reflect th he ddynamic charactter of these micropost m stream ms, however, an nd thherefore misses a key benefit of social media – that of capturin ng eevents as they un nfold. To overcome this limitatio on, we are curren ntlyy developing the following set of novel visualiizations that focus oon the longitudin nal and temporal analysis of micrropost streams: 11.
The dynam mic topography information laandscapes are an a extension off the information n landscapes parradigm. Instead of capturing th he state of the information spacce at discrete mom ments in time, the topograaphy is continu uously updated as ublished (Section 4). new microposts are being pu
2.
Thhe news flow diiagrams visualizze microposts froom multiple soocial media channnels in real timee, and reveal correlations in terrms of the topicss that they mentiion (Section 5).
3.
Thhe cross-media analysis charts allow longitudinnal analyses off frequency and sentiment for aany given topicc and across daata sources (e.g.., between sociaal media, news media, and thee blogosphere; ssee Section 6).
4. DY YNAMIC T TOPOGRAPHY INFO ORMATION N LANDSC CAPE Informaation Landscapees represent a ppowerful visualiization technique ffor conveying toopical relatednesss in large docum ment repositories ((Krishnan, 20077). Yet, the traaditional conceppt of information landscapes onlly allows for viisualizing static conditions. We hav ave made use oof such static laandscapes whenn visualizing traditioonal news mediia, which were less dynamic than social media ssources and wheere it was sufficcient to recompuute the information landscape at weeekly intervals. For vissualizing highly dynamic microopost streams, hoowever, this is not a satisfying soluution. What is rrequired insteadd is a visual represeentation such ass ThemeRiver (H Havre, 2002) thhat conveys changees in topical clussters. Unfortunattely, most of theese representations lack the means tto express compplex topical relattions and are therefoore no substitute for the informattion landscape m metaphor.
Figure 1. Sccreenshot of thee Media Watch h on Climate Ch hange (www.ecooresearch.net/cllimate)
· #MSM2012 · 2nd Workshop on Making Sense of Microposts ·
36
vi sualized. The faalling bar metaphhor was quite poopular a few yeears ago due to tthe success of thhe Digg Stack vvisualization [B Baer 2008].
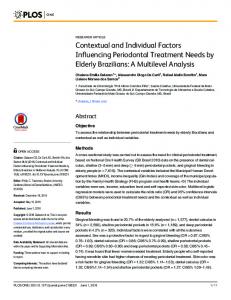
Figure 2. Inforrmation landsca ape on climate change c coverage Inn previous reseearch, we have introduced dyn namic topograph hy innformation land dscapes (Sabol ett al., 2010) to ad ddress both topiccal relatedness and rapidly changin ng data. Dynamic topography ini fformation landsccapes are visuall representationss based on a geeoggraphic map metaphor where topical relatedn ness is conveyeed thhrough spatial proximity in th he visualization space with hillls representing agg glomerations (clu usters) of topicaally similar doccum ments. As shown in Figure 2, the t hills are lab beled with sets of ddominant keyword labels (n-gram ms) extracted fro om the underlyin ng ddocuments to faccilitate the users' orientation.
2.
M Multi-source staccked bars and ccolor-coded senttiment bars. Eaach falling wordd is color-coded to represent eithher its provennance or its assoociated sentimennt value. Figure 33, for examplee, uses the colorr of the falling w words to reflectt their origin (T Twitter: gray, Faacebook: blue m marine, YouTubee: red). This coolor-coding is m maintained in thhe keyword barrs, each bar shhowing through its diversely coolored portions tthe percentagge of mentions oof the correspondding keyword w within the indivvidual media soources. This alloows inferring thhe most and leaast mentioned ttopics across soources. The sam me metaphor caan be used to shhow sentiment vaalues instead off provenance (nnot shown in Figuure 3).
3.
Thhreaded arcs. W We use an adapptation of the thhreaded arcs di splay to conveyy associations bbetween the keyywords that me document. D Dynamic link patterns conapppear in the sam veeyed through shifting arcs allow w us to understaand how the asssociations, initiaally displayed thhrough falling bbars, modify ovver time. Related keywords aree highlighted to quickly noticce them. Figure 3b shows the toopic “ideas”, whhich has appeeared seven timees, co-occurs most frequently w with the two toppics: “professorr” and “responsee”. These threadded arcs are onnly displayed whhen we click on a keyword bar.
Color-ccoding is an impportant part of tthis visualizationn. We use it to highhlight various asppects of the data:
M Micropost stream ms are characterrized by the rapid emergence an nd ddecay of topics.. The topical sttructure changees with each neew pposting. Dynamic information landscapes convey y these changes as teectonic processees which modiffy the landscap pe topography aca ccordingly. Risin ng hills indicatee the emergence of new topiccs; sshrinking hills a fading of existin ng ones. In the process p of generaatinng information landscapes, hig gh-dimensional data is projecteed innto a lower-dimensional space.
x
Sentiment cooloring – the collor of the bars caan represent the sentimentt of a certain toppic (see Figure 3a);
x
55. NEWS FLOW F DIAG GRAM
Source coloring – words can also be ddisplayed as stacked barss with specific colors that reepresent the sources in thhe stacked layouut (provenance innformation); Figure 3b, ffor example, shhows a situationn where we have three sources (Faceboook, Twitter, YoouTube) and keywords froom one source (Y YouTube) fallingg;
x
Arc coloring – we use darkerr shades of gray for stronger tween the termss (i.e., they co--occur more relations betw frequently), cconnecting the m most related term ms.
W While the dynam mic topography information lan ndscape metaph hor ddepicts the evolu ution of topic cllusters within a collection of mim ccroposts withoutt differentiating their origin, so ome scenarios rer qquire a comparattive analysis of individual i micro opost streams. Th he tw wo key problem ms related to the visualization off microposts orig ginnating from multtiple social med dia sources is to show their prov vennance as well as a the dynamic changes of top pical associations bbetween them. The T News Flow Diagram D concep pt addresses theese isssues by integratting several visu ual metaphors into a single displaay (see screenshot in n Figure 3): 11. Falling barr graphs – Each micropost (Twitter ( messag ge, Facebook status s update, YouTube Y messag ge) is representeed internally th hrough the title of o the post, its tiime of publishin ng, its content, and a list of asssociated keywo ords. When a neew ualize, in real-tiime, its respectiv ve micropost iss posted we visu associated keywords k throug gh falling word ds. One documeent generates one o falling word d for each mentioned topic. Th he falling word ds will "hit" the lower l part of thee visualization an nd dissolve into o the correspond ding keyword baar, which increasses in size acco ordingly. Figure 3 depicts how topics t fall towards their respective keyword bars (e.g., “eexperiences” an nd “friends” in n the upper diag gram). A keyworrd bar collects all a mentions off a certain topic in microposts from f different sos cial media channels c and, th herefore, its heig ght correlates wiith the populariity of the topic in the social med dia outlets that are a
· #MSM2012 · 2nd Workshop on Making Sense of Microposts ·
To dem monstrate how aassociations evollve over time, w we show the same w word (“ideas”) inn both diagramss: Figure 3a uses color coding forr sentiment infoormation, Figuree 3b for distingguishing the source (users can easiily switch betweeen both modess). In Figure 3a, “iddeas” has a stronnger connectionn with “responsee” than with “oxfam m”, but the wordd has only two hits. Figure 3bb shows that after seeven hits, “ideass” has a strongeer connection w with “professor”, thhan with “respoonse”, and alsoo the same weaak link with “oxfam m”. Future versioons of the visuallization module will include informaation related to tthese connectionns in the tooltipss, emphasizing thee importance of interactivity andd revealing the eevolution of connecctions over time. wcases the poweerful mechanism m of combinThis viisualization show ing varrious visual metaaphors with coloor-coding. We uuse the news flow diiagrams to identtify key topics ((we only show tthe 50 most importaant terms), to ddescribe the relations betweenn them (cooccurreence of terms iin a micropost are displayed through the falling bars), and to shhow the evolutioon of social meddia coverage over tim me (dynamic chaanges in the disttribution of keyw words/topics across various social media sources is represented through the lower aarcs).
37
Figure 3. News N Flow Diag gram with colorr coding for sho owing sentimentt (Figure 3a, ab bove) and sourcce (Figure 3b, below).
66. CROSS-MEDIA AN NALYSIS T The Media Watcch on Climate Ch hange offers lon ngitudinal analyssis (i.e., monitoring over time) in terms of topic freq quency, sentimeent aassociated to a topic and disag greement over a topic. Howeveer, thhese trend chartts are only plotteed over a single data source (e.g g., eeither news mediia or social mediia) and are availlable only for a set s oof pre-computed d topics. Thereffore they are neeither suitable for f ssocial media streams where new w topics emerg ge rapidly, nor do d thhey allow comparing across diffferent media sou urces. T To overcome theese limitations, we w are developin ng the new visuaalizzation shown in Figure 4, which h allows (a) defiining a topic to be b m monitored over time t and (b) mon nitoring this topic across differeent m media sources seelected by clickin ng the appropriaate check-boxes in thhe interface (e.g g., traditional news n media outllets, blogs, sociial nnetworks such ass Twitter, YouTu ube and Faceboo ok). The visualizzatiion makes use of o the data collection and chartin ng frameworks of thhe portal to plot both frequency and sentiment reelated charts. B By plotting topicc frequency (i.ee., number of do ocuments per daay thhat mention thaat topic) over tiime, this visualiization shows th he im mpact of a topiic on different media m sources. For example, th he sscreenshot in Fig gure 4 depicts a query for the to opic "durban" an nd ccompares the am mount of news co overage about thee 17th Conference
· #MSM2012 · 2nd Workshop on Making Sense of Microposts ·
Parties to the U United Nations Framework Convention on of the P Climatee Change (COP P17) held in Durrban, South Afriica, from 01 Nov too 31 Dec 2011 inn traditional new ws media, Twittter postings, blogs, and NGOs. Coiinciding with thhe beginning off the conference onn the 28th of Noovember, both samples show ann increase in the covverage of this toopic. The frequuency then decliines sharply after thhe end of the eveent, which is ann effect more proonounced in the new ws media coveraage. It also show ws that coveragee of the conferencee has been far m more intense in nnews media thann in micropost streeams, except a shhort period of tim me in Decemberr. In addiition to frequenccy charts, we alsso visualize the ssentiment of the doccuments mentionning a specific ttopic. A set of ccharts shows either ppositive or negaative documents,, average sentim ment of documentss for a day or thhe standard deviiation of the senntiment over time. T These charts hellp to understand the attitude eexpressed in differennt media outlets, e.g., which outtlet has the mostt negative or positivee documents, w which outlet is characterized bby the most controvversies? A com mparison of the average sentim ment towards "COP1 7" in social m media and news media channels showed a graduall shift from posiitive to negativee in microposts, while news media sentiment remaained positive duuring the entire duration of the eveent (see screenshhot in Figure 4).
38
Figuree 4. Cross-media analysis for November N – Deccember 2011; teerm frequency distribution forr “Durban” (lefft) and average sentiment towards “C COP17” (right). A An important isssue of visualizin ng sentiment acrross media outleets iss the meaningfu ul computation of sentiment vaalues for disparaate ddocuments. The sentiment detecction algorithm cumulatively c ad dds uup the sentimen nt values of ind dividual words in i a document to ccompute an overrall sentiment value v for the do ocument, which is thhen normalized based on the tottal number of to okens in the doccum ment. This allows the comparrison of docum ments of differeent leengths, such as news n articles and d microposts. T The visualization n can not only trrack user-specifiied topics, but caan aalso assist the usser in finding sim milar topics by providing p a list of toop terms associaated with the qu uery term. Thesee associated term ms aare calculated using a combinatio on of significantt phrases detectio on aand co-occurren nce analysis on n the documen nt set (Hubman nn, 22009), and are aggregated a and ranked dependiing on documen nts m matching the qu uery term. A qu uery for "COP1 17", for examplle, yyields the terms "Durban", "UN NFCC" and "Cliimate Change" as aassociated termss in Twitter miicroposts. Addittional query terrm ddisambiguation is not required in this case, as a the documen nts ccollected are alreeady pre-filtered d based on theirr relevance to th he cclimate change domain. d
77. CONCLU USION AND OUTLOO OK Inn this paper we describe recent work on making g sense of micro opoosts through visu ual means. Our earlier work on the Media Watcch oon Climate Chan nge portal (www w.ecoresearch.net/climate) focuseed oon visual analyttics over traditiional news med dia and relied on o eextracting and viisualizing a weaalth of context feeatures. This chaaraacteristic of the portal p proved esssential when adaapting it to visuaalizzing micropost streams s from thrree main social media m channels, as itt enabled compllex analysis alon ng temporal, geo ographic, semanttic aand attitudinal dimensions d in th he challenging domain d of climaate cchange. Unlike many m other social media visualizations, the prressented approach relies on a rob bust infrastructu ure and combin nes ddata from multiple social media outlets. o W While the conteextual nature off the micropostts has been fullly ccapitalized upon, the existing viisualizations felll short of conveeyinng another key characteristic c off microposts, nam mely their dynam micc nature. This initiated research h into the new visualizations ded sscribed in this paper, p including g: (i) dynamic topographic t info orm mation landscap pes, which show w through tecto onic changes ho ow m major topic clussters evolve; (ii)) the news flow w diagrams whicch
· #MSM2012 · 2nd Workshop on Making Sense of Microposts ·
enable a fine-grainedd, comparative analysis acrosss micropost w they relate streamss, showing key topics being disscussed and how to eachh other; and (iii) cross-media anaalysis based on longitudinal dataset s containing freqquency and sentiment informatioon. Future work will focuss on feature extrraction from miccroposts and visualizzations to depictt contextual andd dynamic charaacteristics of micropposts. We are currrently working on more robust methods for extractiing contextual ffeatures from m microposts, by fuurther adapting ourr current methodds to the particullarities of these texts. Some of the features that wee intend to introoduce in future releases are melines and timee series analysiss. related to interactive tim Future research will allso allow compaaring timelines aacross topics and rellated to specific events. We willl use timelines aas a starting point fo for narrative visuualizations (e.g.,, replaying the hhistory of an event oor a chain of evvents; identifyinng visual patterrns that best describbe a chain of evvents on social media). We w will compare variouss media channells since our dataasets and graphiccal tools are well suuited for such ann analysis. Finallly, we will invesstigate novel ways oof incorporatingg these individuaal visualizationss to support the com mplex analytical scenarios of deccision making toools.
8. AC CKNOWLE EDGMENT TS Key coomponents of thhe system presennted in this papper were developedd within the D DIVINE (www.w weblyzard.com//divine) and Triple-C C (www.ecoreseearch.net/triple-cc) research projects, funded by FIT T-IT Semantic Syystems of the Auustrian Researchh Promotion Agencyy and the Austriian Climate Research Program of the Austrian Cllimate and Energgy Fund (www.fffg.at; klimafondds.gv.at). Adrian Braúoveanu waas partially suppported by the strrategic grant RU/88/1.5/S/603370 (2009) on "Doctoral Schoolarships" of POSDR the Minnistry of Labor, Family and Sociial Protection, R Romania, cofinanceed by the Europeean Social Fund – Investing in P People.
9. RE EFERENCES [Adamss, 2011] Brett Adams, Dinh Phung, Svetha Venkatesh. 2011. E Eventscapes: viisualizing events over times w with emotive facets. In MM '11 Prroceedings of thhe 19th ACM Innternational Confere rence on Multimeedia, Scottsdale, AZ, USA (Novvember 28 Decem mber 01, 2011), 1477-1480.
39
[Aigner, 2011] Wolfgang Aigner, Silvia Miksch, Heidrun Schumann Christian Tominski. 2011. Visualization of Time-Oriented Data. Springer, 2011. [Archambault, 2011] D. Archambault, D. Greene, P. Cunningham, and N. Hurley. ThemeCrowds: Multiresolution Summaries of Twitter Usage. In Proc. of the 3rd Workshop on Search and Mining User-generated Contents, Glasgow, UK, October 2011. [Baer, 2008] K. Baer. Information Design Workbook. Graphic Approaches, Solutions and Inspiration + 30 Case Studies. Rockport Publishers, 2008. [Diakopoulos, 2010] N. Diakopoulos, M. Naaman, F. Kivranswain. 2010. Diamonds in the Rough: Social Media Visual Analytics for Journalistic Inquiry, IEEE Symposium on Visual Analytics Science and Technology (VAST). [Dork, 2010] Marian Dork, Daniel Gruen, Carey Williamson, and Sheelagh Carpendale. A visual backchannel for large-scale events. TVCG: Transactions on Visualization and Computer Graphics, 16(6):1129-1138, Nov/Dec 2010. [Havre, 2002] Havre, S., Hetzler, E., Whitney, P., and Nowell, L.: ThemeRiver: Visualizing Thematic Changes in Large Document Collections. IEEE Transactions on Visualization and Computer Graphics, 8(1):9–20, 2002. [Heer, 2005] J. Heer and D. Boyd. Vizster: Visualizing online social networks. In IEEE Symposium on Information Visualization, 2005. [Hong, 2011] Liangjie Hong, Byron Dom, Siva Gurumurthy, Kostas Tsioutsiouliklis. 2011. A Time-Dependent Topic Model for Multiple Text Streams. KDD'11, August 21–24, 2011, San Diego, California, USA. [Hubmann, 2009] Alexander Hubmann-Haidvogel, Arno Scharl, and Albert Weichselbraun. 2009. Multiple coordinated views for searching and navigating Web content repositories. Inf. Sci. 179, 12 (May 2009), 1813-1821. [Krishnan, 2007] Krishnan, M., Bohn, S., Cowley, W., Crow, V., and Nieplocha, J. 2007. Scalable visual analytics of massive textual datasets. 21st IEEE International Parallel and Distributed Processing Symposium. IEEE Computer Society. [Lin, 2011] Yu-Ru Lin, James P. Bagrow, David Lazer. 2011. More Voices Than Ever? Quantifying Media Bias in Networks. In: Proceedings of the Fifth International AAAI Conference on Weblogs and Social Media, 2011.
· #MSM2012 · 2nd Workshop on Making Sense of Microposts ·
[Marcus, 2011] Adam Marcus, Michael S. Bernstein, Osama Badar, David R. Karger, Samuel Madden, and Robert C. Miller. 2011. Twitinfo: aggregating and visualizing microblogs for event exploration. In Proceedings of the 2011 annual conference on Human factors in computing systems (CHI '11). ACM, New York, NY, USA, 227-236. [Meyer, 2011] B. Meyer, K. Bryan, Y. Santos, Beomjin Kim. 2011. TwitterReporter: Breaking News Detection and Visualization through the Geo-Tagged Twitter Network. In: Proceedings of the ISCA 26th International Conference on Computers and Their Applications, March 23-15, 2011, Holiday Inn DowntownSuperdome, New Orleans, Louisiana, USA. ISCA 2011, 84-89. [Peters, 2010] M. Peters. 2010. Four Ways to Visualize voter Sentiment for the Midterm Elections. Mashable Social Media. http://mashable.com/2010/10/29/elections-data-visualizations/. [Sabol, 2010] Sabol, V., Syed, K.A.A., et al. 2010. Incremental Computation of Information Landscapes for Dynamic Web Interfaces. 10th Brazilian Symposium on Human Factors in Computer Systems (IHC-2010). M.S. Silveira et al. Belo Horizonte, Brazil: Brazilian Computing Society: 205-208. [Scharl, 2001] Scharl, A. 2001. Explanation and Exploration: Visualizing the Topology of Web Information Systems, International Journal of Human-Computer Studies, 55(3): 239-258. [Shamma, 2009] David A. Shamma, Lyndon Kennedy, Elizabeth F. Churchill. 2009. Tweet the Debates: Understanding Community Annotation of Uncollected Sources. In The first ACM SIGMM Workshop on Social Media (WSM 2009), October 23, 2009, Beijing, China. [Shamma, 2010] David A. Shamma, Lyndon Kennedy, Elizabeth F. Churchill. 2010. Tweetgeist: Can the Twitter Timeline Reveal the Structure of Broadcast Events? In ACM Conference on Computer Supported Cooperative Work (CSCW 2010), February 6-10, 2010, Savannah, Georgia, USA. [Zhao, 2011] Wayne Xin Zhao, Jing Jiang, Jianshu Weng, Jing He, Ee-Peng Lim, Hongfei Yan and Xiaoming Li. 2011. Comparing Twitter and Traditional Media using Topic Models. in Advances in Information Retrieval - 33rd European Conference on IR Research, ECIR 2011, Dublin, Ireland, April 18-21, 2011. Proceedings. Lecture Notes in Computer Science 6611, Springer 2011, 338-349.
40