Visualizing Geospatial Co-authorship Data on a Multitouch Tabletop Till Nagel1,2, Erik Duval1, and Frank Heidmann2 Dept. Computerwetenschappen, Katholieke Universiteit Leuven, Celestijnenlaan 200A, 3001 Heverlee, Belgium 2 Interaction Design Lab, University of Applied Sciences Potsdam, Pappelallee 8-9, 14469 Potsdam, Germany
[email protected],
[email protected],
[email protected] 1
Abstract. This paper presents Muse, a visualization of institutional coauthorship of publications. The objective is to create an interactive visualization, which enables users to visually analyze collaboration between institutions based on publications. The easy to use multitouch interaction, and the size of the interactive surface invite users to explore the visualization in semi-public spaces. Keywords: geo-visualization, tabletop interfaces, human computer interaction.
1 Introduction There has been a vast amount of research in the areas of bibliometry and scientrometry to extract and specify the metrics of scientific publication and citation networks. Several approaches to visualize these networks have been reported on ([1], [2], [3]). The objective of our visualization is not to study individuals and their personal co-authorship networks, but rather to enable analyzing the connection network of their affiliations. More specifically, our aim is to direct attention to the spatial relations, to allow users the visual exploration of their scientific neighborhood. For this, we created an interactive geo-visualization with an emphasis on the relations between universities and research centers, and their geographical origins. We do not intend to enable the visual analytics of massive amount of publication data, but rather to support the exploration of scientific collaboration in a domain-specific field. The paper introduces Muse, a working prototype, whose main purpose is to ease the exploration of collaborations between institutions. In addition, the use of a large display tabletop, as well as the aimed-for simplicity of visualization and interaction intend to invite attendees to participate, and engage in discussions at a conference location.
2 Interactive Prototype The geo-visualization is shown on an interactive tabletop with multitouch capabilities. With the large interactive surface, the user not only views and manipulates data on a L. Dickmann et al. (Eds.): SG 2011, LNCS 6815, pp. 134–137, 2011. © Springer-Verlag Berlin Heidelberg 2011
Visualizing Geospatial Co-authorship Data on a Multitouch Tabletop
135
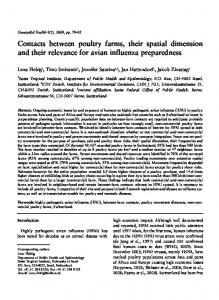
single user system, but operates in a collaboratively created and used information space. The inter-institutional relationships are based on co-author data, as “co-authorship seems to reflect research collaboration between institutions, regions, and countries in an adequate manner” [4]. For this prototype, we harvested the data from the publishers of conference proceedings directly, as other publication services seldom provide address data. After cleaning and aggregating, we geo-coded the affiliation data. A single large world map is displayed, with all institutions and their relations based on co-authorship (Figure 1a). Cartographic information on the map comes from OpenStreetMap. We chose a reduced map style, which displays only few geographical features. The aim of the prototype is to allow exploring and understanding the visualization of geo-spatial relations. Thus, the objective of the map is to support general recognition, while being discreet enough to not hinder the display of the data and interface layers. The map can be navigated freely, while institutions can be selected to get background information as well as their relations to other institutions. Countries can be selected to retrieve basic statistics on the publications of their authors and affiliations. Interactions & Visualizations. The users are able to select the region they are interested in by panning and zooming the map through slide and pinch finger gestures (Figure 1b). Even though more complex map manipulations are possible, we chose this simple interaction approach, in order to enable the user to concentrate on the map, with less their efforts. Affiliations are represented by markers at their geo-location. The size of a circle indicates the overall amount of papers written by authors from that institution. In the lower left corner a legend explaining the size of the circles is shown (Figure 1a). By tapping on a circle the name of its institution is displayed atop, and relations to other institutions are shown. Users can select a country by tapping on it. That country is selected, and additional information is shown in a data widget in the lower right corner, similar as in the first prototype. In detail, the number of papers, authors, and institutions over the years are displayed as bar diagrams (Figure 1a). As long as the user has not tapped anywhere, the widget displays a subtle hint to communicate this interaction pattern. When two countries are selected the prototype displays the diagrams besides each other, allowing the user to compare them. Connections. Relations between institutions are visualized by connecting lines between the two markers. We adhered to the schema most visualizations of social networks use, in that “points represent social actors and the lines represent connections among the actors.” [5] The visual lines connect two institutions transparently, to not obstruct the underlying map or markers. A visual connection is shown if authors from the two institutions published at least one paper together, but there is no indication of the amount of collaboratively written
136
T. Nagel, E. Duval, and F. Heidmann
Fig. 1. (a) Map with one selected institution and its co-authorship connections. (b) A user doing the pinch gesture on the tabletop to zoom-in the map.
papers. Instead, the visual style of the connections does vary depending on the overall amount of published papers of both the selected institution and the related institutions.
3 Evaluation We performed a formative user study with a working prototype on an interactive tabletop. The aim was to gather feedback on the intelligibility of the visualization, and the usability of the interactions. The study was designed as pluralistic usability walkthrough, with a semi-structured interview guiding it. We conducted the user study at a conference setting, in order to report on users doing real tasks, while measuring in-context usefulness of the prototype. We recruited nine male and three female participants, aged 27 to 52 years, from the attendees of the EC-TEL 2010 conference. We asked the participants to execute selected tasks, and to answer questions concerning the legibility and understandability of the visualized information. In the post-test, we asked the participants to fill out a questionnaire on their opinions and preferences to determine the perceived usefulness of the visualization. We used a 5-point Likert scale with items ranging from “strongly disagree” (1) to “strongly agree” (5) to seven given statements. This survey was done privately and anonymously, with 11 out of 12 participants responding. The participants had great fun (median: 5), and were strongly satisfied using Muse (median: 5). Most agreed or strongly agreed (median: 4) to the statement, that the visualization helped them to better understand research collaboration, but only few found that it supported them to be more effective in research collaboration (median: 3.5). Overall, the participants strongly found the prototype to be useful (median: 5) and easy to use (median: 5).
Visualizing Geospatial Co-authorship Data on a Multitouch Tabletop
137
4 Conclusion We presented Muse, a working prototype for exploring collaborations between institutions. Our main objectives were to create a tool with simple interaction mechanisms, and a comprehensible and aesthetically pleasing geo-visualization, so that interested stakeholders can use it without much effort. Visualization of spatial properties supports users to understand geographical patterns. The plain display of locations of institutions on a map helped users to see real-world clusters in a scientific field. The geographical distribution of the institutions, as well as the visualization of the amount of their publications has been found to be easily understandable. Through interactive filtering, the users are able to explore the relations between their affiliations and other institutions, and could gather insights into the collaborations in their research field. We see the Muse prototype with the used data set as beneficial case study. The results of our usability study, and the feedback gathered in expert interviews ascertain the real need for such a tool.
References 1. Chen, C.: Trailblazing the Literature of Hypertext: Author Co-Citation Analysis (19891998). In: Proc. HT 1999, ACM, New York (1999) 2. Henry, N., Goodell, H., Elmqvist, N., Fekete, J.-D.: 20 Years of Four HCI Conferences: A Visual Exploration. International Journal of HCI 23(3), 239–285 (2007) 3. Ponds, R., Van Oort, F.G., Frenken, K.: The geographical and institutional proximity of research collaboration. Papers in Regional Science 86(3), 423–443 (2007) 4. Glänzel, W., Schubert, A.: Analyzing Scientific Networks through Co-authorship. In: Moed, H.F., et al. (eds.) Handbook of Quantitative Science and Technology Research, pp. 257–276. Kluwer Academic Publishers, Dordrecht (2004) 5. Freeman, L.: Visualizing Social Networks. Journal of Social Structure 1 (2000)