Visualizing middle ear structures with CT – Studying morphology (bone and soft tissue) & dynamics Jan Buytaert1, Johan Aerts1, Wasil Salih1, Daniël De Greef1, John Peacock1, Manuel Dierick2, Luc Van Hoorebeke2 and Joris Dirckx1 1
Laboratory of BioMedical Physics, University of Antwerp, Groenenborgerlaan 171, B-2020 Antwerp 2 Centre for X-ray Tomography, Ghent University, Proeftuinstraat 86, B-9000 Ghent [email:
[email protected]]
Keywords: morphology, staining, soft tissue, modelling, stereoscopy, dynamics, middle ear ABSTRACT The middle ear is a complex biomechanical impedance match between sound waves in air and in the fluid of the cochlea. Finite element modelling is a promising approach to study the behavior of this system. This method requires accurate and three-dimensional morphological data as input for its simulations. Till recently, no high-resolution and complete models were available. We used X-ray micro-computed tomography on human middle ears which, combined with soft tissue staining, delivered accurate models of both bone and soft tissue structures. These unprecedented and complete models allowed us to obtain novel insights in the shape and morphology of the human middle ear, unknown before, and can now be used for modelling. Furthermore, using a new X-ray stereoscopy method combined with grayscale analysis, we are also able to study the dynamics of the middle ear ossicular chain in periodic motion. 1. INTRODUCTION The middle ear forms an essential part of the ear consisting of three small bones and the eardrum. Understanding its working principles has been a quest for many researchers, and its exact functioning is still not fully understood. High realism finite element modeling is becoming a widespread used technique in middle ear research, but highly accurate morphological input data are needed. With this work, we first of all aim to contribute to the field of middle ear mechanics, by providing the necessary input for finite element modelling. Exact morphological data is needed in 3D on the shape, location and dimensions of all middle ear structures, including ligaments and the two muscles present in the middle ear. Where do the suspensory ligaments attach to the hearing bones (ossicles)? What is the volume, shape and orientation of the muscles, ligaments, ossicles? Do the ossicles possess hollow internal structures and/or blood vessels? How are the joints shaped and held together? These questions on 3D morphology can be answered by combining state-of-the-art X-ray micro-computer tomography with a staining procedure to make soft tissue visible in back-projected cross sections. These data required specialist manual segmentation by researchers with expert notion of human middle ear morphology. Secondly, a new method was developed by us to measure the 3D motion of the middle ear ossicles with an accuracy of about 10 µm. The method combines the X-ray stereoscopy with the grayscale information obtained from X-ray shadow images. Moreover, the setup that we have developed makes use of a single X-ray point source, unlike the classical stereoscopy setups where two sources were used. 2. MATERIALS AND METHODS 2.1.
Morphology of soft and bony tissue of the human middle ear
In total six 3D models of the middle ear were constructed from microCT-scans of healthy temporal bones. First, the middle ear was dissected from the temporal bone, and a small hole was drilled in the cavity side to enable the injection of staining fluid. To preserve the samples, they were stored for 4 days in a 4% formaldehyde solution. Afterwards, they were stained for 5 days in a 3% solution of phosphotungstic acid
(PTA) in water. After flushing the samples with water to remove the residual PTA, they were scanned with the X-ray microtomograph of the centre for X-ray microtomography at Ghent University. Resolutions ranging from 19 to 23 µm were obtained. The segmentation and model construction was done in Amira 5.3. 2.2.
X-ray stereoscopy with grayscale analysis for dynamic middle ear behavior
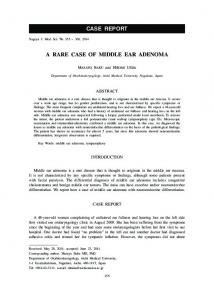
The ossicles in the middle ear of rabbit and gerbil were marked with tungsten beads, and X-ray images were taken while a sinusoidally changing pressure was applied to the middle ear. Two images were recorded from different directions by rotating the object over a 90 degree angle between imaging. The 3D coordinates of the marker points (tungsten beads) in the World Coordinates System (WCS) could then be obtained from their coordinates in the Camera Coordinates System (CCS) in the scanned images (Salih et al. 2011ab). Since the ossicles moved during the X-ray imaging due to the applied air pressure, the integrated intensity along the marker points’ path of motion showed different gray values due to the motion speed. When a marker remained for a long time in a given position, more X-rays were absorbed and vice versa, as shown in figure 1. From the grayscale values the time information at each point along the path of motion could then be obtained by integration (Salih et al. 2011b).
(a) (b) Figure 1: Snapshots of X-ray shadow images show three tungsten beads on top of the malleus ossicle of a gerbil at: (a) rest state before applying a pressure and (b) during linear loading of the tympanic membrane with a pressure of 2 kPa at a frequency of 50 Hz. The scale bar is 500 µm.
3. RESULTS AND DISCUSSION 3.1.
Morphology of soft and bony tissue of the human middle ear
Results are shown here for one temporal bone scan, although six scans were made in total. Figures 2(a) and 2(b) both show a cross section through the middle ear. Soft tissue structures such as the tympanic membrane and its connection with the manubrium of the malleus (manubrial fold), the incudomallear joint, and the middle ear muscles can clearly be seen on the images. Particularly the fibrous structure of both tensor tympani and stapedius muscle is nicely shown. Also visible are mucosal layers and the chorda tympani. Figures 3(a) and 3(b) show 3D VRT (Volume Rendering Technique) images of the ossicles and the eardrum. Surrounding structures were removed by cropping the image dataset around the ossicles or eardrum respectively. The ossicles are colored from segmentation data, and the soft tissue is visualized by choosing the appropriate threshold. The simple threshold selection demonstrates how easily the soft tissue can be distinguished from the background. Figure 4 shows the 3D surface model that was constructed from the microCT image data. The model contains unprecedented data and insights on the following structures: malleus, incus, and stapes tympanic membrane, and connection with manubrium of malleus incudomallear joint, incudostapedial joint, and annular stapedial ligament posterior incudal ligament, anterior mallear ligament chordi tympani nerve, tensor tympani and stapedius muscles and tendon
(a) (b) Figure 2: Cross sections through the middle ear: (a) through incus and malleus, and (b) along the tensor tympani muscle.
(a) Figure 3: 3D VRT images of (a) the ossicles, and (b) the tympanic membrane.
(b)
Figure 4: 3D surface model of the human middle ear.
3.2.
X-ray stereoscopy with grayscale analysis for dynamic middle ear behavior
With the new method that we developed the 3D displacement of the middle ear ossicles, in both gerbils and rabbits, as a function of quasi-static pressure changes has been studied. Using the time information obtained from the grayscale values, the motion of the ossicles can be reconstructed and demonstrated on the high-resolution computer models shown in figure 5 (Salih et al. 2012). The results show that the 3D displacement can be calculated with an accuracy of approximately 10 µm while the velocity along the path of motion can be reconstructed with a RMSE of 5%.
Figure 5: Snapshot of the 3D motion of a rabbit ossicular chain during pressurizing the EC with 2 kPa (peak-to-peak) at a frequency of 50 Hz. Arrows indicate the displacement as a function of pressure. (a) malleus, (b) the incus, (c) the stapes and (d) the cochlea.
4. CONCLUSIONS Through a soft tissue staining method, we were able to generate the highest resolution and most complete (human) middle ear model from microCT to date. The resulting 3D models give new insights in the morphology of the middle ear. Furthermore, we developed a new X-ray stereoscopy method, which through grayscale analysis, is able to measure periodic motion of the ossicular chain in the middle ear. 5. ACKNOWLEDGEMENTS This work was supported by the Flemish agency for Innovation by Science and Technology (IWT), the Research Foundation – Flanders (FWO), and the Sudanese Alneelian University. We would like to thank Dr. Jean-Marc Gerard of the university hospital St. Luc and Joris Walraevens of Cochlear technology centre Belgium for putting temporal bones at our disposal. We appreciate the use of and collaboration with the scanning facility of UGCT. 6. REFERENCES Bekhta, P. and Niemz, P. (2003). Effect of high temperature on the change in color, dimensional stability and mechanical properties of spruce wood. Holzforschung, 57, 539-546 Salih, W.H.M., Soons, J.A.M., and Dirckx, J.J.J. (2011a), High-resolution 3D translation measurements using point source X-ray stereoscopy, Measurement Science and Technology, 22, 025502. Salih, W.H.M., Buytaert, J.A.N., and Dirckx, J.J.J. (2011b), Measurement of micro-motions within non-transparent objects using gray scale information in X-ray stereo projection imaging, Measurement Science and Technology, 22, 03580. Salih, W.H.M, Buytaert, J.A.N. , Aerts, J.R.M., Vanderniepen, P., Dierick, M. and Dirckx, J.J.J. (2012), Open access high resolution 3D models of cat, gerbil, rabbit, rat and human middle ears, Hearing Research, 284(1-2), 1-5.