R.M. Kirby, H. Marmanis. Division of Applied ...... [23] Michael P. Salisbury, Sean E. Anderson, Ronen Barzel, and David H. Salesin. Interactive penâandâink ...
Visualizing Multivalued Data from 2D Incompressible Flows Using Concepts from Painting R.M. Kirby, H. Marmanis D.H. Laidlaw Division of Applied Mathematics Department of Computer Science Brown University
Abstract We present a new visualization method for 2d flows which allows us to combine multiple data values in an image for simultaneous viewing. We utilize concepts from oil painting, art, and design as introduced in [1] to examine problems within fluid mechanics. We use a combination of discrete and continuous visual elements arranged in multiple layers to visually represent the data. The representations are inspired by the brush strokes artists apply in layers to create an oil painting. We display commonly visualized quantities such as velocity and vorticity together with three additional mathematically derived quantities: the rate of strain tensor (defined in section 4), and the turbulent charge and turbulent current (defined in section 5). We describe the motivation for simultaneously examining these quantities and use the motivation to guide our choice of visual representation for each particular quantity. We present visualizations of three flow examples and observations concerning some of the physical relationships made apparent by the simultaneous display technique that we employed.
1
Introduction
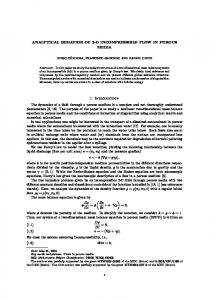
Within the study of fluid mechanics, many mathematical constructs are used to enhance our understanding of physical phenomena. The use of visualization techniques as tools for developing physical intuition of mathematically defined quantities is common. Scientific visualization not only expands our understanding of physical phenomena, by allowing us to examine the evolution of quantities like momentum, but also it provides a catalyst for the development of mathematical models which describe the time evolution of complex flows. In addition to the examination of the primitive variables, i.e. the velocity and the pressure, the examination of derived quantities such as the vorticity has provided a better understanding of the underlying processes of fluid flow. Vorticity is a classic example of a mathematical construct which provides information not immediately assimilated by merely viewing the velocity field. In Figure 1, we illustrate this idea. When examining only the velocity field, it is difficult to see that there is a rotational component of the flow in the far wake region of the cylinder. But, when vorticity is combined with the velocity field, the underlying dynamics of vortex generation and advection is more apparent. Though vorticity cannot be measured directly, its relevance to fluid flow was recognized as early as 1858 with Helmholtz’s pioneering work. Vorticity as a physical concept is not necessarily intuitive to all, yet visualizations of experiments demonstrate its usefulness, and hence account for its popularity. Vorticity is derived from velocity, and vice versa under certain constraints [2]. Hence, vorticity does not give any new information that was not already available from the velocity field, but it does emphasize the
rotational component of the flow. The latter is clearly demonstrated in Figure 1, where the rotational component is not apparent when one merely views the velocity. In the same way that vorticity as a derived quantity provides us with additional information about the flow characteristics, other derived quantities such as the rate of strain tensor, the turbulent charge and the turbulent current could be of equal use. Because the examination of the rate of strain tensor, the turbulent charge and the turbulent current within the fluids community is relatively new, few people have ever seen visualizations of these quantities in well known fluid mechanics problems. Simultaneous display of both the velocity and quantities derived from it is done both to allow the fluids’ researcher to examine these new quantities against the canvas of previously examined and understood quantities, and also to allow the fluids’ researcher to accelerate the understanding of these new quantities by visually correlating them with well known fluid phenomena. To demonstrate the application of these concepts, we present visualizations of a geometry that, although simple in form, demonstrate many of the major concepts which motivate our work. By examining the well studied problem of flow past a cylinder we demonstrate the usefulness of the visualizations in a context familiar to most fluids’ researchers. We examined two-dimensional direct numerical simulation of flow past a cylinder for Reynolds number 100 and 500 [3]. This range of Reynolds numbers provides sufficient phenomenological variation to allow us to discuss the impact of visualization of the newly visualized quantities. In addition to the simulation results presented, we examine data obtained experimentally for a different geometry. This comparison demonstrates one use of the visualization method for experimentalists: data verification. We extend the visualization methods presented in [1] to problems in fluid mechanics. As in [1], we seek representations that are inspired by the brush strokes artists apply in layers to create an oil painting. We copied the idea of using a primed canvas or underpainting that shows through the layers of strokes. Rules borrowed from art guided our choice of colors, texture, visual elements, composition, and focus to represent data components. Our new methods simultaneously display 6-9 data values, qualitatively representing the underlying phenomena, emphasizing different data values to different degrees, and displaying different portions of the data from different viewing distances. These qualities lead a viewer through the temporal cognitive process of understanding interrelationships in the data much as a painting can lead a viewer through a process designed by the painter. In the remainder of the paper we first discuss the related work in visualizing multivalued data. We then describe the paintingmotivated method we employed, with specific details concerning the combination of scaler, vector, and tensor data into one visualization. In Sections 4 and 5 we present fluid flow examples where multivalued data visualization was used. We summarize and
Figure 1: Typical visualization methods for 2D flow past a cylinder at Reynolds number 100. On the left, we show only the velocity field. On the right, we simultaneously show velocity and vorticity. Vorticity represents the rotational component of the flow. Clockwise vorticity is blue, counterclockwise yellow.
present conclusions in Section 6.
2
Related work
2.1 Multivalued data visualization Hesselink et al. [4] give an overview of research issues in visualization of vector and tensor fields. While they describe several methods that apply to specific problems, primarily for vector fields, the underlying data are still difficult to comprehend; this is particularly true for tensor fields. The authors suggest that “feature-based” methods, i.e., those that visually represent only important data values, are the most promising research areas, and our approach embraces this idea. Statistical methods such as principal component analysis (PCA) [5] and eigenimage filtering [6] can be used to reduce the number of relevant values in multivalued data. In reducing the dimensionality, these methods inevitably lose information from the data. Our approach complements these data-reduction methods by increasing the number of data values that can be visually represented. Different visual attributes of icons can be used to represent each value of a multivalued dataset. In [7], temperature, pressure, and velocity of injected plastic are mapped to geometric prisms that sparsely cover the volume of a mold. Similarly, in [8] data values were mapped to icons of faces: features like the curve of the mouth or size of the eyes encoded different values. In both cases, the icons capture many values simultaneously but can obscure the continuous nature of fields. A more continuous representation using small line segment-based icons shows multiple values more continuously [9]. Our work builds upon these earlier types of iconic visual representation. Layering has been used in scientific visualization to show multiple items: in [10, 11], transparent stroked textures show surfaces without completely obscuring what is behind them. These results are related to ours, but our application is 2D, and so our layering is not as spatial as in the 3D case. Our layering is more in the spirit of oil painting where layers are used more broadly, often as an organizing principle.
2.2 Flow visualization A number of flow-visualization methods display multivalued data. The examples in [12, 13] combine surface geometries representing cloudiness with volume rendering of arrows representing wind
velocity. In some cases, renderings are also placed on top of an image of the ground. Unlike our 2D examples, however, the phenomena are 3D and the layering represents this third spatial dimension. Similarly, in [14], surface particles, or small facets, are used to visualize 3D flow: the particles are spatially isolated and are again rendered as 3D objects. A “probe” or parameterized icon can display detailed information for one location within a 3D flow [15]; it faithfully captures velocity and its derivatives at that location, but does not display them globally. Our data contain fewer values at each location, because we are working with 2D flow, but our visualization methods display results globally instead of at isolated points. Spot noise [16] and line integral convolution [17] methods generate texture with structure derived from 2D flow data; the textures show the velocity data but do not directly represent any additional information, e.g., divergence or shear. The authors of [16] mention that spot noise can be described as a weighted superposition of many “brush strokes,” but they do not explore the concept. Our method takes the placement of the strokes to a more carefully structured level. Of course, placement can be optimized in a more sophisticated manner, as demonstrated in [18]; we would like to explore combining these concepts with ours. Currently our stroke placement is simple and quick to implement while providing adequate results.
2.3 Computer graphics painting Reference [19] was the first to experiment with painterly effects in computer graphics. Reference [20] extended the approach for animation and further refined the use of layers and brush strokes characteristic for creating effective imagery. Both of these efforts were aimed toward creating art, however, and not toward scientific visualization. Along similar lines, references [21, 22, 23] used software to create pen and ink illustrations for artistic purposes. The pen and ink approach has successfully been applied to 2D tensor visualization in [24]. In reference [1], painterly concepts as used in our work were presented for visualizing diffusion tensor images of the mouse spinal cord. In that work both a motivation and a methodology for the techniques used here were presented. The goal of our work is to visualize simultaneously both new and commonly used scientific quantities within the field of fluid mechanics by building on those concepts.
3
=e +
Visualization methodology
ij
We use the methodology and system of [1] to develop our visualizations. We review the methodology here. Developing a visualization method involves breaking the data into components, exploring the relationships among them, and visually expressing both the components and their relationships. For each example we explored different ways of breaking down the data so that we could gain understanding as to how the components were related. Once we achieved an initial understanding, we proceeded to the next step: designing a visual representation. In the design, we used artistic considerations to guide how we mapped data components to visual cues of strokes and layers. Our brush strokes are affinely transformed images with a superimposed texture. In choosing mappings we looked for geometric components and mapped them to geometric cues like the length or direction of a stroke. We considered the relative significance of different components and mapped them to cues that emphasized them appropriately. For example, two related parameters could map to the length and width of a stroke, giving a clear indication of their relative values. We also considered the order in which components would best be understood and mapped earlier ones to cues that would be seen more quickly. The set of mappings we selected defined a series of stroke images and a scheme for how to layer them. An iterative process of analysis and refinement followed. Sometimes our refinements involved choosing a mapping we found effective in one visualization and incorporating it into another. Sometimes we needed to change the emphasis among data components by adjusting transparency, size, or color or by representing a component with a different or additional mapping. Sometimes we needed to go further back in the process and choose a new way of breaking down the data.
4
Example 1: Rate of strain tensor
The rate of strain tensor (sometimes called the deformation-rate tensor [25]), is a commonly used derived quantity within fluid mechanics. Though commonly used and reasonably well comprehended, few have visualized this tensor due to the added complexity necessary to view multivalued data. Our motivation for combining visualization of the rate of strain tensor with velocity and vorticity is that despite many years of intense scrutiny, scientific understanding of fluid behavior is still not complete, and qualitative descriptions can still be helpful. Researchers often examine images of individual velocity-related quantities. We thought that good intuition might come from a visual representation that related these values to one another in a single image.
4.1 Data breakdown We began by choosing a breakdown of data values into components that can be mapped onto stroke attributes. Both the velocity and its first spatial derivatives have meaningful physical interpretations [25], and hence we treat them independently. The velocity is a 2vector with a direction and a magnitude in the plane, and can be visually mapped directly. The spatial derivatives of velocity form a second-order tensor known at the velocity gradient tensor. This tensor can be written as the sum of symmetric and antisymmetric parts, @ui @xj
= 12
�
@ui @xj
+ @u @x
j i
�
+ 21
�
@ui
@uj
@xj
@xi
�
;
(1)
ij :
(2)
The antisymmetric part ij reduces to the vector quantity vorticity (!k = 12 �ijk ij ), and the symmetric part eij is known as the rate of strain tensor [26]. The vorticity field determines the axis and the magnitude of rotation for all fluid elements. The rate of strain tensor determines the rate at which a fluid element changes its shape under the particular flow conditions. In incompressible flows, the instantaneous rate of strain consists always of a uniform elongation process in one direction and a uniform foreshortening process in a direction perpendicular to the first. That is, a small circle will change its shape into an ellipse, whose major and minor axes represent the rate of elongation and the rate of squeezing, respectively. In compressible flows, the latter statement is not necessarily true since expansion and compression is allowed. Nevertheless, the visualization of the rate of strain remains valuable and instructive in these flows as well.
4.2 Visualization design We wanted the viewer to first read velocity from the visualization, then vorticity and its relationship to velocity. Because of the complexity of the second-order rate of strain tensor we want it to be read last. We describe the layers here from bottom up, beginning with a primed canvas, adding an underpainting, representing the tensor values transparently over that, and finishing with a very dark, high-contrast representation of the velocity vectors. Primer The bottom layer of the visualization is light gray, selected because it would show through the transparent layers to be placed on top. Underpainting The next layer encodes the scalar vorticity value in semi-transparent color. Since the vorticity is an important part of fluid behavior, we emphasized it by mapping it onto three visual cues: color, ellipse opacity, and ellipse texture contrast (see below). Clockwise vorticity is blue and counter-clockwise vorticity yellow. The layer is almost transparent where the vorticity is zero, but reaches 75% opacity for the largest magnitudes, emphasizing regions where the vorticity is non-zero. Ellipse layer This layer shows the rate of strain tensor and also gives additional emphasis to the vorticity. The logarithms of the rates of strain in each direction scale the radii of a circular brush shape to match the shape that a small circular region would have after being deformed. The principal deformation direction was mapped to the direction of the stroke to orient the ellipse. The strokes are placed to cover the image densely, but with minimal overlap. The color and transparency of the ellipses are taken from the underpainting, so they blend well and are visible primarily where the vorticity magnitude is large. Finally, a texture whose contrast is weighted by the vorticity magnitude gives the ellipses a visual impression of spinning where the vorticity is larger. Arrow layer The arrow layer represents the velocity field measurements: the direction of the arrows is the direction of the velocity, and the brush area is proportional to the speed. We chose a dark blue to contrast with the light underpainting and ellipses, to make the velocities be read first. The arrows are spaced so that strokes overlap end-to-end but are well separated side-to-side. This draws the eye along the flow. Mask layer The final layer is a black mask covering the image where the cylinder was located. These painting concepts help create a visual representation for the data that encodes all of the data in a manner that allows us to explore the data for a more holistic understanding.
� �
�
�
�
Reynolds number 100
simulated flow
Reynolds number 500
KEY data visualization velocity speed vorticity
rate of strain divergence shear
arrow direction arrow area underpainting/ellipse color (blue=cw, yellow=ccw), and ellipse texture contrast log(ellipse radii) ellipse area ellipse eccentricity
experimental flow Figure 2: Visualization of simulated 2D flow past a cylinder at Reynolds number = 100 and 500 (top left and top right), and experimental 2D flow past an airfoil (bottom). Velocity, vorticity, and rate of strain (including divergence and shear) are all encoded in the layers of this image. With all six values at each point visible, the image shows relationships among the values that can verify known properties of a particular flow or suggest new relationships between derived quantities.
4.3 Observations
data show either compressibility effects or out of plane motion, neither of which can easily be detected by other means.
N T
Figure 2 (top left and top right) shows visualizations of 2d flow simulation results obtained using Hybrid "� �r [27], a spectral element code for solving the incompressible Navier-Stokes equations. These results were obtained from the work presented in [3]. Figure 2 (bottom) shows data measured experimentally as an airfoil is drawn through a tank of initially stationary water. An image is taken perpendicular to the axis of the airfoil using laser induced fluorescence (LIF) imaging [28]. Velocity data calculated from the LIF images lies on a rectangular grid, with some portions missing, as the figure shows in the black region. The visualization of single quantities is useful by itself. For instance, if we contrast the simulation results (Figure 2 top right and left) with the experimental data of the airfoil (Figure 2 bottom), we observe that all the ellipses have the same area in the former case whereas they do not have the same area in the latter case. In incompressible flows, the continuity equation implies that the velocity field is divergence-free, which in turn implies that the trace of the rate of strain tensor (i.e. the sum of its diagonal elements) is always zero. This simply means that the area of the fluid elements remains constant in time, regardless of their instantaneous shape. Hence, we can infer that the simulation has reproduced properly the incompressible character of the fluid flow whereas the airfoil
The multivalued data visualization, however, has additional merits. For instance, we observe that the simultaneous viewing of the vorticity field and the rate of strain tensor provides us with a physical understanding about the deformation of the fluid elements. It clearly shows that at the centers of the vortices the deformation can be rather small, dependent on the eccentricity of the fluid element with respect to the center of the vortex, whereas at the edges of vortices the fluid elements suffer a huge shearing effect. Thus the mathematical decomposition of the velocity gradient tensor (i.e. @ui =@xj ) into its symmetric (i.e. the rate of strain) and antisymmetric (i.e. the vorticity) parts acquires a visual representation.
Until now the deformation of the fluid elements was represented with qualitative sketches [29] whose direct connection to the rest of the flow field was not obvious. Through our visualization technique, we obtain not only the qualitative character of the fluid element deformation but also its quantitative properties. Moreover, all the information about the deformation can now be visually correlated to the velocity and the vorticity fields.
5
Example 2: Turbulent charge and turbulent current
following expressions: n
Turbulent charge and turbulent current are flow quantities that have not been extensively visualized. Our motivation for viewing these quantities, in conjunction with other well-studied quantities (e.g. the vorticity), has its roots in our desire to solve problems that are concerned with drag reduction. The importance of fluid mechanics to the problem of reducing the drag on a moving body is unequivocal. All airplane, boat, and car designers, at some stage of their research, have consulted engineers about possible ways of reducing the drag. This is quite reasonable, since drag reduction translates to less fuel consumption. One method of reducing the drag on a body is the appendage of riblets on the surface of the body. Though experimentally verified, the physical mechanism behind the drag reduction is not well understood. For example, some configurations and shapes of riblets do give drag reduction but some others do not. Thus, the question arises as to why this happens. What are the shapes and which are the configurations that produce drag reduction? The use of riblets everywhere on the surface is costly, thus another question is: what is the location, on the surface of an object, that will provide maximum drag reduction? The answers to the above questions can be found by inspecting visually the turbulent charge on the surface of the body [30]. Suppose we are interested in reducing the drag on a submarine. Our goal from the engineering standpoint is to find geometric modifications to our structure so that we get reasonable drag reduction with a minimum cost (and without inhibiting the purpose of our submarine). Modeling the turbulent charge on the surface of the submarine immediately delineates those regions of the geometry which could most benefit from drag reduction techniques. Unlike all other drag reduction models, the concept of turbulent charge and turbulent current succinctly provide information that is applicable to engineering design. Unlike the case of simple flows, which can be described easily in terms of vorticity, there are cases in which the visualization of vorticity, and the subsequent description of the flow by it, can be as complex as the one in terms of velocity. For example, in the case of turbulent flows, vortices are shed from the boundaries of the flow domain, they are convected away from it, and subsequently interact with each other in a fashion that has defied a satisfactory solution of practical importance for more than a century. Hence, we can legitimately ask whether we can find other quantities whose visualization in these cases can be as beneficial to our understanding as vorticity is in more simple flows.
5.1 Data breakdown We began by choosing a breakdown of data values into components that can be mapped onto stroke attributes. It has recently been suggested that two newly introduced quantities, namely, the turbulent charge n(x; t) and the turbulent current j(x; t), collectively referred to as the turbulent sources, could substitute the role of vorticity in more complicated flows. The nomenclature is not coincidental, it reflects the fact that the derivation of these quantities was based on an analogy between the equations of hydrodynamics and the Maxwell equations [31]. In particular, if we denote by u the velocity and by p the pressure then the vorticity, w, is given by u, and the Lamb vector is given by l w u. The turbulent sources are given by the
�
�
r�
(x; t) � r � l(x; t) = r2
and
j
= un + r� (u � w)u+ w �r
�
�
p �
+ 3u2 � p
2
2
+ u2
�
� ;
+ 2(l �r)u :
(3)
(4)
The later two quantities (i.e. n, j) are related to each other through a continuity type of equation where the turbulent current is the flux of the turbulent charge. In the cases where turbulent charge is generated solely at the wall, small turbulent charge implies small turbulent current.
5.2 Visualization design We designed the turbulent source visualizations so that the overall location of the turbulent charge would be visible early. The vorticity was our next priority, since comparison between the two quantities was important. Our third priority was the structure of the flow, as represented by the velocity field. Finally, we wanted fine details about the structure of all the fields, charge, current, velocity, and vorticity, available upon close examination. We describe the layers here from bottom up, as in the last example. Beginning with the same primed canvas and underpainting, continuing with a low-contrast representation of the velocity vectors, and finishing with a high-contrast representation of the turbulent sources. A final layer represents the geometry of the cylinder. Primer and underpainting Same as first example. Arrow layer The arrow layer for this example has the same geometric components – brush area proportional to speed, velocity direction mapped to brush direction, and strokes arranged closer end-to-end to give a sense of flow. This layer differs in that its emphasis is decreased. It has a low contrast with the layers below it. The low contrast is partly achieved through the choice of a light color for the arrows and partly through transparency of the arrows. Without the transparency, the arrows would appear very independent of the underlying layers. Turbulent sources layer In this layer we encode both the turbulent charge and the turbulent current. The current, a vector, is encoded in the size and orientation of the vector value just as the velocity in the arrow layer. The scalar charge is mapped to the color of the strokes. Green strokes represent negative charge and red strokes positive. The magnitude of the charge is mapped to opacity. Where the charge is large, we get dark, opaque, high-contrast strokes that strongly emphasize their presence. Where the charge is small, the strokes disappear and do not clutter the image. For these quantities, that tend to lie near surfaces, this representation makes very efficient use of visual bandwidth. The strokes in this layer are much smaller than the the strokes in the arrow layer. This allows for finer detail to be represented for the turbulent sources, which tend to be more localized. It also helps the turbulent sources layer to be more easily distinguished from the arrows layer than in the previous visualization, where the stroke sizes were closer and, therefore, harder to disambiguate visually. Mask layer The final layer is a mask representing the geometry of the cylinder. The mask is white in this example to contrast better with the turbulent sources layer.
� �
�
�
5.3 Observations The regions where the turbulent charge achieves its maximum values are the regions where the vorticity field has also very large
KEY data visualization velocity speed vorticity turbulent charge turbulent current
arrow direction arrow area underpainting: blue=cw, yellow=ccw stroke color stroke direction/area
Figure 3: Visualization of the turbulent charge and the turbulent current for a Reynolds number 500 simulated flow. Observe that charge concentrates near the cylinder and is negligible in other parts the flow. The cylinder geometry is now white to contrast with the visual representation for the turbulent sources
Reynolds number 100
Reynolds number 500
Figure 4: Close up visualization of the turbulent charge and the turbulent current at Reynolds number 100 and 500 (left and right). We are able to see the high concentrations of negative charge at the places where vorticity is being generated.
values. Nevertheless, as we have already mentioned, the advantage in thinking of terms of turbulent charge is related to its permanence close to the boundaries, in contrast to the vorticity field which is conveyed downstream. The theory proposed in [31] predicts that the turbulent charge,
n, and turbulent current, j, are the source terms of the following
linear system of equations
@L @t
r � W = 0; @W = r � L �r � r � W ; @t r � L = N (x; t) ; 2 = c r � W J(x; t) + � r � r � L ;
(5)
h i
where c2 = u2 , and the use of capital letters denotes that the corresponding quantities have been averaged. From these equations it can be shown that the turbulent current is the dominant forcing term for the velocity. An immediate consequence of this is that the turbulent current and the velocity field should be aligned. In Figure 4 we observe this alignment, especially in the region near the cylinder where we have the most significant change of flow velocity. Finally, in Figure 5, we add the rate of strain tensor to the turbulent sources visualization, adjusting the blending of the different layers to control their relative emphasis. We observe that the high values of turbulent charge are associated with an extreme deformation of the fluid elements, since it is the shear between adjacent fluid layers that transforms the kinetic energy of the fluid to molecular heat.
Figure 5: Combination of velocity, vorticity, rate of strain, turbulent charge and turbulent current for Reynolds number 100 flow. A total of nine values are simultaneously displayed.
Visualizing the turbulent sources is very informative for turbulent non-equilibrium flows. In fact, a plot of the turbulent charge distribution immediately allows us to determine whether a particular configuration of the riblets, discussed earlier, is reducing or enhancing the drag. A plot of the turbulent current can immediately reveal which flow directions are dominant (e.g. the streamwise direction in a pipe flow), even if no other information about the flow field is given. The distribution of the turbulent sources reflects succinctly the responses of the flow due to boundary conditions or external fields.
6
Summary and Conclusions
We have presented results of applying the scientific visualization approach outlined in [1] to multivalued incompressible fluid data. The approach borrows concepts from oil painting. Underpaintings showed form. We used brush strokes both individually, to encode specific values, and collectively, to show spatial connections and to generate texture and an impression of motion. We used layering and contrast to create depth. Stroke size, texture, and contrast helped to define a focus within each image and also to influence the order in which different parts of an image were viewed. The methods we employed produce images that are visually rich and represent many values at each spatial location. From different perspectives, they show the data at different levels of abstraction – more qualitatively at arm’s length, more quantitatively up close. Finally, the images emphasize different data values to different degrees, leading a viewer through the temporal cognitive process of understanding the relationships among them. We visualize quantities that have rarely been viewed before: rate of strain, turbulent charge, and turbulent current. We visualize these new quantities together with more commonly viewed quantities, allowing a scientist to use previously acquired intuition in interpreting the new values and their relationships to one another and to the more traditional quantities. Our visualization of the rate of strain tensor combined with both
the velocity and vorticity fields provides a unique pedagogical tool for explaining the dominant mechanisms responsible for certain fluid flow phenomena. Because an understanding of the deformation tensor (i.e. @ui =@xj ) is of paramount importance for one’s understanding of fluid flow phenomena, visualizing its symmetric and antisymmetric parts separately (i.e. the rate of strain tensor and the vorticity, respectively) clearly accentuates the interplay between rotational and shearing mechanisms within the flow. The visualization of turbulent charge and turbulent current combined with both velocity and vorticity allows us to use knowledge concerning the latter fields in our effort to understand the usefulness of the newly visualized quantities. It is evident from the visualizations shown that, unlike vorticity, the turbulent charge and the turbulent current are far more localized. This validates the conjectures about the potential usefulness of the model, and also suggests that we focus our attention on viewing the turbulent charge and turbulent current regions close to the surface of the cylinder. By focusing our examination to regions close to the cylinder, we see a high visual correlation between regions where turbulent charge accumulates and regions of vorticity generation. By visualizing velocity with all the subsequently derived quantities presented here, we can observe through one visualization multiple properties of the flow. The freedom to display multivalued data simultaneously allows us to get a more complete idea of both the dynamics and the kinematics of the flow, and hence provides a catalyst for future understanding of more complex fluid phenomena.
Acknowledgements We would like to acknowledge Professor George Em. Karniadakis and the CRUNCH group for the manifold support we have received. The Graduate Aeronautics Lab at Caltech (GALCIT), Galen Gornowicz, Haris Catrakis, Jerry Shan, and Paul Dimotakis, provided experimental fluid flow data and discussions of how to understand it. This work was supported by NSF (CCR-96-19649, CCR9996209); NSF (ASC-89-20219) as part of the NSF STC for Computer Graphics and Scientific Visualization; and the Human Brain Project with contributions from the National Institute on Drug Abuse and the National Institute of Mental Health.
References [1] David H. Laidlaw, Eric T. Ahrens, David Kremers, Matthew J. Avalos, Carol Readhead, and Russell E. Jacobs. Visualizing diffusion tensor images of the mouse spinal cord. In Proceedings Visualization ’98. IEEE Computer Society Press, 1998. [2] P.G. Saffman. Vortex Dynamics. Cambridge University Press, Cambridge, UK, 1992. [3] C. Evangelinos. Parallel Simulations of Flexible Cylinders subject to VIV. PhD thesis, Division of Applied Mathematics, Brown University, 1999. [4] Lambertus Hesselink, Frits H. Post, and Jarke J. van Wijk. Research issues in vector and tensor field visualization. IEEE Computer Graphics and Applications, 14(2):76–79, 1994. [5] K Jain. Fundamentals of Digital Image Processing. Prentice Hall, 1989. [6] Joe P. Windham, Mahmoud A. Abd-Allah, David A. Reimann, Jerry W. Froelich, and Allan M. Haggar. Eigenimage filtering in MR imaging. Journal of Computer-Assisted Tomography, 12(1):1–9, 1988. [7] Robert B. Haber and David A. McNabb. Visualization idioms: A conceptual model for scientific visualization systems. Visualization in scientific computing, pages 74–93, 1990.
[8] Herman Chernoff. The use of faces to represent points in k-dimensional space graphically. Journal of the American Statistical Association, 68(342):361–368, 1973.
[27] T.C.E. Warburton. Spectral/hp Methods on Polymorphic Multi-Domains: Algorithms and Applications. PhD thesis, Division of Applied Mathematics, Brown University, 1999.
[9] Robert F. Erbacher, Georges Grinstein, John Peter Lee, Haim Levkowitz, Lisa Masterman, Ron Pickett, and Stuart Smith. Exploratory visualization research at the University of Massachusetts at Lowell. Computers and Graphics, 19(1):131–139, 1995.
[28] Galen G. Gornowicz. Continuous-Field Image-Correlation Velocimetry and its Application to Unsteady Flow Over an Airfoil. Engineering thesis, California Institute of Technology, 1997.
[10] Victoria Interrante, Henry Fuchs, and Stephen M. Pizer. Conveying the 3D shape of smoothly curving transparent surfaces via texture. IEEE Transactions on Visualization and Computer Graphics, 3(2), April–June 1997. ISSN 10772626. [11] Victoria L. Interrante. Illustrating surface shape in volume data via principal direction-driven 3D line integral convolution. In Turner Whitted, editor, SIGGRAPH 97 Conference Proceedings, Annual Conference Series, pages 109– 116. ACM SIGGRAPH, Addison Wesley, August 1997. ISBN 0-89791-896-7. [12] Nelson Max, Roger Crawfis, and Dean Williams. Visualization for climate modeling. IEEE Computer Graphics and Applications, 13(4):34–40, July 1993. [13] Roger Crawfis, Nelson Max, and Barry Becker. Vector field visualization. IEEE Computer Graphics and Applications, 14(5):50–56, 1994. [14] Jarke J. van Wijk. Flow visualization with surface particles. IEEE Computer Graphics and Applications, 13(4):18–24, July 1993. [15] Jarke J. van Wijk, Andreaj S. Hin, Willem C. de Leeuw, and Frits H. Post. Three ways to show 3d fluid flow. IEEE Computer Graphics and Applications, 14(5):33–39, 1994. [16] Jarke J. van Wijk. Spot noise-texture synthesis for data visualization. In Thomas W. Sederberg, editor, Computer Graphics (SIGGRAPH ’91 Proceedings), volume 25, pages 309–318, July 1991. [17] Brian Cabral and Leith (Casey) Leedom. Imaging vector fields using line integral convolution. In James T. Kajiya, editor, Computer Graphics (SIGGRAPH ’93 Proceedings), volume 27, pages 263–272, August 1993. [18] Greg Turk and David Banks. Image-guided streamline placement. In Holly Rushmeier, editor, SIGGRAPH 96 Conference Proceedings, Annual Conference Series, pages 453–460. ACM SIGGRAPH, Addison Wesley, August 1996. held in New Orleans, Louisiana, 04-09 August 1996. [19] Paul E. Haeberli. Paint by numbers: Abstract image representations. In Forest Baskett, editor, Computer Graphics (SIGGRAPH ’90 Proceedings), volume 24, pages 207–214, August 1990. [20] Barbara J. Meier. Painterly rendering for animation. In Holly Rushmeier, editor, SIGGRAPH 96 Conference Proceedings, Annual Conference Series, pages 477– 484. ACM SIGGRAPH, Addison Wesley, August 1996. held in New Orleans, Louisiana, 04-09 August 1996. [21] Georges Winkenbach and David H. Salesin. Rendering parametric surfaces in pen and ink. In Holly Rushmeier, editor, SIGGRAPH 96 Conference Proceedings, Annual Conference Series, pages 469–476. ACM SIGGRAPH, Addison Wesley, August 1996. held in New Orleans, Louisiana, 04-09 August 1996. [22] Georges Winkenbach and David H. Salesin. Computer–generated pen–and–ink illustration. In Andrew Glassner, editor, Proceedings of SIGGRAPH ’94 (Orlando, Florida, July 24–29, 1994), Computer Graphics Proceedings, Annual Conference Series, pages 91–100. ACM SIGGRAPH, ACM Press, July 1994. ISBN 0-89791-667-0. [23] Michael P. Salisbury, Sean E. Anderson, Ronen Barzel, and David H. Salesin. Interactive pen–and–ink illustration. In Andrew Glassner, editor, Proceedings of SIGGRAPH ’94 (Orlando, Florida, July 24–29, 1994), Computer Graphics Proceedings, Annual Conference Series, pages 101–108. ACM SIGGRAPH, ACM Press, July 1994. ISBN 0-89791-667-0. [24] Michael P. Salisbury, Michael T. Wong, John F. Hughes, and David H. Salesin. Orientable textures for image-based pen-and-ink illustration. In Turner Whitted, editor, SIGGRAPH 97 Conference Proceedings, Annual Conference Series, pages 401–406. ACM SIGGRAPH, Addison Wesley, August 1997. ISBN 089791-896-7. [25] Philip A. Thompson. Compressible-Fluid Mechanics. Advanced engineering series. Maple Press Co., 1984. [26] Rutherford Aris. Vectors, Tensors, and the Basic Equations of Fluid Mechanics. Dover Publications, Inc, New York, 1989.
[29] M.J. Lighthill. Laminar Boundary Layers. (ed. E. Rosenhead), Dover Publications, Inc, New York, 1988. [30] H. Marmanis, Y. Du, and G.E. Karniadakis. Turbulent control via geometry modifications and electromagnetic fields. ECCOMAS. 1998. [31] H. Marmanis. Analogy between the navier-stokes and maxwell’s equations: Application to turbulence. Phys. Fluids, 10(6):1428–1437, 1998.
simulated flow, Reynolds number 100
experimental flow
Figure 2: Visualization of 2D flow. Velocity, vorticity, and rate of strain (including divergence and shear) are all encoded in image layers.
Figure 5: (left) Combination of velocity, vorticity, rate of strain, turbulent charge and turbulent current for Reynolds number 100 flow. A total of nine values are simultaneously displayed. Figure 3: (right) Visualization of the turbulent charge and the turbulent current together for a Reynolds number 500 simulated flow. Observe that charge concentrates near the cylinder and is negligible in other parts the flow.
Reynolds number 100
Reynolds number 500
Figure 4: Close up visualization of the turbulent charge and the turbulent current at Reynolds number 100 and 500 (left and right). We are able to see the high concentrations of negative charge at the places where vorticity is being generated.