Visualizing Structural and Behavioural Aspects of Virtual Collaboration Robert P. Biuk-Aghai University of Macau Faculty of Science and Technology P.O. Box 3001 Macau S.A.R., China
[email protected]
Abstract Collaborative virtual environments are becoming increasingly commonplace, moving out of research labs and into professional practice. Among others, they support knowledge-intensive emergent work performed by distributed teams. In these settings where conventional awareness is absent, making sense of the virtual collaboration becomes challenging. This paper introduces information visualization that aims to reveal structural and behavioural aspects of virtual collaboration, referring respectively to relationships among elements of the collaboration, and the interactions that occur as part of it. Visualization tools have to be tailored to, and express notions from, the ontology of the virtual environment employed. An example is introduced where instances of collaboration that have taken place within the LiveNet system are visualized, in terms of LiveNet’s ontology. Finally, the paper offers an outlook on how visualization tools can be assisted by software agents that learn from, and actively support their human users. Keywords: Visualization, virtual work, collaborative virtual environments, ontology, measures, software agents, awareness.
1. Introduction Many of today’s commercial enterprises are operating in increasingly competitive and volatile environments. Coping with these intense pressures, flexibility and adaptation to change have become essential competencies required for an organization’s survival. One way in which this need is being addressed is by establishing new flexible organizational forms, integrating resources from otherwise separate organizational units, or even spanning entire organizations [1]. This creates virtual teams and virtual organizations, often only assembled for a limited period of time such as the duration of a project. A virtual team is defined as one
whose interactions cross boundaries of space, time, and organization [6]. It has been claimed that the organization of the 21st century will be made up of virtual teams and of networks of such teams [7]. These teams tend to have distributed members, and often are cross-functional, comprising members from different functional areas, such as for instance product design, engineering, marketing, etc, all working collaboratively on creating value for the organization. The work of such teams tends to be complex and non-deterministic, opportunistic in nature as well as knowledge-intensive. This kind of work may be termed emergent, meaning that detailed goals and directions of the work emerge during its execution. The work is thus improvisational in nature [9]. Because of its unplanned and non-routine nature, it is all the more difficult to keep abreast with the collaboration being undertaken. This applies both to the members of virtual teams themselves, as well as to outside stakeholders, such as management. While making sense of such kind of collaborative processes is difficult enough in traditional, i.e. face-toface settings, this is even more the case in the virtual setting where the richness of visual cues and peripheral perception of what is going on around the workplace is absent. This difficulty has been traditionally addressed by making certain forms of awareness tools available in the virtual environment [2]. These tools let team members know who else is “in” the environment, “where” they are, what they are doing, etc. This paper presents an approach that visualizes certain aspects of the collaboration, which not only provides awareness of what is “going on”, but that also allows generic rules or patterns to be discerned. The following section briefly discusses collaborative virtual environments, and section 3 investigates issues related to the visualization of collaboration. In section 4, visualization in one particular collaboration system is presented. Section 5 discusses related work, and section 6 offers an outlook on how this work can be extended with software agents. Finally, section 7 presents conclusions.
2. Collaborative virtual environments In recent years, collaborative virtual environments (CVEs) have emerged from research laboratories and have moved into professional practice. A great variety of such environments exist today, ranging from research prototypes to commercial products, from simple text-based MUDs to sophisticated three-dimensional virtual worlds, from general-purpose internet-based tools to highly specialized environments operating over dedicated gigabit networks. However, what these widely different environments have in common is the aim of somehow facilitating human-tohuman collaboration. This is achieved by supporting communication among team members, facilitating document sharing, making various task-specific tools available, providing awareness information, etc. While capabilities vary greatly between different systems, for the purposes of this discussion a CVE system should minimally support the following notions: Action: an operation that can be carried out by a user within a CVE, e.g. opening an artefact. Artefact: a document or other object which resides in, or is linked from, the CVE, e.g. a text file. Communication channel: a medium that permits users to communicate with each other, e.g. synchronous textbased chat, or an asynchronous discussion forum. CVE: the virtual environment itself within which users collaborate. User: a representation of the human user who uses the environment to collaborate with others. Based on these few notions, a generic ontology, or metaontology of the underlying concepts of a CVE system can be defined. This ontology is necessarily very simple. However, any given CVE system can then be expressed in terms of this generic ontology by providing concrete implementations of its abstract concepts. Thus, a given CVE system may for example support the two concepts of “document” and “web link” as concrete implementations of the abstract concept of “artefact”. Concepts in the ontology are related in certain defined ways, through relationships such as specialization, containment, association, etc. By defining ontologies of CVE systems that are based on a common generic ontology, it becomes possible to map concepts between different CVE systems, via the generic ontology. This is of value when applying visualization techniques to individual CVE systems, as will be discussed in the following section.
3. Visualization of collaboration While gaining an understanding of aspects of virtual collaboration is made difficult by the lack of face-to-face contact, there also exists great potential in revealing details of
the collaboration that may not be as easily discerned in face-to-face settings. This is because the use of collaborative virtual environments enables a great amount of finegrained usage data to be automatically collected. For instance, it is easy to analyze which document has been used most frequently, who were its main users, which other documents were accessed within the same session as the most frequently accessed one, etc. In a traditional environment, such data can be obtained only through effort-intensive and intrusive observation methods. Thus the virtual setting has a great advantage over the traditional one in the ease with which collaboration data can be collected. To make this data meaningful, however, it has to be processed, contextualized, analyzed and interpreted. Methods from data mining can be valuable in this process. Visualization, on the other hand, plays a complementary role in assisting the user in getting a first “feel” for the data, to later feed more focused data mining efforts. It can also be used to obtain an overview of the data landscape when full-scale mining is not required. Moreover, simple data pre-processing and transformation functions can be integrated with visualization tools to support the visualization of certain simple attributes of the data, as will be discussed later on in this section.
3.1. Structural and behavioural aspects Aspects of virtual collaboration considered here for visualization can be grouped into two main categories: on the one hand, structural, or static, aspects; and on the other hand, behavioural, or dynamic, aspects. Structural aspects refer to how the instances of concepts from the CVE’s ontology are related. Thus, a particular instance of a CVE with its contained objects and their interobject relationships would constitute a structural aspect of the collaboration. Compared to the traditional, i.e. physical, workplace, on one level this is equivalent to physical structure, i.e. how the workplace is set up in terms of offices, staff, filing cabinets with files, etc. On another level, it corresponds to organizational structure, i.e. the organization’s composition in terms of departments, groups, organizational roles, etc. For instance, a virtual team that is engaged in product innovation may set up its virtual environment to bring together people of the necessary expertise, documents and other knowledge sources, specialized tools, and both interpersonal and group communication facilities. It would relate these in suitable ways, for instance: allowing all team members read access to all documents, but only assigning the chief designer write access to the innovation proposal document; setting up discussion forums for team communication, with one forum for the entire team, and another set of forums for task-specific sub-teams; giving permission to change the setup of the environment to the team leader only;
etc. In short, the way the environment is set up to support a particular instance of collaboration constitutes structural aspects of the collaboration. Behavioural aspects, on the other hand, refer to what “happens” in these structures, in terms of the actions and interactions of people within the environment. This corresponds directly to the interactions of people in traditional, face-to-face settings. However, behaviour also includes the way the environment evolves over time, which has much less of a correspondence in non-virtual settings. In highly emergent collaborative processes, for instance, the setup of the environment may have to be changed more frequently to support newly emerging task requirements, which is reflected in how strongly the setup of the environment evolves over time. When coupled with suitable filtering mechanisms, visualization of these aspects can facilitate an organization’s knowledge management efforts. Filtering can eliminate all objects but those of interest, while visualization displays their relationships. Thus, if a particular issue is being investigated, such as the innovation process leading to a new product, the relevant information can be obtained and visualized. This can, for example, reveal details of the process how the innovation proposal was created, developed, and finalized, showing which knowledge sources and people were involved at the various stages.
3.2. Measures of aspects of collaboration Some of the structural and behavioural aspects mentioned above can be visualized directly. For instance, the fact that a person has access to a document can be visualized by two graphical objects, such as two labeled boxes, linked by a line or arrow. Other aspects are less directly visualizable and need to be represented differently. For example, the fact that some CVE structures are more complex than others can be expressed by first quantifying “complexity” through a suitable function—such as number of objects contained, or number of inter-object relationships—and then representing this complexity value in a graphical way, for instance by using different colours. A number of such measures of aspects of collaboration can be defined for a given CVE system. These measures are expressed in terms of the particular CVE system’s ontology. For the example just mentioned, the concept “complexity” would constitute an attribute of the ontology’s concept of “CVE”, and would be expressed as the sum of the number of contained instances of, say, “artefact”, “communication channel”, and “user”. Other measures can be defined in a corresponding manner. Examples of a few useful measures include: communication intensity, defined as the number of messages ex-
changed through a communication channel per unit of time; evolution intensity, defined as the number of objects added to, modified, or removed from a CVE per unit of time; CVE cluster size, defined as the number of CVEs sharing a number of objects greater than a given threshold; etc. By expressing measures themselves in terms of the concepts contained in a given CVE system’s ontology, and making them part of that ontology, it becomes possible to transfer such measures between different CVE system’s ontologies, as long as the target system’s ontology contains semantically equivalent concepts as used in the definition of the measure. Finally, by augmenting the CVE system’s ontology through such measures, they become additional attributes of the ontology. Thus the same mechanisms can be used for visualizing these measures as for visualizing the rest of the CVE system’s ontology, facilitating the creation of generic visualization tools.
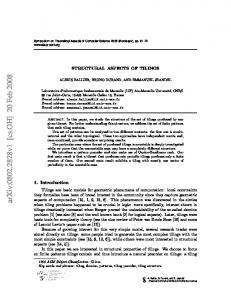
4. Visualization in LiveNet As part of this research, a tool for the visualization of aspects of collaboration was developed. This tool has been applied to the LiveNet CVE system. LiveNet is a CVE system that supports mainly asynchronous collaboration [4]. It has a web interface and employs a desktop-like structuring metaphor. LiveNet provides facilities for creating and manipulating: CVEs ( which are termed workspaces); users; roles, which are occupied by users and have certain permissions attached; artefacts, which include documents that can be uploaded into a CVE, and URLs to external resources; communication channels, of which there are two types: group discussion forums, and directed peer-to-peer message channels for the passing of semi-structured messages; tools (which are termed actions); folders, which group artefacts, communication channels, and tools together; and several other items. A simplified ontology diagram of LiveNet is shown in Figure 1. The LiveNet Visualizer tool allows the structures created within LiveNet to be visualized. It also integrates visualization of a number of measures, as mentioned earlier. Visualization focuses on two levels: on the one hand, the network of workspaces, referred to as inter-workspace maps; on the other hand, the internals of a given workspace, referred to as intra-workspace maps. To illustrate this, consider the workspace maps shown in Figure 2. The large background map is an inter-workspace map, showing the network of workspaces and several inter-workspace relationships. The map shows five workspaces which have several objects in common: a number of shared documents, and several users. This hints at the fact that these five workspaces belong to a cluster of task-related workspaces. Overlaid on top of the inter-workspace map, there are four
Message
type−of Message type
sent−by
Workgroup
has
part−of
contains
Discussion
has involves
has
Message rule
has
Folder contains
Workspace has
involves has
contains
Document
parent−of
involves performs
Action
Role occupies Participant
is−a
User
Figure 1. Simplified ontology of the LiveNet CVE system
smaller intra-workspace maps showing the internal organization of the four workspaces appearing in the lower part of the inter-workspace map. These maps can reveal the topology of structural aspects of the collaboration spaces. For instance, in the maps shown the topology is that of a web, with every role having access to every document and discussion forum. This suggests an egalitarian group organization. In other cases, different topologies may be found, for example with sub-groups that have unequal access to the workspace’s resources, suggesting a more hierarchical group organization. Thus aspects of the group’s working style can be perceived from structural aspects of their collaboration environment. Inter-workspace maps are visualized using an extension of the well-known animated spring algorithm, similar to the one presented in [5]. The algorithm has been modified to selectively turn the spring force applied to edges in the graph on or off, depending on edge type. Different kinds of inter-workspace relationships are represented as different edge types. This makes it possible to search for clusters of workspaces based on relationship types. An example of this is shown in the inter-workspace map in Figure 3, where the relationship type whose spring force has been turned on is “Shared Goal” (Goal is one of the attributes of a LiveNet workspace), shown by the red edges. Once the map reaches equilibrium, such as in Figure 3, clusters of related workspaces are revealed: one large cluster of 13 workspaces, two medium-sized clusters of 5 and 4 workspaces, and one small cluster of 2 workspaces. Identification of such clusters makes it possible to see “who works with whom”, and “what tasks are related to each other”. Visualization of measures of structural and behavioural aspects, discussed earlier, is supported in the LiveNet visualizer using differently-coloured nodes. An example of this
is shown in Figure 4. This inter-workspace map visualizes workspace density (a measure of the workspace’s complexity) as a colour on a spectrum from green to red. It shows a number of workspaces having a very high density, suggesting that the tasks supported by those workspace have a higher complexity than others. Other measures can be visualized in a similar manner, including evolution intensity, communication intensity, and others. Finally, to facilitate visualization of large, complex workspace networks, the visualization tool allows the user to focus on workspaces (i.e. to show only the focused-on workspace and its immediate neighbours), as in the interworkspace map in Figure 2 (the focused-on workspace is shown with bracketed corners). The user can then navigate to other workspaces one step at a time by focusing successively on other workspaces in the map, and thereby avoid “getting lost” in a huge map of all workspaces.
5. Related work Visualization of aspects of virtual collaboration has received relatively little research attention in the past, and there does not appear to be any other work on visualizing aspects of collaboration in collaborative virtual environments. Harrison and Coplien’s group has visualized collaboration in software organizations [3]. However, unlike the research discussed in this paper, the collaboration studied was face-to-face, and data was manually collected and input into the computer for subsequent analysis. Smith’s work has been focused on visualizing the social structure of Usenet discussion groups [10]. The visualization makes use of graphs in which nodes represent Usenet newsgroups, and colour is used to represent various measures. The visualization resembles the one discussed here, however it is explicitly limited to Usenet discussions only.
6. Outlook The visualization presented here is currently driven by human users, however there exists the possibility for a greater degree of automation and a more active support of the user. Software agents, if coupled with both the collaborative virtual environment and the visualization tools, can learn visualization rules by observing the human user, akin to the learning interface agents described in [8]. Such agents work by “looking over the shoulder” of their human users, then generating rules that describe the user’s behaviour. This enables them to autonomously carry out learned actions. For instance, a learning interface agent could find out what type of information a user is usually interested in, then bring this information to the foreground automatically without requiring user intervention. It could
Figure 2. Inter-workspace map of workspaces related to a manuscript preparation process, with intra-workspace maps for selected workspaces
also continually scan the CVE for instances of that information and alert the user when it becomes available. This convergence of visualization, data analysis, and software agents promises a greater facilitation of the process of inspecting aspects of collaboration, which can be of particular value in large, complex networks of collaboration environments.
7. Conclusions Organizations are increasingly using collaborative virtual environments to facilitate the work of distributed virtual teams. This paper has presented visualization approaches that aim to support users in gaining a greater understanding of both structural and behavioural aspects of virtual collaboration. This can lead to increased awareness of the activities of the virtual team, both for its members as well as for outside stakeholders such as management. By basing the visualization on the ontology of a given CVE system, additional concepts such as measures of collaboration can be visualized. Such measures also become transferable between CVE systems. Finally, learning software agents have the potential to learn from the user and then more actively support the user in visualizing collaboration.
Acknowledgments This research was carried out at the Faculty of Information Technology, University of Technology, Sydney. The support from the University of Technology, Sydney, as well as the University of Macau, through which this research was made possible, is gratefully acknowledged.
References [1] J. Donlon. The virtual organization. Chief Executive, 125:58–66, July 1997. [2] P. Dourish and V. Bellotti. Awareness and coordination in shared workspaces. In Proceedings ACM Conference on Computer-Supported Cooperative Work, Toronto, Canada, Nov. 1992. [3] N. B. Harrison and J. O. Coplien. Patterns of productive software organizations. Bell Labs Technical Journal, 1(1):138– 145, Summer 1996. [4] I. T. Hawryszkiewycz. Workspace networks for knowledge sharing. In R. Debrency and A. Ellis, editors, Proceedings of AusWeb99, the Fifth Australian World Wide Web Conference, pages 219–227, Ballina, Australia, Apr. 18–20, 1999. [5] M. L. Huang, P. Eades, and J. Wang. On-line animated visualization of huge graphs using a modified spring algorithm. Journal of Visual Languages and Computing, 9(6):623–645, 1998. [6] J. Lipnack and J. Stamps. Virtual Teams: Reaching Across Space, Time, and Organizations with Technology. Wiley, New York, 1997. [7] J. Lipnack and J. Stamps. Virtual teams. Executive Excellence, 16(5):14–15, May 1999. [8] D. Maulsby and I. H. Witten. Teaching agents to learn: From user study to implementation. IEEE Computer, 30(11):36– 44, Nov. 1997. [9] C. Moorman and A. S. Miner. Organizational improvisation and organizational memory. Academy of Management Review, 23(4):698–723, Oct. 1998. [10] M. A. Smith. Invisible crowds in cyberspace: Measuring and mapping the social structure of USENET. In M. Smith and P. Kollock, editors, Communities in Cyberspace. Routledge Press, London, UK, 1999.
Figure 3. Inter-workspace map, showing parent-child and goal relationships. workspaces with common goals are revealed
Four clusters of
Figure 4. Inter-workspace map with node colouring indicating workspace density