Adam Prügel-Bennett. School of Electronics and ...... [11] Jeff Reneker and Chi-Ren Shyu, âRefined Repetitive Sequence Searches. Utilizing a Fast Hash ...
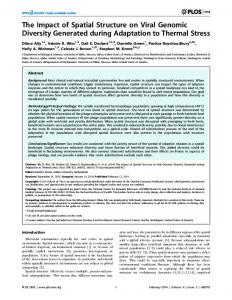
Visualizing the Repeat Structure of Genomic Sequences Nava E. Whiteford�, Niall J. Haslam�, Gerald Weber�
School of Chemistry, University of Southampton, SO17 1BJ, Southampton, UK Adam Prügel-Bennett
School of Electronics and Computer Science, University of Southampton, SO17 1BJ, Southampton, UK Jonathan W. Essex
School of Chemistry, University of Southampton, SO17 1BJ, Southampton, UK Cameron Neylon
School of Chemistry, University of Southampton, SO17 1BJ, Southampton, UK and ISIS Pulsed Neutron and Muon Source, Rutherford Appleton Laboratory, Chilton, Didcot OX11 0QX, UK Repeats are a common feature of genomic sequences and much remains to be understood of their origin and structure. The identification of repeated strings in genomic sequences is therefore of importance for a variety of applications in biology. In this paper a new method for finding all repeats and visualizing them in a two-dimensional plot is presented. The method is first applied to a set of constructed sequences in order to develop a comparative framework. Several complete genomes are then analyzed, including the whole human genome. The technique reveals the complex repeat structure of genomic sequences. In particular, interesting differences in the repeat character of the coding and noncoding regions of bacterial genomes are noted. The method allows fast identification of all repeats and easy intergenome comparison. In doing this the plot effectively creates a signature of a sequence which allows some classes of repeats present in a sequence to be identified by simple visual inspection. To our knowledge this is the first time all exact repeats have been visualized in a single plot that highlights the degree to which repeats occur within a genomic sequence, giving an indication of the important role repeats play. From this it is clear that large scale repeat analysis remains an important and unsolved problem in bioinformatics. � Present address: Wellcome Trust Sanger Institute, Hinxton, Cambridge, CB10 1SA, UK. � Present address: EMBL Heidelberg, Meyerhofstraße 1, 69117 Heidelberg, Germany. � Present address: Department of Physics, University of Ouro Preto, 35.400-000 Ouro Preto-MG, Brazil.
Complex Systems, 17 (2008) 381–398; � 2008 Complex Systems Publications, Inc.
382
N. Whiteford et al.
1. Introduction
The repetition of both large and small sequences is a common feature of both eukaryotic and prokaryotic genomes [1–3], with some authors suggesting that as much as 50% of the human genome is composed of repetitions [4]. The biological role of repeated sequences has been investigated by a number of authors, where they have been linked to evolutionary mechanisms in prokaryotic organisms [5]. In the case of triplet repeats they have been linked to thermodynamic stability and the effect of this in genetic expansion diseases [6]. Tsuge et al. also recently reported on an association between three tandem repeats in the regulatory region of SMYD3 and human carcinogenesis [7], and detailed analysis of single sequence repeats in humans has been carried out by Subramanian et al. [8]. Several methods have been developed for analyzing the repeat structure of genomic sequences [9–12]. Most methods scan for a specific type of repeat such as short sequence repeats [1], palindromic repeats [13], tandem repeats [14–17], or highly periodic short repeat elements [18, 19]. Usually, such methods are unable to detect repeats that do not match a predefined pattern and intra- or inter-genomic analyses are usually very difficult. Some methods, such as the use of Fourier transforms for repeat identification [18], do not search for a specific repeat pattern but rather try to locate occurrences of highly correlated periodic repeats. However, this approach typically only identifies very strong genome-wide correlations such as those due to the triplet nature of the genetic code. The problems of identification combined with the size of large genomes makes identifying the full range of repeated sequences in genomes a challenging computational problem. Computationally the use of suffix structures for genomic sequence analysis, which include suffix tree [2, 20, 21] and suffix array methods [22, 23], has greatly increased the efficiency of searching and storing strings. The analysis described here makes use of the suffix array [24], and the associated longest common prefix (LCP) [25] array that require significantly less memory than suffix trees [26] but which can still be constructed in linear time [27–29]. One of the major difficulties in comprehensive repeat analysis lies in the visualization of repeated structures. Additionally, repeat visualization, as it relates to word frequency, may also be of interest in the linguistic analysis of genomic sequences [30] and, as shown later, parallels between human language and genomic repeat visualization can be drawn. Genomes are typically too large to be efficiently visualized as a string of symbols or to be represented as a line. When the additional problem of identifying and categorizing repeats that differ widely in length, position, and spatial relationship is added the problem becomes increasingly challenging. Complex Systems, 17 (2008) 381–398
Visualizing the Repeat Structure of Genomic Sequences
383
Some attempts at sequence visualization have been made such as the visualization of tandem repeats using color-coding [14], the side-byside comparison of simple repeats [20], and visual linking of maximal repeats between two strands [2]. Of these, GenAlyzer [31] and its predecessor Reputer [2] are the only tools that visualize all maximal repeats within a sequence. The GenAlyzer visualization consists of two horizontal lines, both of which may represent the same sequence, repeats are shown as lines connecting the positions of repeat on the two sequences. This provides a natural way of viewing all maximal repeats and their distribution. However, the visualization has the potential to become saturated for long, or highly repetitive sequences (see [2] Figure 7). This paper presents an efficient algorithm for collecting all exact repeats within a genome. This data is presented as a color plot which, through visual inspection, exposes some of the many complex repeat types in these sequences. This is the first time all repeats have been visualized in a single plot. The work highlights the extent to which repeats occur within genomic sequences and gives some indication of the important role repeats play. From this it is clear that large scale repeat analysis remains an important, and largely open, problem. 2. Results
In order to create the visualization we consider all possible substrings of length k in a sequence. The number of repetitions r of each substring is counted (i.e., for substrings that occur once r � 0, for substrings that occur twice r � 1, etc.). The repeat score function C(k, r) is the number of substrings that repeat r-times, for a given substring length k. For example, if there are 30 different sequences of 20 nucleotides that each occur 15 times in a specific genome then C(20, 15) � 30. Figure 1(a) shows an example of the repeat score function C(k, r) for several values of r calculated for the whole human genome (build 35.1 [4]). The repeat score function for r � 0; that is, no repeats, shows the amount of unique sequences within the genome as a function of substring length k and was previously used in the analysis of sequence reassembly [32]. For r > 0 the repeat score falls by several orders of magnitude as shown in Figure 1(a) and is the main reason for employing a log scale. Similarities in repeat score function C(k, r) can be seen for specific repeat values r. For instance, for values of k between 250 and 400 the repeat score function of the human genome produces similar values for C(k, r) where r is equal to 50 or 100. However, outside this range there are strong differences. It is therefore interesting to plot the repeat score continuously as a function of r. Such a repeat score plot is shown in Figure 1(b). The plot shows the repeat score function C(k, r) as a Complex Systems, 17 (2008) 381–398
N. Whiteford et al.
384
6
400
5
8
10
750
7
10
106 5
105
10
104 103 102 101
4 300
Repetitions r
Number of sequences C(k,r)
7
1000 0
109
50
3
log10 c(k,r)
1010
2 500
1
200 200
300
400
0
250
100 500 250 500 750 Sub-string length k (nt)
(a)
1000
0 1
250 500 750 Substring length k (nt)
1000
(b)
Figure 1. Repeat score function C(k, r) for the whole human genome (build
35.1 [4]) (a) as a function of substring length k and selected values of r and (b) a logarithmic color plot of the repeat score function C(k, r), where the x and y axes indicate the substring length k and number of repeats r, respectively. The color of the point at position (k, r) indicates the number of differently composed substrings that repeat r times. The inset highlights an example of the complex structure present in this plot.
function of both the substring length k and the number of repeats r, for the whole human genome, where color represents log10 C(k, r). It is clear from Figure 1(b) that representing the repeat score function C(k, r) in this way allows the rapid visualization of the complex repeat structure of a sequence. This can be seen more clearly for the human genome when specific features of the plot are expanded, as in Figure 1(b). Figure 1 also illustrates the capability of the underlying algorithm to analyze large genomes. Since we consider both strands of DNA this analysis was performed on a string of 6.2 billion bases. Clearly, algorithms with (close to) linear time complexity are necessary for studying such genomes. To further understand and identify the structure present in this visualization a series of artificial sequences were constructed which provide some basis for the interpretation of the repeat score plots. Figure 2(a) shows the repeat score plot for an artificially generated sequence containing three types of very simple periodic repeat: a sequence composed only of a mononucleotide A, a triplet repeat ATG, and a quadruplet repeat ATGC each repeated 20 times. Such simple repeats always appear as straight lines in the repeat score plot. However, the slope of this line depends both on the size of the repeated section, and on how many times they are continuously repeated. Therefore its interpretation from the visualization alone is not trivial. However the sequence data from which a feature is composed may be extracted for further investigation. Complex Systems, 17 (2008) 381–398
Visualizing the Repeat Structure of Genomic Sequences
385
50 Synthetic repeats
Bacillus anthracis str. plasmid pXO1
Repetitions r
40
30 iii
20 ii i 10
i
0
(a)
(b)
50
7 Bdellovibrio bacteriovorus HD100
S. meliloti 1021 plasmid pSymA 5 4
Repetitions r
3 30
log10 C(k,r)
6 40
2 1
20
0
ii
10
iii
0 1
10
20 30 Substring length k (nt)
(c)
40
50
1
10
20 30 Substring length k (nt)
40
50
(d)
Figure 2. Logarithmic color plot of the repeat score function C(k, r) for (a) A
constructed sequence composed of (i) A repeated 20 times, (ii) the triple ATG repeated 20 times, and (iii) the quadruple ATGC repeated 20 times. (b) Bacillus anthracis, size 95 kb [GenBank:NC_007323]. (c) Bdellovibrio bacteriovorus HD100, size 3.8 Mb [GenBank:NC_005363]. (d) Sinorhizobium meliloti 1021 plasmid pSymB, size 1.7 Mb [GenBank:NC_003037]. Parts (b), (c), and (d) contain identified simple repeat structures marked as (i), (ii), and (iii) as in part (a).
Randomly generated sequences contain few repeats, and the repeat score plot of such sequences, as shown in Figure 3(a), typically presents strong clustering around small substring lengths k and repetitions r. The repeat score decreases rapidly for moderately long substrings. For the sequence shown in Figure 3(a) (length 4.7 Mb) the base composition was biased as in [33]. When random sequences of increasing length are analyzed the plot retains the same general shape, while the ridges shift to larger lengths and greater numbers of repetitions. The random sequence therefore provides an important baseline for comparison with other sequences and represents an absence of repeat structure. However, Complex Systems, 17 (2008) 381–398
N. Whiteford et al.
386
50
300
7
Random
Fibonacci 5 4 3
Repetitions r
Repetitions r
200 30
20
log10 C(k,r)
6 40
2 1 0 100
10
0
0 1
10
20 30 Substring length k (nt)
40
50
(a)
1
100 200 Substring length k (nt)
300
(b)
Figure 3. Logarithmic color plot of the repeat score function C(k, r) for (a) a
random genomic sequence of size 4.7 Mb and (b) a Fibonacci sequence a15 , with a1 � AT and b1 � GC, generated from equation (1).
absence of repeat structure should not be confused with absence of functional structures containing information such as those that code for proteins. While the prokaryotic and eukaryotic genomes analyzed showed strong deviation from the randomly generated sequences (see below), the analysis of small viral genomes yields a repeat score plot similar to that of a random sequence of the same size (data available from the authors’ website http://4g.soton.ac.uk). This is consistent with a lack of redundancy in the genomes of these highly efficient organisms. Another interesting example, which highlights the potential of the repeat score plot, are quasi-periodic structures, that is, sequences with a high degree of structure and periodicity but yet not completely periodic [34]. A well-known example is the Fibonacci sequence, created by taking two seed sequences, in this case: a1 � AT and b1 � GC, and applying the inflation rule ai�1 � ai � bi ,
bi�1 � ai .
(1)
For instance, a sequence a5 would be a5 � ATGCATATGCATGCAT. In Figure 3(b) the repeat score for a Fibonacci sequence a15 (3195 nt) is shown. Although the Fibonacci sequence has a high degree of repetition its repeat score function shows a distinctive difference from the sloped lines of simple repeats shown in Figure 2(a). Instead horizontal lines are observed which become broader and more closely spaced for lower repetitions r. These features are characteristic of all the Fibonacci sequences we have analyzed, regardless of size or seed sequences used (data not shown). This indicates that the repeat score plot allows the visualization Complex Systems, 17 (2008) 381–398
Visualizing the Repeat Structure of Genomic Sequences
387
of repeats based upon the repeat structure, not the size or base composition of this particular sequence. Such structures might be expected to be generated by serial duplication of a specific region. In a visual inspection of over 900 real sequences we were unable to find any displaying this characteristic pattern. To date, no Fibonacci sequences have been found. Our study suggests that if they do occur they are quite rare. As a general rule, highly repetitive structures appear in the repeat score plot at large substring lengths k and many repetitions r, while nonrepeated structures show as intense clusters for small values of k and r. The logarithmic plot employed in our analysis ensures that only significant repeats are highlighted, although there is no restriction in using a linear scale when less frequent repeats are to be detected. 2.1 Visualization of genomic sequences
From our analysis of artificial sequences it becomes clear that the repeat score function visualized as a function of substring length and number of repetitions provides a visual “signature” which is helpful in identifying repeated elements in genomic sequences. Figures 2(b), 2(c), and 2(d) show examples of simple repeat structures found in real genome sequences. These were identified by visual comparison with artificially generated repeat score plots, such as those shown in Figure 2(a). Subsequently, the sequence data related to these repeat elements were extracted and confirmed to be of a similar type to the synthetic repeats. That is to say, the structure labeled i in Figures 2(a) and 2(b) was a mononucleotide repeat composed of the nucleotide A. The structure labeled ii was in both cases a triplet repeat (ATG in the artificial sequence and GAA in Figure 2(b)), and structure iii was composed of a quadruplet repeat (ATGC in the artificial sequence and AGAG, in Figure 2(d), showing that two and four nucleotide repeat elements will exhibit a similar structure). Note that the repeats were identified independently of the size of the genome, which in our examples ranged from 95 kb (Figure 2(a)) to 3.8 Mb (Figure 2(b)). Apart from detecting specific repeat patterns, the repeat score can also be used for comparative analysis between different regions of a genome. For instance, the coding and noncoding sections of a genome can be visualized separately and then compared, even if the two sections are very different in size. In Figure 4(a) the repeat score plot of the coding section of the wellannotated E. coli K12 genome [GenBank:NC_000913] is shown. First a strong clustering around substring length k � 10 nt and repetitions r � 10 is noted, similar to the random sequence (see Figure 3(a)), and then the broad horizontal lines, at low values of r, which indicate large exact repeats. These are sequences that occur up to four times and are largely made up of ancient proteins involved in protein translation, Complex Systems, 17 (2008) 381–398
N. Whiteford et al.
388
50 E.Coli K12 Coding
E.Coli K12 Non-coding
Repetitions r
40
30
20
10
0
(a)
(b)
50
7 E.Coli O157:H7 Coding
E.Coli O157:H7 Non-coding 5 4
Repetitions r
3 30
log10 C(k,r)
6 40
2 1
20
0
10
0 1
10
20 30 Substring length k (nt)
40
(c)
50
1
10
20 30 Substring length k (nt)
40
50
(d)
Figure 4. Logarithmic color plot of the repeat score function C(k, r) for (a) the
coding and (b) noncoding portion of nonpathogenic E. coli K12, size 4.6 Mb [GenBank:NC_000913], and (c) the coding and (d) noncoding portion of the pathogenic E. coli O157:H7, size 5.5 Mb [GenBank:NC_002695].
tRNA metabolism, and proteins involved in transposition or related to prophages. Another identified feature is the peak at r � 6 repetitions which arises from the seven copies of genes coding for components of the ribosome [35]. The repeat score plot of the noncoding part is very different, with a highly repetitive cloud-like pattern clearly visible in Figure 4(b). The fact that the noncoding sequence accounts for only 15% of the genome was of no importance for the detection of these patterns, which are also clearly visible in the analysis of the complete genome (data not shown). Many of these repeats are intergenic repetitive sequences such as intergenic repeat elements (IRUs) and enterobacterial repetitive intergenic consensus sequences (ERICs) [13]. ERICs are related to the REP family of repeats for which multiple functions have been proposed including transcription termination, mRNA stability, and chromosomal domain organization in vivo [36]. The exclusive presence of highly Complex Systems, 17 (2008) 381–398
Visualizing the Repeat Structure of Genomic Sequences
389
repeated short sequences within noncoding DNA appears to be a characteristic of a large number of the sequences we have analyzed (data available from the authors’ website http://4g.soton.ac.uk). Since size poses no significant constraint for the repeat score plot the comparison of different genomes can easily be performed. Figures 4(c) and 4(d) show the coding and noncoding regions, respectively, of a pathogenic strain of E. coli [GenBank:NC_002695]. Comparing this to the nonpathogenic E. coli of Figures 4(a) and 4(b) is straightforward, despite a difference in size of almost 1 Mb. While the coding and noncoding regions of these two genomes are largely similar, the striking diagonal feature in Figure 4(c) exists only in the coding region of the pathogenic strain. The sequences composing this feature were identified as part of a pathogenicity island [37], structures found within the genomes of microbes and pathogens that are associated with pathogenicity. These regions are often flanked by direct repeats, generated by the integration of the pathogenicity island into the host genome via recombination [38]. Similar features in the genomes of many pathogenic organisms such as Mycoplasma pneumoniae M129 [Genbank:NC_000912.1] and Haemophilus influenzae Rd KW20 [Genbank:NC_000907.1] were observed. Repeat score plots for these and more than 500 other sequences can be accessed from http://4g.soton.ac.uk. 3. Discussion
A visualization technique that can rapidly identify all repeated sequences of any length in genomes up to and including the 6.1 billion bases (including the forward and reverse strand) of the full human genome has been developed. The plots expose the complex repeat structure that exists in genomic sequences. They provide a visualization that is largely independent of genome size and can identify repeated sequences independently of their position and spatial relationship. Unlike many techniques for locating repeats, the repeat score plot can be used to locate repeats of all sizes, and those of unknown type and structure. The plots provide a signature of the repeat structure of a sequence as well as a straightforward means for comparison within and between sequences. While the visualization is largely independent of genome size, normalizing the visualization with respect to genome size would be a useful extension of this work. One possible solution to this problem would be to plot the degree to which repeats deviate from a random distribution. Constructing an effective random model, however, is a nontrivial problem which we hope to investigate in the future. Using this technique significant differences between the repeat structure of the coding and noncoding regions of prokaryotic and eukaryotic genomes have been identified, as have striking features associated with pathogenicity in bacterial genomes. Complex Systems, 17 (2008) 381–398
N. Whiteford et al.
390
7
50 Stage Directions
6 5
40
Repetitions r
4 3 30
log10 C(k,r)
Dialogue
2 1 0
20
10
0
0
10 20 30 Substring length k (nt)
(a)
40
0
10 20 30 Substring length k (nt)
40
(b)
Figure 5. Logarithmic contour plot of the repeat score function C(k, r) for the
(a) dialogue and (b) stage directions of the plays of Shakespeare [39]. The dialogue not only constitutes the largest part of the text; it is also the most creative part, for which a relatively low level of repetition would be expected. On the other hand, stage directions are highly repetitive. “Act 1 Scene 1” appears in every one of the 37 plays. The figure illustrates this distinction. An analogy can be drawn between the dialogue and the coding information in the genome sequences and the stage directions and noncoding DNA. Indeed if there were many more plays by Shakespeare (i.e., “Act 1 Scene 1” occurred 100 or 200 times rather than 37) then the similarity between repeat frequency in the noncoding DNA and the stage directions would be even stronger.
The most important contribution of this work is to describe the extent to which repetitions of functional importance occur in genomic sequences. We have shown that these are not merely simple repeats but in many cases have a complex structure which warrants further investigation. The technique may also prove useful as an analysis in its own right. It may, for example, be useful in annotation problems, such as the analysis of newly sequenced genomes. Where structure is unknown, repeated elements can be quickly and easily identified using this technique. The use of these visualizations is obviously not limited to genetic sequences but can be applied to any string. Therefore it will have application to the analysis of language-like features within genomic sequences [30] as well as potential applications in the analysis of language and data compression. An example of its application to written language which shows parallels with genomic analysis is shown in Figure 5. The plot has potential as an analytical tool and the development of normalized plots and objective comparison is clearly the most important next step. However, a particular strength is its ability to rapidly present a visual representation of the repeat structure of a very large string. Complex Systems, 17 (2008) 381–398
Visualizing the Repeat Structure of Genomic Sequences
391
The importance of fully utilizing the power of the human visual system to recognize patterns has been discussed [40] and this representation approach provides a novel method of exploiting this. Appendix A. Algorithm
An all against all comparison approach to constructing the repeat score plot would require O(kn2 ) comparisons. Here an optimal algorithm is described. Consider a string S[0 � n] with elements indexed from 0 to n where the last element is marked with a special end marker S[n] � $ which does not occur at any other position. The suffix array [24] sa[0 � n] of all suffixes and the array lcp[1 � n] giving the length of the longest common prefix (LCP) between sa[k] and sa[k � 1] can efficiently be computed in linear time [27–29]. An example string, “banana$”, shall be used to illustrate the operation of the algorithm. This has suffixes banana$, anana$, . . . , a$, $. The suffix array and LCP array for this example are given in Table 1. A relation between suffixes Rk (s1, s2) is defined which is true if s1 and s2 share the same prefix of length k. The equivalence relation Rk (s1, s2) defines a partitioning of the suffixes into equivalence classes. Equivalence classes can be labeled by [prefix] where prefix is the prefix which all strings share. For our example the equivalence classes are shown in Table 2. When the suffix is shorter than k an arbitrary symbol “.” is added. The equivalence classes are denoted by i
�0, 1, . . . , n � 1 /Rk � ��k i � 1, nk
(A.1)
where nk is the number of equivalent classes for substrings of size k and in our example �11 � [a] � �anana$, ana$, a$ �21 � [b] � �banana$ �31 � [n] � �nana$, na$ �41 � [$] � �$ �12 � [an] � �anana$, ana$, a$ �22 � [a$] � �a$ �32 � [ba] � �banana$ �42 � [na] � �nana$, na$ �52 � [$.] � �$ . Complex Systems, 17 (2008) 381–398
N. Whiteford et al.
392
Index
Position
0
1
Suffix anana$
LCP
1
3
ana$
3
2
5
a$
1
3
0
banana$
0
4
2
nana$
0
5
4
na$
2
6
6
$
0
Table 1. Suffix and LCP array of the string banana$.
k�1
k�2
k�3
k�4
[a]
[an]
[ana]
[anan]
3
[a]
[an]
[ana]
[ana$]
1
[a]
[a$]
[a$.]
[a$..]
banana$
0
[b]
[ba]
[ban]
[bana]
nana$
0
[n]
[na]
[nan]
[nana]
5
na$
2
[n]
[na]
[na$]
[na$.]
6
$
0
[$]
[$.]
[$..]
[$...]
Index
Suffix
LCP
0
anana$
1
ana$
2
a$
3 4
Table 2. Equivalence classes for substrings of banana$.
The number of substrings of length k that repeats r times is equal to nk
i
C(k, r) � � � �k � r�
(A.2)
i�1
where �predicate� is equal to one if predicate is true and equal to zero otherwise. Let vmax be the largest value in the LCP array. It is noticed that for k > vmax all members’ suffixes are unique (by the definition of vmax ). Therefore for k > vmax , C(k, 0) � n � 1 � k and C(k, r) � 0 for r > 0. The 1 equivalence classes �k can now be computed iteratively starting from k � vmax and decrementing until k � 1 is reached. This is performed efficiently by sorting the LCP array into a list of sets indexed by the value of the LCP array, where the elements in the set are the indexes of the LCP array. That is, i � �[v] if lcp[i] � v. In our example, �[0] � �3, 4, 6, 7 �[1] � �2 �[2] � �5 �[3] � �1 . Complex Systems, 17 (2008) 381–398
Visualizing the Repeat Structure of Genomic Sequences
393
The algorithm uses a disjoint set data structure [41] to efficiently compute union operations. The disjoint set data structure is augmented with an auxiliary array which maintains the sizes of sets. C[vmax � 1, 0] is first initialized to be lcp , this can be seen to be so because for substrings greater than vmax all substrings are unique (by definition of vmax ). � is iterated over from v � vmax to v � 1. For each value of v, the sizes of all sets in �[w] where w v are obtained, and stored in C such that C[v][x] contains the number of sets of size x � 1 (1 is added to maintain our original definition of C(k, 0)). To do this C[v] is initialized with C[v � 1]. Union operations are then performed on �, first subtracting sizes of the sets to be unioned, then adding the size of the final unioned set. The algorithm can be summarized in the following pseudo code. Array of sets �[1 � vmax ] Extended lcp array lcp[0 � n] Output: Count of repeats C[1 � n, 0 � n]
Input:
Initialize DisjSets; C[vmax � 1, 0] lcp
for v vmax to 1 C[v, 0..n] C[v � 1, 0..n] forall i � �[v] j DisjSets.find(i) k DisjSets.find(i � 1) C[v, j � 1] C[v, j � 1] � 1 C[v, k � 1] C[v, k � 1] � 1 l DisjSets.union(j,k) C[v, l � 1] C[v, l � 1] � 1 endfor endfor
The algorithm can be modified to compensate for the unique end marker and substrings overlapping the end of the sequence simply by subtracting k: C� (k, 0) � C(k, 0) � k. Sequence breaks may be compensated for similarly. It is clear that the algorithm operates in linear time, a single operation for every entry in the array �. The complexity of a given implementation will therefore depend on the information you wish to extract, which in the case of the repeat score plot, will be its area. B. Example implementation
In this section an example C++ implementation of the algorithm is provided. When combined with a suffix and LCP construction algorithm, this forms a complete implementation of the algorithm described. The Complex Systems, 17 (2008) 381–398
N. Whiteford et al.
394
function repeatscore takes the LCP array of a string as its input and returns a newly constructed two-dimensional vector containing the repeatscore matrix of the input sequence indexed by substring length and number of repeats. A complete implementation is available on request from the corresponding author. #include #include using namespace std; typedef vector vec2d; class DisjSets { public: vector s, s_sizes; DisjSets(int l) : s(l,-1), s_sizes(l,1) {} int find(int x) { if(s[x] < 0) return x; return s[x] = find(s[x]); } int unionsets(int r1,int r2) { if(s[r2] < s[r1]) {int sw=r1; r1=r2; r2=sw;} if(s[r1]==s[r2]) s[r2]--; s_sizes[r1]=s_sizes[r1]+s_sizes[r2]; return s[r2]=r1; } int set_size(int x) {return s_sizes[x];} }; int repeatscore(vector &lcp,vec2d **C_ptr) { int n=lcp.size(); DisjSets p(n); int v_max=0; for(int i=0;i v_max) v_max=lcp[i]; vec2d height(v_max+1,vector(0)); for(int i=1;i0;k--) { for(int cp=0;cp