Visualizing uncertainty in habitat suitability models
Recommend Documents
Jul 27, 2015 - Physical hydraulic models, such as the Physical Habitat Simulation .... on the relationship between fish abundance and mesohabitat spatial ...
Habitat models are designed for a wide variety of planning applica- tions where
habitat ... and a list of the model variables with recommended measurement
techniques for .... most of Iowa, Illinois, Indiana, Ohio, and Missouri, as well as
parts of
HABITAT SUITABILITY INDEX MODELS: OSPREY by. Sandra L. Vana-Miller.
Department of Fishery and Wildlife Biology. Colorado State University. Fort
Collins ...
Cross-validation: The presence points are partitioned into 10 parts. The HS model is calibrated with nine of them and evaluated on the last one. This is repeated ...
Nov 8, 2016 - environment due to limited offshore access and wide- ranging movements of some species. Flatback .... tions and has seen rapid industrial development related to the ...... org/web/packages/raster/index.html. Hirzel, A. H., J.
S1 Appendix: Habitat Suitability Model for Jaguar in the. Upper Paraná River Corridor. The habitat map provides the basis for the spatial structure of the jaguar.
"Implications of Fine-grained Habitat Fragmentation and Road Mortality for Jaguar Conservation in the Atlantic Forest, Brazil" by Laury Cullen Jr., Jessica C.
Sep 3, 2009 - Results. The majority of the suitable habitat for the Swift fox is located in eastern Colorado and New Mexico. The most suitable habitat was ...
Mar 5, 2014 - Biomass patterns in seagrass meadows of the. Laguna Madre, Texas. Bull. Mar. ... Weeks, D., P. Malone, and L. Welling. 2011. Climate change.
Aug 14, 2015 - svolte nell'ambito della legge 41/82. Biol. Mar. ... Dunn, D. & Halpin, P. Rugosity-based regional modeling of hard-bottom Habitat. Mar. Ecol.
We show how the availability of biological databases and software enabling fast and accurate population projections ...... Free access on: http://individual ecology.bourne mouth.ac.uk/ software.html ...... Hughes, G. O., O'Halloran, L. R., Seo, C., T
Ferrier 2000; Guisan and Zimmermann 2000; Store and. Kangas Store and Kangas 2001; Breiman 2001; Yamada et al. 2003). Expert opinion has been used ...
1954), and Acacia meadows in Texas (Quillin 1935). Studies by .... associated with three species of sagebrush (Artemisia tridentata, A. cana, and. 6. frigida).
sites in most of the great blue heron's range (Vermeer 1969; English 1978; ...... Dept. Nat. Resour. Tech. Bull. 126. Madison. 13 pp. Meyerriecks, A. J. 1960.
Stanley H. Anderson and Wayne Hubert instigated this project. We acknowledge ... Baldwin (1970) calculated an index of utilization by dividing the proportion of ...
The habitat use information and Habitat Suitability Index (HSI) models presented
... models, which are scaled to produce an index between 0 (unsuitable habitat).
Dec 11, 2014 - 1Department of Agricultural and Biological Engineering, University of Florida, Gainesville, Fl, USA ... Ranking of input parameter sensitivities also varied spatially for both spe- cies, with .... loosahatchee River estuarine system of
Habitat Evaluation Procedures Group or. Instream Flow Group .... southern Quebec, New Brunswick, Prince Edward Island and Nova. Scotia south, at 1east ...
Feb 13, 2015 - istics for lobster species (Homarus gammarus) which suggests that these environmental factors are amongst the most important explanatory ...
Top left, timber rattlesnake, courtesy of William E. Peterman, University of Missouri; ... grouse, USDA Forest Service âfind-a-photo:â website; and bottom right, ... Missouri, 302 Anheuser-Busch Natural Resources Building, Columbia, MO 65211.
May 23, 2016 - The best full-range model included 11 predictors; high suitability was associated with close proximity to Saint Lucia fer-de-lance Bothrops ...
Nov 23, 2018 - Springer-Verlag GmbH Germany, part of Springer Nature 2019. Abstract. Collisions ... 2000; Borda-de-Agua et al. 2014). Consequently, in the ...
ally, habitat models are practical operational tools based on assessment of physical ... increased availability and coverage of remote sensing data,. e.g. satellite ...
categories have been utilized to devise clever schemes in computer graphics and ..... sin Press, 1983. [4] Manfred Brill, Hans Hagen, Hans-Christian Rodrian,.
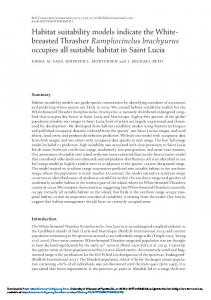
Visualizing uncertainty in habitat suitability models
Aug 24, 2018 - ronmental variables utilized can contribute uncertainty to HSMs. (Barry & Elith, 2006) .... In other words, the environmental niche of the species may ... small numbers of occurrences because of environmental variable .... indicate a higher confidence in the center of the predicted habitat ..... Hughes, L. (2010).
|
|
Received: 27 December 2017 Revised: 15 August 2018 Accepted: 24 August 2018 DOI: 10.1002/ece3.4720
ORIGINAL RESEARCH
Visualizing uncertainty in habitat suitability models with the hyper-envelope modeling interface, version 2 James Graham
| Melissa Kimble
Humboldt State University, Arcata, California Correspondence James Graham, Humboldt State University, Arcata, CA. Email: [email protected]
Abstract Habitat suitability models (HSMs) are popular and used for a wide variety of applications but most do not include analysis of the uncertainty of the model outputs. Additionally, some overfit the data and few allow the ability to fill data gaps with expert opinion. HEMI 1 addressed issues with overfitting data and allowed models to incorporate both occurrence data and expert opinion. HEMI 2 improves on HEMI 1 with a simplified interface and the ability to inject random noise into occurrence locations and environmental variable values to generate uncertainty maps. HEMI 2 uses Monte Carlo methods to perform uncertainty, validation, and sensitivity testing and generates mean and standard deviation habitat suitability maps. KEYWORDS
Bezier curves, habitat suitability modeling, hyper-envelope modeling interface, species distribution modeling, species niche, uncertainty
1 | I NTRO D U C TI O N
1.1 | Occurrence uncertainty
Ecological niche models, also known as habitat suitability mod-
All occurrence data contain uncertainty from a variety of sources of
els (HSMs), or species distribution models (SDM), have been used
error and inherent variability in the modeling process. Because oc-
to generate maps of potential species habitat (Elith et al., 2011;
currences are observations of a species’ presence at a specific point
Franklin, 2010). These models have also been used for conservation
in time, the uncertainty can include the following: species identifi-
and restoration ecology (Elith & Leathwick, 2009), identifying poten-
cation, coordinate uncertainty, and temporal uncertainty (Barrows,
tial hot spots for invasive species (Evangelista et al., 2008; Jarnevich
rence data and allowing the user to modify the response curves
aspect, roughness), and proximity (distance to streams, distance to roads; Franklin, 2010). Each pixel of an environmental variable contains a single value representing a complex spatial area on the ground (Pixel Mixing; Cracknell, 1998). Further, one pixel cannot represent microclimate temporal dynamics (Kearney et al., 2014). Small habitats, such as refuges for species, may therefore be underrepresented, or not represented at all (Gottschalk, Aue, Hotes, & Ekschmitt, 2011).
to mitigate for gaps in the occurrence data. 2. Resolve the performance issues from the first version of HEMI and thus allow a larger number of environmental variables to be used. 3. Expand the options to include uncertainty information based on error in the occurrence data and environmental variables. 4. Provide sensitivity testing for model parameters and validation testing.
Environmental variables such as temperature and precipitation can also represent periods of time that may not correlate well with spe-
The ability of HEMI 2 to model four tree species in North
cies establishment (Roubicek et al., 2010). These sources of error
America and address known gaps in occurrence data were shown
can contribute to a misleading sense of confidence in model out-
by Kimble, 2016. Kimble also evaluated HEMI 2’s ability to inject
puts when model uncertainty is not presented (Gould et al., 2014).
random noise into occurrence data and environmental variables and
Information on uncertainty in environmental variables may be
produced uncertainty maps for these tree species. This study cov-
available only as summary information across the entire environ-
ers the remaining two HEMI 2 goals: to evaluate HEMI 2’s operation
mental variable, or not at all. This error may be available as a range
with synthetic data sets with known sources of uncertainty and to
evaluate model robustness with validation and sensitivity testing for
terms (Hutchinson et al., 2009), or more complex distributions
model parameters.
(Kimble, 2016).
1.3 | Visualizing uncertainty with Monte Carlo methods and random noise injection
2.1 | HEMI 2’s modeling approach In the main HEMI 2 window, each environmental variable is represented by a model graph, which is the software’s representation of
Monte Carlo (MC) methods are commonly used when evaluating
the species’ response to that environmental variable. The graphs
HSM uncertainty (Elith et al., 2002). Cross‐validation, or repeatedly
cover the range of each environmental variable on the horizontal
subsampling occurrence data into test and training data sets, is a
axes. If we define z to be one of the environmental varaibles, then
common method to evaluate a model’s robustness against its occur-
f(z) represents the frequency of all the environmental variable values
rence data. Recently, Gould et al. (2014) created visualizations of the
(Figure 1, green line), f1(z) represents the frequency of environmen-
impacts of spatial uncertainty by injecting random noise into the oc-
tal values at just the occurrence locations (Figure 1, red line), and
currences of Anthochaera paradoxa (yellow wattlebird). Maps were
f1(z)/f(z) represents the division the two (Figure 1, blue line) (Elith
created by finding the proportion of pixels in the output that pre-
et al., 2011). This division seeks to remove the bias from under‐
dicted potential species habitat in 100 models. A similar process was
or overrepresented environmental values (Peterson et al., 2011).
used to create visualizations of the impact of uncertainty in climatic
Frequencies are represented by histograms with 256 bins and are
environmental variables on predicted species distributions (Gould et
rescaled such that their maximum value on the y‐axis is 1 to aid in
al., 2014).
visualizing the histograms together.
|
3
GRAHAM and KIMBLE
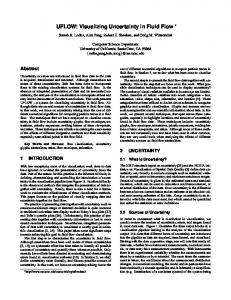
F I G U R E 1 A screen capture of the main HEMI 2 window with three environmental variables using occurrences for Ohio Buckeye in the continental United States. Data for each environmental variable appear in the columns on the left while the final model and its associated receiver operator characteristic curve (ROC curve) are on the right. For each environmental variable, each column contains, from top to bottom: An image of the variable, a model graph, a ROC curve, a map of habitat suitability based on that variable, and model statistics. The model graph contains a green histogram for all the environmental variable values, a red histogram for the environmental variable values at the occurrences, and a blue histogram for the red histogram divided by the green histogram. The black line represents the model fitted to the specific environmental variable While HEMI 2 can generate models using continuous or categorical variables, this study focused on continuous variables. An online tutorial is available that includes the use of categorical variables in HEMI 2 (http://gsp.humboldt.edu/HEMI2). Continuous models fitted to each environmental variable are represented by three Bezier curves (Figure 2). The control points can be manually adjusted by the user or automatically fit by HEMI 2. The first control point (Control Point 0) is restricted to the left and bottom sides of the graph. If this control point is on the left side of the graph, then our minimal environmental condition for this species was not within the sampled area. In other words, the environmental niche of the species may have been truncated. If this same control point is on the bottom side, then all environmental variable values to the left of this point were not considered suitable habitat for the species. The same restriction applies to the last control point (Control Point 3), but to the bottom and right sides, respectively. The remaining control points (1 and 2) can move anywhere within the graph as long as Control Point 0 is to
F I G U R E 2 Each model is defined by four control points
|
GRAHAM and KIMBLE
4
the left of Control Point 1, Control Point 1 is to the left of Control
estimated parameters, or control points, the model with the maxi-
Point 2, and Control Point 2 is to the left of Control Point 3.
mum likelihood will also have the minimum AIC. AIC = 2k − ln ()
2.2 | Fitting the model Models are fit automatically by placing a grid of possible positions for the control points over the graph and then trying all possible combinations of positions for the control points on the grid, and then selecting the positions that provide the maximum likelihood. The grid is created with 10 rows by 10 columns over the entire range of the environmental variable (x‐axis) and from 0 to 1 for the habitat suitability (y‐axis). The process is then repeated recursively with grids around the selected position. The number of grids and their width can be set by the user. The models are fit to f1(z)/f(z) by default as this compensates for small numbers of occurrences because of environmental variable ranges that are underrepresented. Similarly, fitting models to fit to f1(z)/f(z) will keep environmental variable ranges that are overrepresented from dominating a model when they only include only a
Using histograms greatly improves the speed of finding the most parsimonious model fit and makes the time to fit the model the same regardless of the number of occurrences provided. The trade‐off is a small amount of difference between the histogram‐computed AIC values and the traditionally computed AIC values from direct environmental variable values. This difference is introduced when environmental variables are quantized into histogram bins. However, since HEMI 2 uses 256 bins, the difference is less than half of a percentage point. HEMI 2 also computes receiver operator curves (ROC) and area under the curve (AUC) (Fielding & Bell, 1997) performance metrics. Likelihood (effectively AIC) was preferred for fitting the model because it selects more parsimonious models (Burnham & Anderson, 2002).
small number of occurrences as. If desired, the models can also be
2.3 | Monte Carlo features
fit directly to f1(z). Maximum likelihood can be computed by multiplying together the probability of each occurrence, given the model, together as in:
Random noise injection, sensitivity testing, and cross‐validation testing were implemented in a single Monte Carlo feature. Random noise can be injected into occurrence data and/or the environmen-
n ∏ ( ) (Θ|x) = p xi |Θ i=0
tal variables, and the models can be fitted repeatedly to characterize the impact of noise on the models and resulting habitat maps. Cross‐validation and sensitivity testing can also be run indepen-
Where is the likelihood of the model Θ given a dataset x, p is the probability of a specific occurrence given the model Θ, and n is the number of occurrences. By taking the natural log of the equation above, we obtain the following: ln ( (Θ|x)) =
n ∑ i
dently or with noise injection. This allows the flexibility to evaluate each of the Monte Carlo features independently or to examine the combined effects of multiple areas of uncertainty. Outputs of Monte Carlo runs include frequency histograms for area under the curve (AUC) and AIC values, jackknife results which show the AIC
( ( )) ln p xi |Θ
and AUC values for each combination of environmental variables, and results for each iteration of the model. When the locations of occurrences are uncertain, random values
This results in an increasing number of calculations and can be
are drawn from a noise distribution specified by the user and then
time‐consuming for large datasets. We can take advantage of the
added to each occurrence coordinate. For environmental variables,
histograms in HEMI 2 to reduce the number of calculations with:
values are drawn from a specified distribution and then added to the
m
ln ( (Θ|x)) =
∑ j
( ( )) ln p hj |Θ Cj
where m is the number of bins in the histogram, hj is the environmental variable value that corresponds to bin j, and Cj is the number of occurrences in bin j. p(hj|Θ) is computed by selecting the appropriate model value for the bin hj and converting this value to a probability
pixels within the environmental variable raster. For regions where the uncertainty may change spatially, such as a desert region with plateaus and canyons, the parameters for the random distribution can be specified with rasters. After noise injection, the occurrences are divided into test and training data, the model is fit, sensitivity analysis is performed by injecting noise into the estimated parameters for the model (i.e., the control point positions), and then, perfor-
by dividing it by the area under the model. The negative of the re-
mance statistics are computed based on the test dataset (Figure 3).
sult can then be used directly to compute the likelihood portion of
The user may select any combination of steps and set the number
Akaike information criterion (AIC, Akaike 1974).
of iterations for HEMI 2 to execute. When all iterations have been
For continuous data, each model has four control points with
completed, summary performance statistics are made available on
the first and last having one degree of freedom and the middle two
a web page with maps representing the minimum, maximum, and
having 2 degrees of freedom. This gives six estimated parameters
mean habitat suitability maps. A map of the standard deviation for
for each model. Since all of the models have the same number of
each pixel of the habitat maps is also provided to evaluate areas
|
5
GRAHAM and KIMBLE
F I G U R E 3 Diagram of HEMI 2’s Monte Carlo feature. The process begins at the top with injecting noise into the occurrences and environmental data. The occurrences are then split into test and training data sets with the training data used to fit the model against the environmental variables. Sensitivity testing injects noise into the model before the final habitat map is created. Then, the test data are used to compute performance statistics which are saved for each run. The process repeats a specified number of iterations
where uncertainty is higher than others. HEMI 2 also executes a
Each variable represented a measured environmental value that
jackknife operation to provide performance metrics for each com-
ranged uniformly from 0 to 100; where one changed in the Y
bination of environmental variables. Charts are also included in the
direction (Figure 4a) and the other changed in the X direction
output showing the response curves with minimum, maximum, and
(Figure 4b).
mean values and a 95% confidence interval. Histograms of the log‐
We adjusted response curves to represent the response of the
likelihood, AIC, and AUC values are provided with charts of the cu-
hypothetical species to each synthetic environmental variable, ef-
mulative means and standard deviations for AIC and AUC to help
fectively describing the environmental range of the species. The
determine the number of runs that are required for the model to
response curve for the “BottomToTop” variable was chosen to be rel-
reach a stable state.
atively wide while the response curve for the “LeftToRight” variable was made to be relatively narrow (Figure 5).
3 | C R E ATI N G H A B ITAT S U ITA B I LIT Y M A P S FRO M S Y NTH E TI C DATA
A synthetic habitat map was then produced using the value of each corresponding pixel from the environmental values to obtain a habitat suitability value from each response curve and then multiplying the values together. This map represents the environmental
The first step in our analysis was to show that HEMI 2 could produce
range of the species. Species suitability to the environment was then
an accurate habitat suitability map from synthetically created occur-
simulated by uniformly distributing random occurrences across the
rence data and environmental variables. Using synthetic data within a
synthetic habitat. Occurrences were removed if their correspond-
habitat model has the advantage of allowing the modeler to compare
ing value for habitat suitability was below a random value generated
the model’s performance with an expected result (McCune, 2006).
from a uniform distribution from 0 to 1.0 (Figure 6).
To begin, two synthetic environmental variables were created
We then ran HEMI 2 against these filtered occurrences and
with a uniform range to simplify interpretation of model results.
the original synthetic environmental variables to produce habitat
|
6
GRAHAM and KIMBLE
F I G U R E 4 Synthetic environmental variables representing a range of a fictitious environmental variable with a range in the study area from 0 to 100. Variables are named “BottomToTop” (a) and “LeftToRight” (b) based on the direction of change for the variable
F I G U R E 5 The synthetic response curves for the “BottomToTop” variable and the “LeftToRight” response variable with the “best” habitat for the species being at approximately 50 with poor habitat at 0 and 100
suitability models for each environmental variable (Figure 7). These models were used to produce a predicted habitat suitability map based on the occurrences (Figure 8a). Subtracting the HSM developed from the response curves from the original habitat map resulted in a maximum difference of 11%. The skewing of the response curve for the BottomToTopResponse curves shown visible as the difference of 11% toward the bottom of the image (Figure 8b).
4 | M O D E LI N G TH E U N C E RTA I NT Y O F O CCU R R E N C E DATA Random noise was injected into the synthetically created occurrence locations by randomly altering the original occurrence locations by a standard deviation of 1% (10 units). We assumed that the study area is a small region that is 1 km in each direction and contains a microhabitat similar to the one modeled in the previous
F I G U R E 6 A simulated habitat map with occurrences added based on the probability of survival from the underlying pixel for the habitat map
|
7
GRAHAM and KIMBLE
F I G U R E 7 Modeled response curves. The green histogram graph is a histogram of environmental variable the full area while the red is a histogram of the environmental variables at the occurrences. Note that the curve on the left is skewed to the left because the random selection of occurrences based on the habitat model happened to be skewed to the left
F I G U R E 8 Habitat map generated by HEMI 2 from the modeled response curves (a) and the result of subtracting the original habitat map from the predicted map produced by HEMI 2 (b)
section. In this case, a standard deviation of 1% would be equivalent to 10 m, which is typical for a handheld GPS (USDOD, 2008; Wing et al., 2005). The model was run 100 times and resulted in a mean AIC of 26,423 with a standard deviation of 14. The mean AUC value was 0.78 with a standard deviation of less than 0.001. HEMI 2 also produces maps of the standard deviation (Figure 9) and response curves showing the mean, minimum, maximum, and confidence intervals (Figure 10). The maps can be used to evaluate the spatial distribution of high or low confidence within our models, while the response curves characterize the variance within our models for each environmental variable. HEMI 2 produced histograms of the AIC and AUC values and graphs of the cumulative mean value for AIC and AUC (Figure 11) for all model runs. The histograms should approach a normal distribution when sufficient runs have been completed and the cumulative AIC and AUC curves should show that these values are stabilizing over time. The histograms and
F I G U R E 9 Uncertainty map of the standard deviation of 100 model runs with noise injected into the occurrence coordinates
performance metrics for each run are available on the HEMI 2 Web site (http://gsp.humboldt.edu/HEMI2). habitat map (Figure 12). The corresponding map of standard deviation shows that uncertainty was associated with the edges of the
5 | M O D E LI N G U N I FO R M U N C E RTA I NT Y I N E N V I RO N M E NTA L VA R I A B LE S
predicted habitat suitability. The distribution of uncertainty could indicate a higher confidence in the center of the predicted habitat suitability.
Random noise was injected into the “BottomToTop” environmen-
The resulting maximum habitat map elongated the habitat in the
tal variable based on a normal distribution with a mean of 0 and a
direction of the BottomToTop environmental gradient. This shows
standard deviation of 10. The resulting AUC dropped to 0.76 with
the maximum potential distribution of habitat suitability among
a standard deviation of 0.003 while the AIC rose to 26,668 with a
iterations for the species and could be used when managers want
standard deviation of 32. Noise injection resulted in the blurring of
to maximize the conservation range for a species (Jones, 2012). An
the edges of the habitat suitability map at the top and bottom of the
example might be when needing to survey for establishment and
|
8
GRAHAM and KIMBLE
F I G U R E 1 0 Response curve for the LeftToRight environmental variable showing the mean, minimum, and maximum curves for all model runs. The 96% confidence interval has little difference from the mean and is covering it in this graph
F I G U R E 1 1 Graphs showing that the running AUC means (a) and the running AIC means (b) (vertical axis) have effectively stabilized after 100 model runs (horizontal axis)
F I G U R E 1 2 The mean predicted habitat model with normally distributed noise injected into the “BottomToTop” environmental variable (a) and the resulting uncertainty map showing the standard deviation of the habitat models generated during the run (b)
spread of an invasive species. The minimum habitat map shows a shrinking of the habitat in the BottomToTop direction. This map could be interpreted as having high confidence that the remaining
6 | M O D E LI N G S PATI A LLY D E PE N D E NT U N C E RTA I NT Y I N E N V I RO N M E NTA L VA R I A B LE S
area contains a large quantity of highly suitable habitat for the species. This might be used to set up a refuge for an endangered species
Available environmental variables already contain pixel values
(Figure 13).
that represent a simplified mix of an area on the earth. In many
The intersection of noise injected response curves extended
cases, these homogenized landscapes are further reduced by the
from 10 and 90 to 0 and 100. The minimum and maximum ranges
downsampling of environmental variables (Gottschalk et al., 2011) to
were more visible as a result (Figure 14).
reduce resolutions when modeling at large extents. Downsampling
|
9
GRAHAM and KIMBLE
F I G U R E 1 3 The maximum predicted habitat (a) and the minimum predicted habitat (b) when noise is injected into the BottomToTop environmental variable
consequently amplifies the uncertainty of the pixel values. Some
environmental variable with values ranging from 0 (poor habitat) to
landscapes are, however, more variable than others such as moun-
255 (optimal habitat). Two downsampled environmental variables
tainous regions (Hijmans et al., 2005). Therefore, if the pixels are
were created: one using nearest neighbor sampling and the other
very large (e.g., 1–4 km), then some individual pixels will represent
using an averaging method (Cracknell, 1998).
a variety of habitat types (narrow canyons and plateaus) while others may be uniform (e.g., a large desert) (Hutchinson, 1991). For this reason, the spatial distribution of uncertainty from a simplified land-
6.1 | Original environmental variable
scape is dependent on the original variability within that landscape.
The model using the original environmental variable performed well
One solution is to obtain higher resolution data for the study area
with an AUC of 0.97 (AIC of 15,993) and a response curve showing
and measure the standard deviation for the pixels in the higher reso-
the species preference for the high values (near 255) in the original
lution raster that overlap with each pixel in the lower‐resolution ras-
habitat map (Figure 15 and X.A1).
ter. The resulting data can then be used to inject spatially dependent noise into an HSM to create maps showing areas of high certainty versus low certainty. If a higher resolution raster is not available for a specific environmental variable, another raster may be able to be
6.2 | Downsampled environmental variable using nearest neighbor sampling
used as the uncertainty. Examples might include terrain roughness
The next environmental variable was created by downsampling
for temperature variables.
the original by a factor of 8 using nearest neighbor selection. This
To model the spatially dependent uncertainty in environmen-
produced an environmental variable with breaks in the habitat. The
tal variables, we created a synthetic habitat map with a relatively
break occurred where the nearest neighbor algorithm happened to
narrow area of habitat that might represent a narrow canyon. We
select pixels to the left or right of the actual habitat area. This model
produced 1,000 occurrence points randomly placed within the area
produced an AUC of 0.78 (AIC of 10,054) and at first may appear
defined as habitat. The synthetic habitat map was then used as an
to be an acceptable model. However, if we examine the response
F I G U R E 1 4 Response curves for the BottomToTop variable (a) and the LeftToRight variable (b). The resulting response curve for the unmodified LeftToRight variable is as expected while the response for the BottomToTop variable with noise injected shows a wide range of response curve values and, for the first time, we can see the 95% confidence interval around the mean response curve
|
GRAHAM and KIMBLE
10
curve, we see that the habitat suitability has shifted to the left
based on the original distribution of pixels (Figure 18). This resulted
(Figure 19.b1). This shows that the model includes unsuitable habitat
in an average AUC of 0.64 and a mean response curve that was very
represented by pixels that now contain occurrences because of the
similar to the one generated with the nearest neighbor downsam-
nearest neighbor algorithm (Figure 16).
pling method (Figure 19.c2).
To model the uncertainty in the habitat map, we created a raster where each pixel represented the standard deviation of the neighboring pixels in an 8 × 8 grid. This raster was then
6.4 | Validation testing
downsampled by a factor of 8 to match the environmental vari-
Validation testing for the first set of synthetic data was run with 70%
able. Noise was injected into the downsampled raster through
of the data used to train the model and the remaining 30% used for
the Monte Carlo feature in HEMI 2. While the inclusion of noise
testing. 100 iterations were run and showed the model to be rela-
fully recreated the original suitable habitat, it also overpredicted
tively stable, where subsets of the occurrences had a mean AIC of
the original area of the species’ habitat because of the extreme
8,472 and a standard deviation of 840. The mean AUC was 0.79 with
standard deviation values used (Figure 17). In a real scenario,
a standard deviation of 0.007.
the standard deviation values would rarely be this extreme. However, this exercise shows the value of injecting noise into models where the species habitat may be in relatively small areas.
6.5 | Sensitivity testing
The real lesson is that the resolution of environmental variables
Sensitivity testing of the model parameters was executed on the
must be high enough to maintain even small areas of habitat if the
first set of synthetic data by injecting noise based on a mean of
model is to be used reliably.
0 and a standard deviation of 10 into the coefficients for the re-
The resulting response curve shows a large variation in the minimum and maximum values of the response curve (Figure 19.b2).
sponse curve for the BottomToTop environmental variable. This was accomplished by moving the control points on the response curve based on values generated from a normal distribution,
6.3 | Downsampled environmental variable using averaging methods Another approach to downsampling is by averaging the pixels that overlap with the resulting pixel in the downsampled image. This
which produced a mean AIC of 26,912 and a standard deviation of 852. The mean AUC was 0.79 with a standard deviation of 0.001.
7 | CO N C LU S I O N
method has the advantage of providing a mean of the original pixel but will also produce new values rather than using the existing val-
With HEMI 2, we were able to create uncertainty maps of the mean,
ues in the environmental variable raster. For this study, we created
minimum, and maximum of habitat suitability by injecting noise into
a raster that was downsampled 3 times using a bilinear averaging
occurrence locations, environmental variable rasters, and model
method (Bolstad, 2008). The resulting model had an AUC of 0.89 and
parameters. This was shown for synthetically created data includ-
a response curve that looked much like the original (Figure 19.c1).
ing environmental variables where suitability habitat was under-
The same standard deviation raster from the previous section
represented because of downsampling. The mean habitat suitability
could then be used to inject noise into the environmental variable
map can be used as an approximate measure of a species’ potential
F I G U R E 1 5 The original raster defining the available habitat for the species (a), the 1,000 occurrence points that were added based on the original habitat raster (b) and the habitat model based on the occurrences and using the original habitat as the environmental variable (c)
|
11
GRAHAM and KIMBLE
F I G U R E 1 6 The downsampled environmental variable that now has gaps because of the nearest neighbor algorithm (a) and the resulting habitat model (b)
F I G U R E 1 7 The environmental variable that was downsampled using a nearest neighbor method (a), the standard deviation of the pixels around each pixel in the downsampled environmental variable (b), and the resulting model when noise is injected into the model‐based standard deviation raster (c) geographic range, whereas the minimum habitat suitability has the
occurrence locations will be of value as the accuracy of data col-
potential to provide an informed preservation guide on the most
lection devices may cause occurrences to change which pixel their
valuable habitat for a species. This may be critical when setting up a
environmental variables are drawn from. For large extents when the
refuge for an endangered species. The maximum habitat map is use-
pixels are large (i.e., modeling countries or the world at 1–4 km per
ful in scenarios where we need to survey all possible areas, including
pixel), injecting noise into the environmental variables would be of
small refuges, such as for an invasive species.
more value as the pixels represent larger areas and thus a greater
The noise injection features of HEMI 2 are valuable for model-
variety of habitat on the ground. Typical GIS software provides the
ing uncertainty but different features may be more valuable at dif-
ability to find statistics for neighboring pixels when downsampling
ferent modeling extents. For small extents, injecting noise into the
environmental variables.
|
GRAHAM and KIMBLE
12
F I G U R E 1 8 The environmental variable that was downsampled using a bilinear method applied three times (a), the standard deviation of the pixels around each pixel in the downsampled environmental variable (b), and the resulting model when noise is injected into the model‐ based standard deviation raster (c) Using histograms to compute model fit statistics solved the performance problems of the first version of HEMI and allowed for a larger number of environmental variables. However, the statistics varied slightly from statistics computed using the final results and the performance of the interface could still be improved. HEMI 2 was tested with over 20 environmental variables and performed well but this required the computer to have enough memory for all the environmental variables to be loaded into memory at one time. Accessing the environmental variables from files on disk would remove the memory restrictions but would also slow the performance of HEMI 2. Injecting noise into or randomly perturbing data are recommended techniques for uncertainty testing on predictive models (Jakeman, Letcher, & Norton, 2006). The popular modeling software MaxEnt addresses uncertainty with cross‐validation, bootstrap, and jackknife testing (Elith et al., 2011). Third‐party applications for MaxEnt complement these built‐in tests with direct model comparison (ENMTools; Warren, Glor, & Turelli, 2010) and random noise injection (Gould et al., 2014), but do not provide sensitivity testing of model coefficients or a combination of all of F I G U R E 1 9 On the left are response curves based on the original environmental variable (a1), the downsampled map using nearest neighbor downsampling, (b1) and using an environmental variable that was downsampled 3 times using bilinear sampling (c1). Note that the response curve for the nearest neighbor data has shifted to the left because of the occurrence values that appear on pixels that contain values that are no longer representative of the species’ habitat. On the right are aggregate response curves of 100 models with spatially dependent noise based on the standard deviation of the neighborhood around each downsampled pixel for nearest neighbor sampling (b2) and for bilinear downsampling (c2)
these approaches in a single HSM. HEMI 2 is the first software package to provide a rigorous suite of uncertainty tests that include noise injection, cross‐validation, and sensitivity testing, and provides the computational strength to combine all of these in a single HSM. The Monte Carlo methods used with HEMI 2 gave us much more confidence in our models than previous approaches. Because of this, the noise injection and validation Monte Carlo features have also been implemented for the popular SDM modeling software MaxEnt (Phillips, Dudik, & Schapire, 2004) and are available in BlueSpray.
|
13
GRAHAM and KIMBLE
An area of concern within HEMI 2 is that if the user provides a data set with multiple occurrences per pixel in the environmental layer, the model will shift to representing abundance and could in-
ORCID James Graham
https://orcid.org/0000-0002-3725-5037
troduce bias if the occurrence data are biased. Another concern, and one of the most controversial topics within HEMI 2, may be its ability to allow the user to move the control points of response curves. This has been shown by Kimble to be of value in some situations but should only be practiced if there is existing knowledge that specifies the species’ response to each adjusted response curve. HEMI 2, like all modeling software, is just a tool and relies on the user to make sound modeling decisions. Our goal was to provide a full suite of uncertainty tools that will increase accessibility to modelers and to provide a framework that can be later built upon. We hope that this framework and those currently available will help to provide the basis for upping the momentum of making uncertainty testing a fundamental component of habitat suitability modeling.
8 | S O F T WA R E AVA I L A B I LIT Y HEMI 2 was implemented within BlueSpray which is a geographic information system (GIS) created by SchoonerTurtles, Inc. BlueSpray is available from Humboldt State University at http://gsp.humboldt. edu/isamm/BlueSpray.html. A Quick Start tutorial is available for the modeling feature, HEMI 2, by clicking the help button (?) in the main HEMI 2 dialog. Additional tutorials and examples of HEMI 2 HSMs, including all model runs from this study and a comparison study with MaxEnt, are available at http://gsp.humboldt.edu/HEMI2.
AC K N OW L E D G M E N T S HEMI 2 was the result of over 10 years of research, initially with the Natural Resource and Ecology Laboratory at Colorado State University and in conjunction with the United States Geological Survey. This work could not have been completed without the assistance of Dr. Thomas Stohlgren, Dr. Greg Newman, Dr. Catherine Jarnevich, and Dr. Paul Evangelista.
C O N FL I C T O F I N T E R E S T None declared.
AU T H O R C O N T R I B U T I O N S Jim Graham was the primary inventor and creator of HEMI 2 and was the primary author of the paper. Melissa Kimble contributed additions and edits throughout the paper and devised using running means to determine the number of required runs.
DATA ACC E S S I B I L I T Y Data presented in this paper are available at www.Pangaea.de, PDI‐17365.
REFERENCES Akaike, H. (1974). A new look at the statistical model identification. IEEE Transactions on Automatic Control, 19(6), 716–723. https://doi. org/10.1109/TAC.1974.1100705 Anderson, R. P., & Gonzalez, I. (2011). Species‐specific tuning increases robustness to sampling bias in models of species distributions: An implementation with Maxent. Ecological Modelling, 222(2011), 2796–2811. Barrows, C., Preston, K., Rotenberry, J., & Allen, M. (2008). Using occurrence records to model historic distributions and estimate habitat losses for two psammophilic lizards. Biological Conservation, 141(7), 1885–1893. https://doi.org/10.1016/j.biocon.2008.05.006 Barry, S., & Elith, J. (2006). Error and uncertainty in habitat models. Journal of Applied Ecology, 43(3), 413–423. https://doi. org/10.1111/j.1365-2664.2006.01136.x Bolstad, P. (2008). GIS fundamentals (3rd ed.). Sedona, AZ: Eider Press. Burnham, K., & Anderson, D. (2002). Model selection and multimodel inference. Berlin, Germany: Springer Science+Business Media, LLC. https://doi.org/10.1007/978-0-387-22456-5 Cracknell, A. P. (1998). Review article Synergy in remote sensing‐what's in a pixel? International Journal of Remote Sensing, 19(11), 2025–2047. https://doi.org/10.1080/014311698214848 Elith, J., Burgman, M., & Regan, H. (2002). Mapping epistemic uncertainties and vague concepts in predictions of species distribution. Ecological Modelling, 157(2), 313–329. https://doi.org/10.1016/ S0304-3800(02)00202-8 Elith, J., & Leathwick, J. R. (2009). Species distribution models: Ecological explanation and prediction across space and time. Annual Review of Ecology, Evolution, and Systematics, 40, 677–697. https://doi. org/10.1146/annurev.ecolsys.110308.120159 Elith, J., Phillips, S., Hastie, T., Dudík, M., Chee, Y., & Yates, C. J. (2011). A statistical explanation of MaxEnt for ecologists. Diversity and Distributions, 17(1), 43–57. https://doi. org/10.1111/j.1472-4642.2010.00725.x Evangelista, P. H., Kumar, S., Stohlgren, T. J., Jarnevich, C. S., Crall, A. W., Norman, J. B., & Barnett, D. T. (2008). Modelling invasion for a habitat generalist and a specialist plant species. Diversity and Distributions, 14(5), 808–817. https://doi.org/10.1111/j.1472-4642.2008.00486.x Fielding, A., & Bell, J. (1997). A review of methods for the assessment of prediction errors in conservation presence/absence models. Environmental Conservation, 24(1), 38–49. https://doi.org/10.1017/ S0376892997000088 Franklin, J. (2010). Mapping species distributions: Spatial inference and prediction, ecology, biodiversity and conservation. Cambridge, UK: Cambridge University Press. Kindle Edition. Gottschalk, T., Aue, B., Hotes, S., & Ekschmitt, K. (2011). Influence of grain size on species–habitat models. Ecological Modelling, 222(18), 3403–3412. https://doi.org/10.1016/j.ecolmodel.2011.07.008 Gould, S. F., Beeton, N. J., Harris, R. M. B., Hutchinson, M. F., Lechner, A. M., Porfirio, L. L., & Mackey, B. G. (2014). A tool for simulating and communicating uncertainty when modelling species distributions under future climates. Ecology and Evolution, 4(24), 4798–4811. https://doi.org/10.1002/ece3.1319 Graham, J., Young, N., Jarnevich, C. S., Newman, G., Evangelista, P., & Stohlgren, T. J. (2013). The hyper‐envelope modeling interface (HEMI): A novel approach illustrated through predicting Tamarisk (Tamarix spp.) habitat in the western USA. Environmental Management, 52(4), 929–938. https://doi.org/10.1007/s00267-013-0144-3
|
GRAHAM and KIMBLE
14
Guisan, A., Broennimann, O., Engler, R., Vust, M., Yoccoz, N. G., Lehmann, A., & Zimmermann, N. E. (2006). Using niche‐based models to improve the sampling of rare species. Conservation Biology, 20(2), 501– 511. https://doi.org/10.1111/j.1523-1739.2006.00354.x Hijmans, R., Cameron, S., Parra, J., Jones, P., & Jarvis, A. (2005). Very high resolution interpolated climate surfaces for global land areas. International Journal of Climatology, 25(15), 1965–1978. https://doi. org/10.1002/joc.1276 Hutchinson, M. F. (1991). The application of thin plate smoothing splines to continent‐wide data assimilation. Data Assimilation systems, BMRC Research Report No. 27. Pp. 104–113 (Ed. J. D. Jasper). Bureau of Meteorology, Melbourne. Hutchinson, M. F., McKenney, D. W., Lawrence, K., Pedlar, J. H., Hopkinson, R. F., Milewska, E., & Papadopol, P. (2009). Development and testing of Canada‐wide interpolated spatial models of daily minimum‐maximum temperature and precipitation for 1961–2003. Journal of Applied Meteorology and Climatology, 48(4), 725–741. https://doi.org/10.1175/2008JAMC1979.1 Jakeman, A. J., Letcher, R. A., & Norton, J. P. (2006). Ten iterative steps in development and evaluation of environmental models. Environmental Modeling and Software., 21(5), 602–614. https://doi.org/10.1016/j. envsoft.2006.01.004 Jarnevich, C. S., & Reynolds, L. V. (2011). Challenges of predicting the potential distribution of a slow‐spreading invader: A habitat suitability map for an invasive riparian tree. Biological Invasions., 13, 153. https://doi.org/10.1007/s10530-010-9798-4 Jones, C. C. (2012). Challenges in predicting the future distributions of invasive plant species. Forest Ecology and Management, 284, 69–77. https://doi.org/10.1016/j.foreco.2012.07.024 Kadmon, R., Farber, O., & Danin, A. (2004). Effect of roadside bias on the accuracy of predictive maps produced by bioclimatic models. Ecological Applications, 14, 401–413. https://doi.org/10.1890/02-5364 Kearney, M. R., Shamakhy, A., Tingley, R., Karoly, D. J., Hoffmann, A. A., Briggs, P. R., & Porter, W. P. (2014). Microclimate modelling at macro scales: a test of a general microclimate model integrated with gridded continental‐scale soil and weather data. Methods in Ecology and Evolution, 5, 273–286. https://doi.org/10.1111/2041-210X.12148 Kimble, M. (2016). Mapping uncertainty for habitat Suitability models for four North American tree species. Graduate Thesis. Humboldt State University, California, USA. McCune, B. (2006). Non‐parametric habitat models with automatic interactions. Journal of Vegetation Science, 17, 819–830. https://doi. org/10.1111/j.1654-1103.2006.tb02505.x Moudrý, V., & Šímová, P. (2012). Influence of positional accuracy, sample size and scale on modelling species distributions: A review.
International Journal of Geographical Information Science, 26(11), 2083–2095. https://doi.org/10.1080/13658816.2012.721553 Pearson, R. (2010). Species’ distribution modeling for conservation educators and practitioners. Lessons in Conservation, American Museum of Natural History, 3, 56–89. ISSN 1938–7024. Peterson, A. T., Soberon, J., Pearson, R. G., Anderson, R. P., Martinez‐ Meyer, E., Nakamura, M., & Araujo, M. B. (2011). Ecological niches and geographic distributions. Princeton, NJ: Princeton University Press. Phillips, S. J., Dudik, M., & Schapire, R. E. (2004).A maximum entropy approach to species distribution modeling. In: Proceedings of the 21st International Conference on Machine Learning, ACMPress, New York, pp. 655–662. Phillips, S., Dudik, M., Elith, J., Graham, C., Lehmann, A., Leathwick, J., & Ferrier, S. (2009). Sample selection bias and presence‐only distribution models: Implications for background and pseudo‐absence data. Ecological Applications, 19(1), 181–197. https://doi. org/10.1890/07-2153.1 Roubicek, A. J., VanDerWal, J., Beaumont, L. J., Pitman, A. J., Wilson, P., & Hughes, L. (2010). Does the choice of climate baseline matter in ecological niche modelling? Ecological Modelling, 221(19), 2280–2286. https://doi.org/10.1016/j.ecolmodel.2010.06.021 Thuiller, W., Brotons, L., Araújo, M. B., & Lavorel, S. (2004). Effects of restricting environmental range of data to project current and future species distributions. Ecography, 27(2), 165–172. https://doi. org/10.1111/j.0906-7590.2004.03673.x USDOD. (2008). Global positioning system standard positioning service performance standard, 4th Edition, United States Department of Defense. Warren, D. L., Glor, R. E., & Turelli, M. (2010). ENMTools: A toolbox for comparative studies of environmental niche models. Ecography, 33(3), 607–611. https://doi.org/10.1111/j.1600-0587.2009.06142.x Wieczorek, J. R., Guo, Q., & Hijmans, R. J. (2004). The point‐radius method for georeferencing point localities and calculating associated uncertainty. International Journal of Geographic Information Science, 18, 745–767. Wing, M. G., Eklund, A., & Kellogg, L. D. (2005). Consumer‐grade global positioning system (GPS) accuracy and reliability. Journal of Forestry, 103(4), 169–173. https://doi.org/10.1093/jof/103.4.169
How to cite this article: Graham J, Kimble M. Visualizing uncertainty in habitat suitability models with the hyperenvelope modeling interface, version 2. Ecol Evol. 2018;00: 1–14. https://doi.org/10.1002/ece3.4720