To assess the association between vitamin D deficiency and tuberculosis disease progression, we studied vitamin D levels in a cohort of tuberculosis patients ...
Vitamin D Deficiency and Tuberculosis Progression Najeeha Talat, Sharon Perry, Julie Parsonnet, Ghaffar Dawood, and Rabia Hussain To assess the association between vitamin D deficiency and tuberculosis disease progression, we studied vitamin D levels in a cohort of tuberculosis patients and their contacts (N = 129) in Pakistan. Most (79%) persons showed deficiency. Low vitamin D levels were associated with a 5-fold increased risk for progression to tuberculosis.
D
eficiency of vitamin D (25-hydroxycholecalciferol) has long been implicated in activation of tuberculosis (TB) (1). Serum levels of vitamin D in TB patients are lower than in healthy controls (2,3). Paradoxically, prolonged treatment of TB also causes a decline in serum vitamin D levels (2). Several studies have suggested that vitamin D is a potent immunomodulator of innate immune responses (4,5) by acting as a cofactor for induction of antimycobacterial activity (6). Of the 22 countries that have the highest TB incidence, Pakistan ranks eighth. In a previous study in Karachi, we observed that active disease developed in 7 (6.4%) of 109 TB case-contacts within 2 years (7). In the present study, we explored the role of vitamin D deficiency in TB disease progression within this cohort. The Study Household contacts (n = 109) of 20 patients with recently diagnosed sputum-positive pulmonary TB (index case-patients) were enrolled at Masoomeen General Hospital, in Karachi during 2001–2004 for a TB household cohort study (7). Blood samples were collected at baseline and at 6, 12, and 24 months follow-up. Visiting health workers reviewed clinical charts every 3 months for the first 24 months and at a final home study visit during November 2007–January 2008 (45–74 months from baseline). Persons with secondary cases were referred to a consultant at Masoomeen General Hospital for additional investigation, including assessment of physical signs and symptoms, laboratory tests, chest radiographs, and sputum smear mi-
Author affiliations: Aga Khan University, Karachi, Pakistan (N. Talat, R. Hussain); Stanford University School of Medicine, Stanford, California, USA (S. Perry, J. Parsonnet); and Masoomeen General Hospital, Karachi, Pakistan (G. Dawood) DOI: 10.3201/eid1605.091693
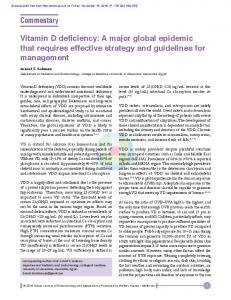
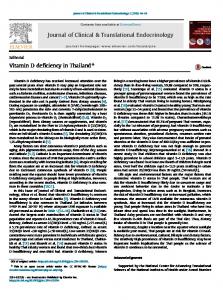
croscopy (7). For the present study, 129 de-identified, plasma samples preserved at –70°C from the baseline visit were shipped to Stanford University (Stanford, CA, USA) for analysis of vitamin D levels. Total circulating serum 25[OH] vitamin D was measured with ELISA by using the Immuno Diagnostic System Ltd (IDS, Fountain Hill, AZ, USA). All protocols were followed according to manufacturer’s instructions. Each test was run in duplicate, with mean absorbance computed from the average for 2 wells normalized to a zero calibrator well. Levels of vitamin D in test samples were derived by fitting a 2-parameter logistic curve to 6 standard levels and expressed as ng/mL (1 nmol/L × 0.4 = 1 ng/mL). All R2 values were >95%. The assay detection range was 6–360 nmol/L (2.4–144 ng/ mL). Levels in 1 person were below the detection limit and were excluded from analysis. The ethical review committees of Aga Khan and Stanford universities approved the study protocol. We used Kaplan-Meier analysis to evaluate the association of vitamin D levels with outcome of TB disease in 100 household contacts completing >1 follow-up visit. Vitamin D levels in the cohort were classified in populationbased tertiles (low, middle, high). We used SAS version 9.3 (SAS Institute, Cary, NC, USA) for statistical analyses. Median vitamin D level for the 128 cohort participants was 9.1 ng/mL (interquatrile range [IQR] 5.3–14.7); levels were 9.6 ng/mL (IQR 5.8–19.1) for 100 disease-free contacts, 7.9 ng/mL (IQR 4.7–10.3) for 20 TB index casepatients, 4.6 ng/mL (IQR 4.0–5.2) for 2 co-prevalent TB case-patients who were receiving antituberculous treatment at recruitment, and 5.1 ng/mL (IQR 3.4–14.3) in 6 household contacts with a history of TB treatment (2–10 years) (Figure 1, panel A). In the 100 disease-free household contacts, vitamin D levels were significantly higher than in the 28 participants with a history of TB diagnosis at baseline (p = 0.02; Mann-Whitney U test) (Figure 1, panel B). Median vitamin D levels were significantly lower in the 74 female patients than in the 54 male patients (7.8 vs. 11.9, MannWhitney U test, p = 0.0004) (Figure 1, panel C). When we stratified the cohort by vitamin D level, 79% had deficient (30 ng/mL) levels of vitamin D (Table). We next analyzed risk for progression to active TB in relation to plasma vitamin D levels. Of the 100 disease-free household contacts, 8 (8%) progressed to active disease during 4 years of follow-up. TB progression was significantly associated with relatively lower plasma vitamin D levels (Figure 2). Disease progressed in 7 (23%) of 30 patients with plasma vitamin D levels in the lowest tertile (13 ng/mL) (p = 0.002, log rank). Six (75%) of 8 patients whose TB progressed were female patients with vitamin D
Emerging Infectious Diseases • www.cdc.gov/eid • Vol. 16, No. 5, May 2010
853
DISPATCHES
Figure 1. Levels of vitamin D in plasma in the Karachi, Pakistan, tuberculosis (TB) household cohort (7) by TB status at baseline (diseasefree, index TB case-patient, coprevalent TB case-patient, and past TB case-patient, treated 2–10 years previously). One disease-free contact was excluded because of an indeterminate test result. Box plots show the median, 25th, and 75th quartiles of serum vitamin D estimated for each group (A) by any TB diagnosis (current or past) at baseline (B) and by sex (C). Reference lines represent cut-offs for insufficient and sufficient vitamin D levels, respectively. The Mann-Whitney U test was used for comparison of medians.
levels in the lowest tertile. Further adjustment for age and sex yielded a relative risk for progression of 5.1 (1.2–21.3, p = 0.03) for a relative 1-log decrement in vitamin D levels, which suggests that vitamin D deficiency might be a strong risk factor for TB disease. Conclusion In this cohort follow-up study from Pakistan, low vitamin D levels were associated with progression to active TB disease in healthy household contacts. No deaths occurred during the follow-up period from either TB or unrelated causes. Our findings also suggest that vitamin D deficiency may explain the higher susceptibility of women to disease progression in our cohort. A high prevalence of vitamin D deficiency in female patients also was reported in ambulatory patients at Aga Khan University (8). Factors such as low socioeconomic status, poor nutrition, traditional/ cultural traits, and little exposure to sunlight may further explain vitamin D deficiency in female patients in this cohort. Despite several limitations to our study, such as infor-
mation about diet, body mass index, exposure to sunlight and the relatively small number of study participants, our results are supported by a meta-analysis of 7 case-control studies in different ethnic populations (including an Indian population) that showed 70% of healthy controls had higher vitamin D levels than did untreated TB patients (3). Previously in African immigrants in Melbourne, Victoria, Australia (9), lower mean vitamin D levels were associated with high probability of latent, current, or past TB infection. Cross-sectional studies are needed in Pakistan to appreciate this association with sex and susceptibility to TB with larger sample size. Most of the South Asian population, including Pakistani immigrants to European countries and South Indians, had 30 ng/mL provide an adequate substrate for
Table. Prevalence of vitamin D deficiency in a cohort study of household contacts of tuberculosis patients, Karachi, Pakistan* Baseline characteristic Total, no. (%) Deficient, no. (%) Insufficient, no. (%) Sufficient, no. (%) p value Age group, y 6–17 44 (34) 38 (86) 4 (9) 2 (5) 0.13 >18 84 (66) 63 (75) 14 (17) 7 (8) Sex Male 54 (42) 35 (65) 12 (22) 7 (13) 0.003 Female 74 (58) 66 (89) 6 (8) 2 (3) Tuberculin skin test >10 mm 101 (79) 81 (80) 14 (14) 6 (6) 0.49