Microsoft Hyper-V. : VMware vSphere vs. When we combine the operational cost
savings VMware vSphere provides with the capital expenses the VMware ...
TOTAL COST COMPARISON SUMMARY: VMWARE VSPHERE VS. MICROSOFT HYPER-V
Total cost of ownership (TCO) is the ultimate measure to compare IT infrastructure platforms, as it incorporates the purchase and support costs of the platform along with ongoing operational and management expenses. The operational efficiency built into your software stack can greatly affect your bottom line—once you have procured and implemented your platform, operational costs for administration and maintenance can easily balloon. A solution that streamlines and automates routine maintenance tasks can increase uptime and save an organization time and money. In this study, we use results from the VMware Cost-Per-Application calculator and examine the operational expenses of the two platforms using five scenarios to provide a hypothetical TCO comparison. In our labs at Principled Technologies, we compared the automated administration capabilities of two common virtualization platforms, VMware vSphere® 5 and Microsoft Windows Server® 2008 R2 SP1 Hyper-V™, in several scenarios. It took significantly less time to complete common administrative tasks with the VMware solution, potentially reducing post-acquisition operational expense costs in the five operational tasks we tested by as much as 91 percent over a two-year period compared to the Microsoft solution.
APRIL 2012
A PRINCIPLED TECHNOLOGIES TEST REPORT Commissioned by VMware, Inc.
When we combine the operational cost savings VMware vSphere provides with the capital expenses the VMware Cost-Per-Application calculator predicts, we find that VMware virtualization platforms can provide substantially lower two-year total cost of ownership compared to Microsoft platforms.
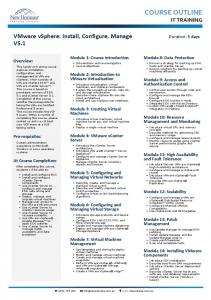
Two-year evaluated operating expenses $45,000 $40,000
$35,000
Figure 1: In the operational scenarios we tested, VMware had 91 percent lower operational costs over a two-year period.
$30,000 $25,000
$20,000 $15,000
91% lower operational costs with VMware vSphere
$10,000 $5,000
$0
Microsoft
VMware
SELECTING A COMPLETE SOLUTION When choosing a virtualization platform, considering all costs—both acquisitionrelated and operational—is essential. An organization must account for not only the cost of acquiring licenses and software, but also the cost associated with the time a system administrator will devote to maintenance and management tasks within each environment. Since system administrator time can be more valuable when used on strategic IT initiatives that deliver a competitive edge for their organization instead of routine maintenance, it is always beneficial to reduce operational administrative costs. As these operational costs add up over time, they can become a significant portion of overall costs for a data center. We discuss our full approach and methodology in the full report “Total cost comparison: VMware vSphere vs. Microsoft Hyper-V” available at http://www.principledtechnologies.com/clients/reports/VMware/vSphere_HyperV_TCO_0412.pdf. For acquisition cost estimates, we used the VMware Virtualization Cost-PerApplication Calculator on VMware’s Web site at http://www.vmware.com/technology/whyvmware/calculator/.
Total cost comparison summary: VMware vSphere vs. Microsoft Hyper-V : VMware vSphere vs.
A Principled Technologies test report 2
Acquisition costs As verified by Principled Technologies’ 2011 testing,1 VMware vSphere offers significant advantages that can lead to higher VM density than Microsoft Hyper-V. Higher VM density translates directly to reduced capital costs for a virtualization platform because the customer needs fewer hypervisor hosts and management servers to support a population of virtualized applications. The VMware Cost-Per-Application calculator factors the vSphere VM density advantage into comparisons with solutions based on Microsoft Hyper-V and System Center to show that at higher VM densities, VMware can provide acquisition costs lower than that of Microsoft for hardware, software, management components, data center space, and power and cooling. For specifics on the acquisition costs we use in this summary, see the full report.2
Management and maintenance scenario summary To test the management and maintenance functionality for each platform, we chose a number of representative operational tasks that a large organization would carry out throughout the course of a typical two-year period. These scenarios include the following:
Shifting virtual machine workloads for host maintenance
Adding new volumes and redistributing VM storage
Isolating a storage-intensive “noisy neighbor” VM
Provisioning new hosts
Performing non-disruptive disaster recovery testing
After timing each scenario, we estimated how many times IT staff would complete each of these routine maintenance tasks during a typical two-year period, using an example data center of 1,000 VMs. The default output from the VMware CostPer-Application calculator assumes a density advantage of 50 percent more VMs for VMware over Microsoft, but we chose a more conservative estimate of 25 percent and used those VM densities as guidelines in our pricing estimates. Therefore, for acquisition cost purposes, we estimated 15 VMs per VMware vSphere server and 12 VMs per Microsoft Hyper-V server. Using our density approximations, time estimates, and the number of iterations for each task, we then calculated person-hours and the cost of those person-hours using standard IT salary and benefits rates to determine the administrative savings an organization could realize using VMware vSphere. Using the representative tasks and scenarios we chose, the VMware solution could save $37,540 in management costs over a two-year period compared to a comparable solution from Microsoft. (See Figure 2). 1 2
http://www.principledtechnologies.com/clients/reports/VMware/vsphere5density0811.pdf http://www.principledtechnologies.com/clients/reports/VMware/vSphere_Hyper-V_TCO_0412.pdf
Total cost comparison summary: VMware vSphere vs. Microsoft Hyper-V : VMware vSphere vs.
A Principled Technologies test report 3
$40,000
Cumulative savings over two years using the VMware solution Performing nondisruptive disaster recovery testing
$35,000
Figure 2: Using VMware products can lower your operational cost by as much as $37,540 over the course of a two-year period compared to comparable Microsoft offerings.
US dollars
$30,000
Provisioning new hosts
$25,000
$20,000
Isolating a storageintensive VM
$15,000 Adding new volumes and redistributing VM storage
$10,000
$5,000
$0 Jan Mar May Jul
Sep Nov Jan Mar May Jul
Sep Nov
Shifting virtual machine workloads for host maintenance
Scenario results overview For each hands-on scenario, we setup a test environment to simulate each situation in full detail. We briefly review the scenarios below, and the steps we took in each case to take our measurements. For full details on each scenario, including detailed methodologies, see the full report.3
Scenario 1: Shifting virtual machine workloads for host maintenance In this scenario, we configured servers, storage, and networking in each environment, ran a real world database workload against our VMs and live migrated VMs using each solution’s maintenance feature. We measured the time it took for VMs to migrate off the maintenance host.
Scenario 2: Adding new volumes and redistributing VM storage In this scenario, we configured servers, storage, and networking to simulate a storage migration in each environment; for VMware we used Storage DRS and for Microsoft we used Quick Storage Migration. We measured the time it took to initiate the migration in addition to any administrator planning time necessary.
3
Scenario 3: Isolating a storage-intensive “noisy neighbor” VM
http://www.principledtechnologies.com/clients/reports/VMware/vSphere_Hyper-V_TCO_0412.pdf
Total cost comparison summary: VMware vSphere vs. Microsoft Hyper-V : VMware vSphere vs.
A Principled Technologies test report 4
In this scenario, we isolated a storage-intensive VM on VMware by using Storage I/O Control and on Microsoft by adding additional hardware. We measured the time involved for each.
Scenario 4: Provisioning new hosts In this scenario, we measured the administrator time involved in provisioning new hosts using both VMware AutoDeploy and Microsoft SCCM.
Scenario 5: Performing non-disruptive disaster recovery testing In this scenario, we measured the administrator time involved in performing a non-disruptive, fully functional disaster recovery test using VMware Site Recovery Manager and a manual procedure with Microsoft.
We show the results of our hands-on time measurements below, normalizing the results to 100 percent of Microsoft’s time for each scenario. VMware produced a significant time savings advantage in each scenario, ranging from 61 percent to 91 percent faster than Microsoft.
VMware advantage by scenario, normalized Scenario 1
Scenario 2
Figure 3: VMware time savings advantage for each of the five management scenarios.
Microsoft VMware
Scenario 3
Scenario 4
Scenario 5 0
Total cost comparison summary: VMware vSphere vs. Microsoft Hyper-V : VMware vSphere vs.
0.2
0.4
0.6
0.8
1
A Principled Technologies test report 5
IN CONCLUSION We calculated the operational costs using the time measurements from each scenario, and factored in the acquisition costs for each environment. After doing so, we calculated the two-year ownership cost for each solution and calculated that VMware had a lower two-year TCO than that of Microsoft. Managing a virtualized infrastructure that runs continuously inevitably requires some degree of maintenance from IT staff. Any time that can be saved when performing routine maintenance tasks through system automation and capable management features frees IT staff to concentrate on ways to help your business grow. In the scenarios we tested, using the VMware solution had the potential to reduce operational expenses by as much as 91 percent compared to using similar offerings from Microsoft. When we added the expected operational efficiency cost savings to the hardware acquisition estimates provided by the VMware Cost-Per-Application Calculator, we found that the VMware solution could provide a lower total cost of ownership over two years compared to the Microsoft solution. For specific details on the methodologies used for both the hand on testing and the cost comparison, please see the full report.4
4
http://www.principledtechnologies.com/clients/reports/VMware/vSphere_Hyper-V_TCO_0412.pdf
Total cost comparison summary: VMware vSphere vs. Microsoft Hyper-V : VMware vSphere vs.
A Principled Technologies test report 6
ABOUT PRINCIPLED TECHNOLOGIES We provide industry-leading technology assessment and fact-based marketing services. We bring to every assignment extensive experience with and expertise in all aspects of technology testing and analysis, from researching new technologies, to developing new methodologies, to testing with existing and new tools. Principled Technologies, Inc. 1007 Slater Road, Suite 300 Durham, NC, 27703 www.principledtechnologies.com
When the assessment is complete, we know how to present the results to a broad range of target audiences. We provide our clients with the materials they need, from market-focused data to use in their own collateral to custom sales aids, such as test reports, performance assessments, and white papers. Every document reflects the results of our trusted independent analysis. We provide customized services that focus on our clients’ individual requirements. Whether the technology involves hardware, software, Web sites, or services, we offer the experience, expertise, and tools to help our clients assess how it will fare against its competition, its performance, its market readiness, and its quality and reliability. Our founders, Mark L. Van Name and Bill Catchings, have worked together in technology assessment for over 20 years. As journalists, they published over a thousand articles on a wide array of technology subjects. They created and led the Ziff-Davis Benchmark Operation, which developed such industry-standard benchmarks as Ziff Davis Media’s Winstone and WebBench. They founded and led eTesting Labs, and after the acquisition of that company by Lionbridge Technologies were the head and CTO of VeriTest.
Principled Technologies is a registered trademark of Principled Technologies, Inc. All other product names are the trademarks of their respective owners. Disclaimer of Warranties; Limitation of Liability: PRINCIPLED TECHNOLOGIES, INC. HAS MADE REASONABLE EFFORTS TO ENSURE THE ACCURACY AND VALIDITY OF ITS TESTING, HOWEVER, PRINCIPLED TECHNOLOGIES, INC. SPECIFICALLY DISCLAIMS ANY WARRANTY, EXPRESSED OR IMPLIED, RELATING TO THE TEST RESULTS AND ANALYSIS, THEIR ACCURACY, COMPLETENESS OR QUALITY, INCLUDING ANY IMPLIED WARRANTY OF FITNESS FOR ANY PARTICULAR PURPOSE. ALL PERSONS OR ENTITIES RELYING ON THE RESULTS OF ANY TESTING DO SO AT THEIR OWN RISK, AND AGREE THAT PRINCIPLED TECHNOLOGIES, INC., ITS EMPLOYEES AND ITS SUBCONTRACTORS SHALL HAVE NO LIABILITY WHATSOEVER FROM ANY CLAIM OF LOSS OR DAMAGE ON ACCOUNT OF ANY ALLEGED ERROR OR DEFECT IN ANY TESTING PROCEDURE OR RESULT. IN NO EVENT SHALL PRINCIPLED TECHNOLOGIES, INC. BE LIABLE FOR INDIRECT, SPECIAL, INCIDENTAL, OR CONSEQUENTIAL DAMAGES IN CONNECTION WITH ITS TESTING, EVEN IF ADVISED OF THE POSSIBILITY OF SUCH DAMAGES. IN NO EVENT SHALL PRINCIPLED TECHNOLOGIES, INC.’S LIABILITY, INCLUDING FOR DIRECT DAMAGES, EXCEED THE AMOUNTS PAID IN CONNECTION WITH PRINCIPLED TECHNOLOGIES, INC.’S TESTING. CUSTOMER’S SOLE AND EXCLUSIVE REMEDIES ARE AS SET FORTH HEREIN.
Total cost comparison summary: VMware vSphere vs. Microsoft Hyper-V : VMware vSphere vs.
A Principled Technologies test report 7