VOICE SOURCE FEATURES FOR COGNITIVE LOAD CLASSIFICATION Tet Fei Yap1,2 , Julien Epps1,2 , Eliathamby Ambikairajah1,2 , Eric H. C. Choi2 1
School of Electrical Engineering and Telecommunications, The University of New South Wales, Sydney, NSW 2052, Australia 2 ATP Research Laboratory, National ICT Australia (NICTA), Eveleigh 2015, Australia
[email protected],
[email protected],
[email protected],
[email protected] ABSTRACT Previous work in speech-based cognitive load classification has shown that the glottal source contains important information for cognitive load discrimination. However, the reliability of glottal flow features depends on the accuracy of the glottal flow estimation, which is a non-trivial process. In this paper, we propose the use of acoustic voice source features extracted directly from the speech spectrum (or cepstrum) for cognitive load classification. We also propose preand post-processing techniques to improve the estimation of the cepstral peak prominence (CPP). 3-class classification results on two databases showed CPP as a promising cognitive load classification feature that outperforms glottal flow features. Score-level fusion of the CPP-based classification system with a formant frequency-based system yielded a final improved accuracy of 62.7%, suggesting that CPP contains useful voice source information that complements the information captured by vocal tract features. Index Terms— cognitive load, voice source features, GMM classification, voice quality 1. INTRODUCTION Cognitive load is a psychological construct that relates to the load imposed on a person’s cognitive system while he/she is performing a task [1]. A person working on a high cognitive load task will have to expend more mental effort to complete the task. Hence, cognitive load measurement systems can be useful for monitoring and reducing the mental effort necessary to complete a task. Some applications that might benefit from such systems include call centers and traffic control management centers. In 2008, Yin et al. proposed a fully automatic speechbased cognitive load classification system, which employs mel-frequency cepstral coefficients (MFCCs) and prosodic features as its front-end features [2]. In our previous work, glottal-based information was found to provide complementary information useful for cognitive load classification [3]. Additionally, preliminary findings suggested that speech spoken under high cognitive load has a less breathy voice qual-
978-1-4577-0539-7/11/$26.00 ©2011 IEEE
ity [3] . Nevertheless, one limitation of our previous work is that the study was performed on parameters extracted from the glottal flow waveform estimated from speech. Glottal flow estimation from speech is a blind-deconvolution problem, which is non-trivial. Moreover, glottal flow parameter extraction can be difficult, due to noise in the glottal flow estimate and the gradual opening of the vocal folds [4]. To overcome the above-mentioned problem, we propose the use of acoustic measures to capture the voice source information. These acoustic measures are derived from the speech spectrum (or cepstrum), and do not require the explicit estimation of the glottal flow. Various acoustic measures, such as cepstral peak prominence and harmonic amplitude differences, are known to correlate with the underlying glottal configuration [5]. Additionally, harmonic-to-noise ratio has also been used for emotion recognition [6]. In this work, we selected 3 features that capture voice source information: cepstral peak prominence (CPP), harmonicto-noise ratio (HNR) and the corrected difference of the first two harmonics (H1*-H2*). We then proposed pre- and postprocessing techniques to improve the CPP estimates. The features were then applied as front-end features in our cognitive load classification system. 2. VOICE SOURCE FEATURES 2.1. Cepstral peak prominence (CPP) CPP is a cepstrum-based parameter that correlates well with breathy speech [5]. Assuming the source-filter model of speech, a windowed speech signal sw [n] can be modeled as sw [n] = h[n] ∗ uw [n] where h[n] is the vocal tract response and uw [n] is the source excitation. By taking the discrete Fourier transform (DFT) of the signal and calculating the logarithm of the magnitude response, we obtain log |Sw [k]| = log |H[k]| + log |Uw [k]|. The cepstrum cw [n] can then be obtained by taking the inverse DFT of log |Sw [k]|. The cepstrum will contain a peak located at quefrency that corresponds to the pitch period of the particular frame. The location of this cepstral peak p0 can be obtained by finding the location of the maximum peak from
5700
ICASSP 2011
20
CPP Values 35
0
Identified peak
30 CPP
Peak at pitch period
Cepstrum cw[n]
−20
−40
25 20 15 10
−60
0
50
100
150
200
150
200
Log Energy Values
−80
4 Log energy
−100
−120
−140
0
5
10
15 Quefrency (ms)
20
25
−2 −4
quefrency of 1 ms to maximum quefrency N ms n∈[1,N ]
0
30
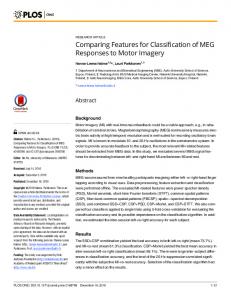
Fig. 1: CPP calculation on the cepstrum of a voiced speech frame
p0 = argmax cw [n]
2
(1)
CPP, described in [5], can hence be expressed mathematically as CP P = cw [p0 ] − cˆw [p0 ] (2) where cˆw [n] represents the estimated cepstral value obtained by fitting a regression line from quefrency 1 ms to N ms cˆw [n] = an + b, n ∈ [1, N ]. 2.2. Dependency of CPP on the degree of voicing The CPP estimates were found to be significantly affected by the degree of voicing in speech frames. Although a pitchbased voice activity detector (VAD) was used, we proposed additional pre- and post-processing techniques to improve the CPP estimates, based on two observations. Our first observation relates to the case in which the cepstral peak is wrongly identified, as shown in Figure 1. This happens when a peak at lower quefrency has slightly higher amplitude compared with the peak located at the pitch period. Hence, the post-processing technique that we proposed involves discarding CPP feature frames wherein the identified cepstral peak quefrency p0 differs from the pitch period T0 by more than T0 /2; i.e., |p0 − T0 | > T20 . T0 can be estimated using a pitch estimation algorithm. This modified CPP parameter will henceforth be referred to as CPPp . Our second observation relates to the relationship between the short-time frame energy and the CPP values. Figure 2 shows the short-time log energy of consecutive frames and their corresponding CPP values. Although preliminary results indicated weak correlation between the two variables, Figure 2 shows that CPP values are low when short-time log energy values are low. These low energy frames most likely correspond to unvoiced frames that are not removed by the pitchbased VAD. These frames are less periodic, hence causing the
5701
0
50
100 Frame Number
Fig. 2: CPP (top) and short-time log energy (bottom) for consecutive frames low CPP values. Including CPP values from these frames will increase the variability of the feature distribution, which may reduce the discrimination ability of CPP. Hence, the pre-processing technique that we proposed involves calculating the CPP value for the i-th speech frame only when the average short-time energy Ei is above a certain energy threshold Ethr = 0.05 {max(Ei ) − min(Ei )}; i.e., Ei > Ethr . We refer to this CPP parameter as CPPe . The CPP parameter obtained by performing the pitch period checking post-processing and the energy thresholding pre-processing will henceforth be referred to as CPPpe . 2.3. Harmonic-to-noise ratio (HNR) HNR is a measure of the relative level of spectral noise present in speech. A low HNR value indicates higher level of spectral noise, and hence a more breathy voice quality. HNR can be calculated using a cepstrum-based technique [7], which is implemented in the VoiceSauce toolkit [8]. 2.4. Corrected difference of the first two harmonic amplitudes (H1*-H2*) Although changes in the difference of the first two harmonic amplitudes (H1-H2) can be related to changes in the glottal source, the harmonic amplitudes of different sounds are affected differently by the vocal tract. The effects of the vocal tract resonances can be removed by applying a correction formula [9] to the harmonic amplitudes. The difference of the first two harmonic amplitudes after applying the correction formula is denoted by H1*-H2*. 3. EXPERIMENTAL SETUP 3 different databases (detailed description in [2]) were used in this work. The Stroop test database contains 161 utterances (average duration of 16 s) from 16 native English speakers, either reading words corresponding to color names or
naming the font colors of the words. 3 cognitive load levels were induced by introducing a mismatch between the color words and the font colors, and also by imposing a time limit for task completion. The reading-comprehension database, on the other hand, contains 135 utterances (average duration of 32 s) of 15 native English speakers reading aloud passages and answering open-ended comprehension questions. 3 cognitive load levels were induced by increasing the difficulty level of the text passages, and by introducing an additional secondary task. Lastly, participants from the Stroop test database also recorded a separate 90 s story reading task. This story reading database was used primarily for background model training purposes. The VoiceSauce toolkit [8] was used to extract CPP, HNR and H1*-H2* features from voiced speech, every 10 ms. Three different HNR features were extracted: HNR5, HNR15 and HNR25, which correspond to HNR calculated for the frequency band 0-500 Hz, 0-1500 Hz and 0-2500 Hz. CPPp and CPPpe were extracted by applying the procedures described in Section 2.2. Analysis window lengths were 3 pitch periods for H1*-H2* and 5 pitch periods for CPP-based and HNRbased features. Voicing decisions and pitch periods were determined using the Praat software [10]. Interspeaker variability in the voice source features, such as gender differences, was removed using speaker specific feature warping [11]. The confidence intervals of the normalized feature means were then plotted to determine the separability of the features across different cognitive load level. Similar to [3], leave-one-speaker-out cross-validation was performed with a GMM classifier. A 32 Gaussian mixtures universal background model (UBM) was trained on the story reading database. Its mean vectors were then adapted, towards cognitive load level-specific data from the Stroop test or reading-comprehension database, using maximum a posteriori (MAP) adaptation. Finally, linear combination score-level fusion was performed to determine whether voice source features contain the expected complementary information with respect to vocal tract features. 4. RESULTS AND DISCUSSIONS 4.1. Distribution of feature means Figure 3 shows the means and 95% confidence intervals of the normalized voice source features CPPpe , HNR25 and H1*-H2*. The figure indicates that the CPPpe means are quite well-separated across different cognitive load levels. Additionally, the mean values are increasing as cognitive load is increasing, which suggests that speech becomes less breathy as cognitive load increases. This is consistent with the preliminary findings reported in [3]. A similar observation can be made for H1*-H2*; the decreasing trend as cognitive load increases suggests less breathy speech. No reliable trend can be observed from
5702
0.4
HNR25
CPP
pe
H1*−H2*
0.3
0.2
0.1
0
−0.1
−0.2
−0.3
−0.4
Low
Medium
High
Low
Medium
High
Low
Medium
High
Fig. 3: Confidence intervals of the voice source feature means Table 1: Average 3-class classification accuracy of individual features and fused classification systems, evaluated on the Stroop test and reading-comprehension databases. Feature
Stroop test
Readingcomprehension H1*-H2* 33.0 32.6 HNR5 34.7 39.3 HNR15 34.3 36.3 HNR25 36.8 31.9 CPP 42.8 42.2 CPPp 50.9 43.7 CPPpe 52.2 45.2 {F1, F2, F3} 55.2 48.9 Fusion with {F1, F2, F3} CPP 57.1 54.1 CPPp 51.5 56.3 CPPpe 62.7 57.8 the HNR feature distribution, since its confidence intervals overlap significantly across different cognitive load levels. 4.2. Voice source feature classification results The upper portion of Table 1 shows the average 3-class classification accuracy of different voice source features when evaluated on two different databases: the Stroop test database and the reading-comprehension database. The results reported are largely consistent with the observations made in Section 4.1. H1*-H2* performed around chance level for both databases. This might be due to the need for accurate pitch estimates to locate the harmonic peaks, and also accurate formant estimates to correct for the vocal tract effect. Similar reasoning can be used to explain the poor performance of the HNR features, since accurate pitch estimates are required to locate the harmonic regions. HNR and H1*-H2* seem to be more suited for studies, where the pitch estimation errors can be manually corrected. On the other hand, although pitch period estimates are
also required in the CPP calculation, CPP performed significantly better than HNR and H1*-H2*. This suggests that CPP is more robust to pitch estimation errors. Nevertheless, the classification result of CPPp shows that CPP performance can be improved by applying post-processing to remove frames where cepstral peaks differed significantly from the estimated pitch period. The classification accuracy improved further when we performed an additional pre-processing in the form of energy thresholding (CPPpe ). By performing these two techniques, classification accuracy increased by an absolute percentage of 9.4% for the Stroop test database, and 3% for the reading-comprehension database. We tried applying the energy thresholding technique on other features as well. But, apart from H1*-H2*, for which classification performance on the Stroop test database improved from 33% to 42.3%, no significant improvement was obtained in all other cases. This might be because errors introduced by the pitch estimation were more dominant compared with errors introduced by the aperiodicity in speech. The Stroop test classification results reported here are directly comparable to the results reported in [3], wherein the best result for glottal flow features was 38.2%. Compared with the 52.2% accuracy achieved by CPPpe , this further confirms CPP as a promising feature for capturing glottal information, without the need for glottal flow estimation. 4.3. Score-level fusion classification results In order to investigate the complementary nature between vocal tract and voice source features, classification systems employing the two different types of features were fused together using linear combination score-level fusion. The chosen vocal tract features were the first three formant frequencies {F1, F2, F3}, which were shown to be effective, low dimensional, features for cognitive load classification [12]. The chosen voice source features were CPP-based features. Due to their poor individual classification performances, H1*-H2* and HNR were not considered for fusion. The lower portion of Table 1 shows the classification results of the fused system. Apart from classification result of CPPp evaluated on the Stroop test database, all other results show that fusion improved the overall classification performance. Fusion of CPPpe system with the {F1, F2, F3}-based system recorded the largest improvement over {F1, F2, F3} without fusion; accuracy improved by 7.5% and 8.9%, in absolute terms, for the Stroop test database and reading-comprehension database respectively. Additionally, when score-level fusion was applied to systems based on CPPpe and {F1, F2, F3} with deltas (best performing features in [12]), accuracy improved from 51.9% to 59.3% for the reading-comprehension database. These results imply that significantly better cognitive load classification can be achieved by considering information from both the vocal tract and the voice source.
5703
5. CONCLUSION This paper has studied the use of spectral and cepstral-based voice source features for cognitive load classification. Classification results have shown CPP to be a more effective voice source feature, as compared with glottal flow-based features. Additionally, applying the proposed pre- and post-processing method on CPP feature extraction yielded a 9.4% absolute increase in classification accuracy for the Stroop test database. When CPPpe was fused with the vocal tract-based formant frequency features at the score-level, performance improved by as much as 8.9% in absolute terms. This suggests the complementary nature of both vocal tract and voice source features. Future work includes a detailed study of the changes in voice quality due to the effect of cognitive load. 6. REFERENCES [1] F. Paas, J. E. Tuovinen, H. Tabbers, and P. W. M. Van Gerven, “Cognitive load measurement as a means to advance cognitive load theory,” Educational Psychologist, vol. 38, no. 1, pp. 63– 71, 2003. [2] B. Yin, F. Chen, N. Ruiz, and E. Ambikairajah, “Speech-based cognitive load monitoring system,” in Proceedings of ICASSP, 2008, pp. 2041–2044. [3] T. F. Yap, J. Epps, E. H. C. Choi, and E. Ambikairajah, “Glottal features for speech-based cognitive load classification,” in Proceedings of ICASSP, 2010, pp. 5234–5237. [4] P. Alku, T. Bäckström, and E. Vilkman, “Normalized amplitude quotient for parametrization of the glottal flow,” The Journal of the Acoustical Society of America, vol. 112, no. 2, pp. 701–710, 2002. [5] J. Hillenbrand and R. A. Houde, “Acoustic correlates of breathy vocal quality: Dysphonic voices and continuous speech,” Journal of Speech and Hearing Research, vol. 39, no. 2, pp. 311–321, 1996. [6] B. Schuller, S. Steidl, and A. Batliner, “The INTERSPEECH 2009 emotion challenge,” in Proceedings of Interspeech, 2009, pp. 312–315. [7] G. Krom, “A cepstrum-based technique for determining a harmonics-to-noise ratio in speech signals,” Journal of Speech and Hearing Research, vol. 36, no. 2, pp. 254–266, 1993. [8] Y.-L. Shue, “Voicesauce: a program for voice analysis,” 2010, http://www.ee.ucla.edu/~spapl/voicesauce. [9] M. Iseli and A. Alwan, “An improved correction formula for the estimation of harmonic magnitudes and its application to open quotient estimation,” in Proceedings of ICASSP, 2004, vol. 1, pp. 669–672. [10] P. Boersma, “Praat, a system for doing phonetics by computer.,” Glot International, vol. 5, no. 9/10, pp. 341–345, 2001. [11] V. Sethu, E. Ambikairajah, and J. Epps, “Speaker normalisation for speech-based emotion detection,” in Proceedings of International Conference on Digital Signal Processing, 2007, pp. 611–614. [12] T. F. Yap, J. Epps, E. Ambikairajah, and E. H. C. Choi, “An investigation of formant frequencies for cognitive load classification,” in Proceedings of Interspeech, 2010, pp. 2022–2025.