Volunteer stream monitoring: Do the data quality and monitoring experience .... analyses of existing data, thus unable to analyze pairwise differences between ...
Copyright © 2016 by the author(s). Published here under license by the Resilience Alliance. Storey, R. G., A. Wright-Stow, E. Kin, R. Davies-Colley, and R. Stott. 2016. Volunteer stream monitoring: Do the data quality and monitoring experience support increased community involvement in freshwater decision making? Ecology and Society 21(4):32. https://doi.org/10.5751/ES-08934-210432 https://doi.org/10.5751/ES-08934-210432
Research, part of a Special Feature on Sustainably Managing Freshwater Resources
Volunteer stream monitoring: Do the data quality and monitoring experience support increased community involvement in freshwater decision making? Richard G. Storey 1, Aslan Wright-Stow 1, Elsemieke Kin 2, Robert J. Davies-Colley 1 and Rebecca Stott 1 ABSTRACT. Recent freshwater policy reforms in New Zealand promote increased community involvement in freshwater decision making and management. Involving community members in scientific monitoring increases both their knowledge and their ability to discuss this knowledge with professionals, potentially increasing their influence in decision-making processes. However, these interactions rarely occur because, in particular, of perceptions that volunteer-collected data are unreliable. We assessed the agreement between volunteer (community group) and local government (regional council) data at nine stream sites across New Zealand. Over 18 months, community groups and regional council staff monitored, in parallel, a common set of water quality variables, physical habitat, periphyton and benthic macroinvertebrates that are routinely used by regional councils for statutory state of environment reporting. Community groups achieved close agreement (correlations ≥ 0.89, bias < 1%) with regional councils for temperature, electrical conductivity, visual water clarity, and Escherichia coli. For dissolved oxygen, nitrate, and pH, correlations were weaker (0.2, 0.53, and 0.4, respectively). Volunteer assessments of physical habitat were as consistent over time as those of councils. For visual assessments of thick periphyton growths (% streambed cover), volunteers achieved a correlation of 0.93 and bias of 0.1% relative to councils. And for a macroinvertebrate biotic index that indicates water and habitat quality, correlation was 0.88, bias was < 5%, and the average difference was 12% of the index score. Volunteers showed increased awareness of local freshwaters, understanding of stream ecosystems, and attentiveness to local and national freshwater issues. Most volunteers had shared their knowledge and interest with others in their community. Most groups had developed relationships with their regional council, and some volunteers became more interested in engaging in freshwater decision making. Given adequate professional support, community-based water monitoring can provide data reliable enough to augment professionally collected data, and increase the opportunities, confidence, and skills of community members to engage in freshwater decision making. Key Words: citizen science; collaborative governance; community-based monitoring; freshwater; macroinvertebrates; participatory processes; resource management; streams; volunteer monitoring; water quality INTRODUCTION Globally there is increasing recognition that decision making for complex environmental issues must involve community stakeholders for the solutions to be appropriate and widely accepted (United Nations 1993, Bradshaw 2003, Wismer and Mitchell 2005, Land and Water Forum 2012). Consistent with global trends, freshwater decision making and management in New Zealand increasingly involve active participation by local communities, enabled by increased emphasis on collaborative decision making in the government’s National Policy Statement for Freshwater Management (NPS-FM; MfE 2014). Public participation in ecological monitoring, a form of citizen science, has increased greatly around the world in the past two decades (Silvertown 2009, Dickinson et al. 2012, Bonney et al. 2014, Huddart et al. 2016) and is widespread in New Zealand (Peters et al. 2015a). One of the reasons for this growth is the need for greater data coverage in environmental research and management, and the potential for volunteers to collect vastly more data than government agencies and professional researchers can (e.g., Fore et al. 2001, Whitelaw et al. 2003, Sharpe and Conrad 2006, Morin 2009, Dickinson et al. 2012). In New Zealand, the need for spatially detailed data has increased with the shift to collaborative freshwater planning processes (G. Sevicke-Jones, Environment Southland, personal communication). Globally, there are few examples of government agencies regularly using volunteer data alongside professional data for official
1
reporting and management (Hunsberger 2004, Sharpe and Conrad 2006, Dyer et al. 2014, Buckland-Nicks 2015; but note exceptions in Nerbonne and Vondracek 2003, Nerbonne et al. 2008, Latimore and Steen 2014). In New Zealand, although a majority of community environmental groups report sharing their monitoring data with project partners in government or science institutes (Peters et al. 2015b), institutional systems for using volunteer data are lacking (Peters et al. 2015b). This lack of integration is due to several factors, in particular, doubts about the reliability of volunteer-collected data (Whitelaw et al. 2003, Hunsberger 2004, Gollan et al. 2012, Bonney et al. 2014). In New Zealand, such doubts among decision makers result in a lack of council support to maximize data quality and lend credibility to community monitoring, while doubts among volunteers reduce their motivation to continue collecting data (Peters et al. 2015b). Providing evidence that community-based monitoring data can be reliable, therefore, would address a critical barrier to successful integration of community-based monitoring in decision making. A number of previous studies have assessed the reliability of stream monitoring by volunteers in relation to professionals (Reynoldson et al. 1986, Penrose and Call 1995, Au et al. 2000, Fore et al. 2001, Engel and Voshell 2002, Nicholson et al. 2002, Nerbonne and Vondracek 2003, Sharpe and Conrad 2006, Gowan et al. 2007, Loperfido et al. 2010, Shelton 2013, Coates 2013, Moffett and Neale 2015). Most have concluded that, with appropriate resourcing and robust protocols, volunteer data agree closely enough with professional data for use in government
National Institute of Water and Atmospheric Research, 2Wageningen University
Ecology and Society 21(4): 32 http://www.ecologyandsociety.org/vol21/iss4/art32/
Table 1. Characteristics of sites, group composition, and data. Sites 3a and 3b were monitored by the same group, as were sites 4a and 4b (site a for invertebrates, site b for water quality). Values in final two columns refer to no. of samples collected and (in parentheses) number used in analyses. Site code
Region
Main catchment land use
Stream order
Catchment area (km²)
No. of members in group
No. of members sampling/day
Age of most members
No. of water samples
No. of invertebrate/ habitat assessments
1 2 3a 3b 4a 4b 5
Auckland Auckland Waikato Waikato Gisborne Gisborne Wellington
3 3 3 3 2 5 5
12.6 19.0 11.7 5.5 3.2 210.2 140.1
9
3 to 4
18(16) 8(8)
10 10 9 9 8
3 to 4 3 to 4 3 to 4 3 to 4 2 to 4
20-40, >60 40-60, 60 40-60, >60 20-40, 40-60 20-40, 40-60 >60
4(3) 3(3) 4(4)
10(8) 14(13)
4(4)
6 7 8 9
Wellington Wellington Nelson Nelson
urban urban/rural rural rural native forest rural rural/native forest rural urban urban/forest exotic forest
4 2 4 3
118.6 2.7 90.1 14.2
7 7 5 3
2 to 4 4 to 5 3 to 5 1 to 3
40 to 60 >60 >60 40 to 60
17(15) 18(17) 13(2) 4(0)
4(4) 4(4) 4(4) 3(0)
reporting and decision making. However, previous studies have tended to focus on a narrow range of monitoring variables, in particular macroinvertebrates, and/or have been post-hoc analyses of existing data, thus unable to analyze pairwise differences between volunteer and professional measurements. Few have used a parallel monitoring design that includes periphyton, physical habitat, or the faecal indicator bacteria Escherichia coli, which are core reporting variables strongly linked with public values such as suitability for recreation, aesthetics, and natural character. Involving community members in monitoring increases not only their ability to contribute data, but also their ability to discuss their knowledge with experts (described as “interactional expertise” by Carolan 2006). Community members participating in environmental monitoring also commonly show increased scientific literacy, greater awareness of local ecosystems and wider environmental issues, stronger social networks including relationships with local government, and greater interest in freshwater planning (Bliss et al. 2001, Savan et al. 2003, Overdevest et al. 2004, Pollock and Whitelaw 2005, Stepenuck and Green 2015, Peters et al. 2015b). All of these benefits may lead to more effective community engagement with government in freshwater decision making. Our aims were to (1) determine the reliability of stream monitoring data collected by volunteer community groups compared with those collected by professionals (regional authorities) for a range of common statutory State of Environment (environmental condition and trend over time) reporting variables; (2) determine the kinds of support volunteer groups require to collect and deliver reliable data; (3) assess some of the associated benefits of monitoring for improving public engagement in freshwater decision making. METHODS Sites Nine community groups monitored at sites spread across five of New Zealand’s 16 regions, including Auckland, Waikato,
17(14) 5(4)
Gisborne, and Greater Wellington in the North Island and Nelson in the north of the South Island. Most community groups sampled all variables at a single stream site, but two groups sampled water quality in a different stream to where invertebrates and physical habitat were assessed. The 11 sites spanned a range of levels of human impact, including four with significant urban influence, five in predominantly rural catchments, and two that drained mostly forest (Table 1). Streams ranged from second to fifth order, draining catchments between 3 and 200 km². Most streams had beds composed mainly of gravels and cobbles, but the two Auckland sites had naturally soft bottoms dominated by sand, silt, and/or clay. Community groups and regional councils At each site, the community group sampled in parallel with the regional authority, referred to hereafter as regional council (as it is known in New Zealand) or just “council.” Regional councils are the main freshwater resource management agencies in New Zealand. Five regional councils were involved (Table 1). Community groups consisted of between 3 and 10 people, though most groups had three to four people present on any one sampling occasion. For most groups, one or two core members were present on almost every sampling occasion, but one group experienced a complete change of members during the study. The two Auckland groups belonged to Wai Care, an organized program within Auckland Council that supports volunteer stream monitoring (http://www.waicare.org.nz). These two groups had an experienced co-ordinator on site for each sampling occasion. Almost all volunteers were aged over 40 years, and a high proportion were aged over 60 years. However, one group had a number of younger members (20–40 years) and one of the Wai Care groups consisted of high school students (< 20 years) led by an adult co-ordinator. About one third of volunteers had a current or previous occupation in a field related to science. The age range and the previous science experience of volunteers in this study are typical of what we know of stream monitoring groups in New Zealand.
Ecology and Society 21(4): 32 http://www.ecologyandsociety.org/vol21/iss4/art32/
Table 2. Correlations (as Pearson r correlation coefficients) between community group and council measurements for water quality and biological variables. Bias correction factor measures how far the best-fit line deviates from the 1-to-1 line (a factor of 1 means no deviation). Average difference (between community group and council measurements) is expressed as absolute values if constant over the range, or as a % if the difference increases at higher values. % correct classification is based on four classes defined by National Objectives Framework attribute states. Variable
N
Pearson r
Bias correction
Average difference
Temperature (°C) Conductivity (μS/cm) Visual water clarity (m) pH Dissolved oxygen (mg/L) Nitrate (mg/L) E. coli (CFU/100 mL) Periphyton (% cover of filaments+mats+ sludge) PeriWCC Macroinvertebrate WMI-MCI Macroinvertebrate %EPT
93 85 59 84 89 52 52 32
0.98 0.996 0.93 0.2 0.4 0.53 0.89 0.93
0.998 0.999 0.999 0.753 0.657 0.976 0.994 0.999
0.45 °C 11 μS/cm 17% 0.39 1.45 mg/L 49% 49% 8%
32 32 32
0.64 0.85 0.88
0.931 0.956 0.957
8% 12% 27%
% correct classification
93% 80% 65% 83%
78% 52%
PeriWCC = periphyton weighted composite cover; WMI-MCI = Wai Care Macroinvertebrate Index-Macroinvertebrate Community Index; %EPT = abundance of pollution-sensitive mayflies (Ephemeroptera), stoneflies (Plecoptera), and caddisflies (Trichoptera) as a percent of total invertebrate abundance.
Field methods Study design Parallel sampling of water quality and periphyton required the community group and council to sample the same site within 1– 2 hours of each other, such that they both sampled essentially the same water conditions. On some occasions, councils were on site at the same time as volunteers, but usually did not assist volunteers with their sampling. Parallel macroinvertebrate sampling required the community group and council to sample within 1–2 days of each other, assuming no high flow events occurred between them. Most groups began sampling in February or March 2014, and continued until July–August 2015, spanning a period of 17–18 months. Water quality sampling and periphyton assessments were conducted monthly, providing up to 17 data points per site (Tables 1, 2), while macroinvertebrate sampling and physical habitat assessments were conducted every six months, providing up to four data points per site. Field data collection: council protocols The variables measured were a subset of those measured for State of Environment (SoE) monitoring, which councils conduct to fulfil their obligations under New Zealand’s Resource Management Act (1991). Councils made all measurements using their routine SoE protocols. These involved field measurements of temperature, dissolved oxygen, electrical conductivity (a measure related to total dissolved solids), and pH using professional-quality probes, visual clarity using a black disc with underwater viewer (Davies-Colley and Smith 2001) and laboratory analysis of water samples for nitrate and E. coli bacteria as an indicator of faecal pollution. Periphyton was assessed visually as percent cover of different growth forms (filaments, cyanobacterial mats, other thick mats, thin films, sludge, bare area; Kilroy et al. 2013) at 20 x 1 m-diameter circles across the width of the river.
Benthic macroinvertebrates were sampled by most councils using Protocol C1 of Stark et al. (2001), which involves kicking streambed sediments over a total area of 0.6 to 1.0 m², and collecting dislodged invertebrates in a net. The two Auckland sites were sampled using Protocol C2 for soft-bottomed streams (Stark et al. 2001), which differs by focusing sampling efforts on aquatic plants and wood. Identifications were to the level described for calculating Macroinvertebrate Community Index scores by Stark and Maxted (2007), which is genus for most insect orders and family or subfamily for Diptera. More details are given in Storey et al. (in press). Councils assessed physical habitat using the Rapid Habitat Assessment method (Clapcott 2015). This visual assessment method involves scoring, on a 20-point scale, nine inchannel, streambank, and riparian characteristics including deposition of fine sediment, quantity and quality of invertebrate and fish habitat, variety of flow types, bank stability, riparian vegetation type and width, extent of riparian shade, and artificial alterations to the stream banks and bed. Field data collection: community group protocols Community groups measured the same suite of variables as councils, but using equipment based on the Stream Health Monitoring and Assessment Kit (SHMAK; Biggs et al. 2002) developed by the National Institute of Water and Atmospheric Research (NIWA). This kit was designed to be affordable for community groups. We did not formally test the accuracy of the volunteers’ equipment nor separate differences in equipment performance from differences in skill between volunteers and professionals. Temperature and electrical conductivity were measured using EuTech ECTestr™ 11 probes, dissolved oxygen using LaMotte Direct Reading Titrator kits, pH using Aquaspex™ pH-Fix 4.5-10.0 indicator strips, and nitrate using Aquaspex™ microtest Nitrate-N NED (HS) kits. Visual clarity was measured at clearwater sites using the same black disc equipment as used by
Ecology and Society 21(4): 32 http://www.ecologyandsociety.org/vol21/iss4/art32/
councils (Davies-Colley and Smith 2001) and at turbid sites using the SHMAK clarity tube (Kilroy and Biggs 2002). E. coli was measured by filtering up to 100 mL of water sample through a Pall™ Microcheck II Beverage Monitor filter cup, placing the filter membrane face down onto a 3M Petrifilm™ plate, incubating the plate at 33-35 °C for 48 hours in a temperaturecontrolled incubator, then counting the number of blue colonies on the plate. For waters with high E. coli counts, 1 mL of water sample was applied directly to the Petrifilm™ plate instead of filtering. Periphyton was assessed using the same method as councils, but using 10 replicates instead of 20. Macroinvertebrates were collected using the same protocol as councils, but live animals were identified and counted on site in a white tray. Animals were identified according to the Wai Care Invertebrate Monitoring Protocol (WIMP; Jones et al. 2007), a system for volunteers to identify macroinvertebrates and score them according to their pollution tolerance. WIMP distinguishes fewer “taxa” than recognized by councils (e.g., three mayfly taxa compared to > 18). Physical habitat assessments were made using a slightly simplified version of the Rapid Habitat Assessment method used by councils. The language was simplified and assessments for invertebrate and fish habitat were combined into one (reducing the number of metrics from nine to eight). Volunteers were given a half-day training in methods for water quality sampling and analysis, and in identification of macroinvertebrates. They were provided with a written handbook of methods and identification guides for macroinvertebrates (Wai Care Invertebrate Field Guide; Jones et al. 2007) and growth types of periphyton (Kilroy et al. 2013). For measuring E. coli, groups were provided with an instructional video and a written handbook for E. coli methods. Some volunteers consulted frequently with the NIWA authors or regional council staff for advice, while others rarely did. Data analysis Concordance between community group and council data was quantified for each variable using Pearson correlation coefficients and a measure of bias (bias correction factor). Bias correction factor measures how far the best-fit line deviates from a line at 45 degrees, with a value of 1 indicating no deviation (Lin 1989). It was calculated using the epi.ccc function in the R package “epiR.” Analyses were performed using R version 3.1.1 (R Core Team 2014). Accuracy of community group data was estimated as the average difference between community group and council measurements for each variable over all sampling occasions. In addition, for variables with established condition bands we measured the agreement between community group and council classification in these bands. Bands representing “healthy,” “slightly impacted,” “moderately impacted,” and “unacceptable” stream condition are specified in the National Objectives Framework (NOF) of New Zealand’s NPS-FM (MfE 2014) for dissolved oxygen, nitrate (toxicity), E. coli, and periphyton, and NOF condition bands for pH are proposed by Davies-Colley et al. (2013). For periphyton, the NOF condition bands are defined in terms of biomass of chlorophyll a (mg Chla /m²). We converted units of chlorophyll a biomass into periphyton weighted
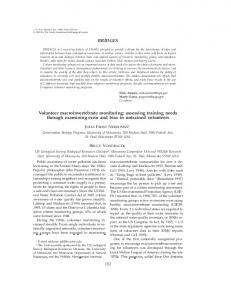
composite cover (PeriWCC) using the formula in Matheson et al. (2016). PeriWCC is defined in Matheson et al. (2016) as the following: PeriWCC = % cover of filaments + (% cover of thick mats)/2. Council macroinvertebrate data were summarized by two metrics commonly used for SoE reporting. These were Macroinvertebrate Community Index (MCI; Stark and Maxted 2007) and %EPT, the abundance of pollution-sensitive mayflies (Ephemeroptera), stoneflies (Plecoptera), and caddisflies (Trichoptera) as a percent of total invertebrate abundance. For community group data, WIMP tolerance scores were used in place of MCI scores to calculate Wai Care Macroinvertebrate Index (WMI) scores using the same formulae as for MCI. Condition bands for MCI were those defined in Stark and Maxted (2007) for “excellent,” “good,” “fair,” and “poor” stream condition, and the same bands were applied to WMI scores. Follow-up community group interviews About four months after the monitoring finished, we conducted focus group interviews with each of the nine community groups. The interviews were designed to identify volunteers’ motivations for taking part in the monitoring, the benefits and challenges they experienced, and the support they would need to continue monitoring long term. The benefits we explored were increases in science literacy, awareness of freshwater and broader environmental issues, and interest in engaging in freshwater decision making. Each focus group had between two and six participants, making a total of 34 participants. Prior to the group discussion, participants filled out a questionnaire to record individual comments. In each focus group, the researcher covered a series of discussion topics, each including an open question and follow-up questions to trigger further responses, with key discussion points written on a flip chart to guide discussions. Participants were also asked their degree of agreement or disagreement with a series of statements. The questionnaire is provided in Appendix 1 and more details are given by Kin et al. (2016). RESULTS Water quality Correlations between community group and council measurements of water quality variables were strong for temperature, conductivity, and visual water clarity (Pearson’s r = 0.98, 0.996, and 0.93, respectively) but weak for nitrate, dissolved oxygen, and pH (r = 0.53, 0.4, and 0.2, respectively; Table 2, Figs. 1, 2). Bias was minimal (bias correction factor > 0.97) for all but pH and dissolved oxygen. Although for pH and dissolved oxygen community groups achieved only weak correlation with councils, the average difference between community group and council measurements was only 0.39 for pH (i.e., less than 1 increment on the indicator strips) and 1.45 mg/L for dissolved oxygen. Further, community groups classified samples in the same NOF condition band as councils in 93% and 80% of cases for pH and dissolved oxygen, respectively (Table 2). For nitrate, community group data were weakly correlated with council data, and the average difference between community group and council data was high (49% of the measured value). With respect to NOF condition bands for nitrate toxicity, volunteers correctly classified samples in 65% of cases.
Ecology and Society 21(4): 32 http://www.ecologyandsociety.org/vol21/iss4/art32/
Fig. 1. Relationships between community group and regional council (“council”) data for (A) Temperature (°C), (B) Electrical conductivity (μS/cm), (C) Visual clarity (m) on log scale, (D) pH, (E) Dissolved oxygen (mg/L), (F) Nitrate (mg/L). Solid line through data indicates correlation. Dotted line indicates 1:1 relationship. Horizontal and vertical lines show condition bands according to New Zealand’s National Objectives Framework.
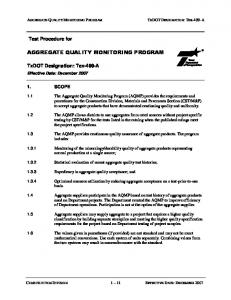
For E. coli, correlation (0.89) was relatively strong and bias (0.994) minimal. Community group counts differed from council counts by 50% on average, but were in the same NOF condition band in 83% of cases. Periphyton When the thick growth form categories (filaments, mats, and sludge) were combined, the correlation between community groups and councils was 0.93 (Table 2; Fig. 2). The correlation for PeriWCC scores was 0.64, and community groups assigned PeriWCC scores to the same NOF condition band as councils in 25 of 32 cases (78%). Correlations between community groups and councils for individual periphyton growth forms was much poorer (r = 0.13, 0.62, 0.51, and 0.1 for filaments, thick mats, thin films, and sludge, respectively).
Fig. 2. Relationships between community group and regional council (“council”) data for (A) E. coli (CFU/100 mL) on log scale, (B) Periphyton Weighted Composite Cover (%), (C) Periphyton cover (sum of mats, filaments, and sludge; %), (D) Community group Wai Care Macroinvertebrate Index (WMI) score vs. Council Macroinvertebrate Community Index (MCI) score, (E) %EPT (%). Dotted line indicates 1:1 relationship. Horizontal and vertical lines show condition bands according to New Zealand’s National Objectives Framework, or, for MCI, Stark and Maxted (2007).
Benthic macroinvertebrates Community group WMI scores agreed reasonably well with council MCI scores (Pearson r = 0.85; Table 2, Fig. 2), differing, on average, by 12%. Community groups classified streams in the same condition band as councils in 17 of 33 cases (52%), and in 15 of the remaining 16 cases, the difference was only one condition band. Agreement between community group and council scores was slightly stronger for %EPT than for WMI/MCI (Table 2, Fig. 2), partly because of several cases where both groups recorded 0% EPT. The average difference between community groups and councils was higher for %EPT (27%) than for WMI/MCI (12%).
Ecology and Society 21(4): 32 http://www.ecologyandsociety.org/vol21/iss4/art32/
Physical habitat For site-averaged scores, the strongest correlations between community groups and councils were for channel alteration and the riparian components (vegetation, buffer width, and shading), while the lowest were for aquatic animal habitat, bank stability/ erosion, sediment deposition, and flow types (Table 3). The correlation for overall habitat score was moderate (r = 0.7 between individual assessments and r = 0.75 between site averages). Table 3. Correlations (as Pearson r correlation coefficients) between community groups (CG) and regional councils (council) for physical habitat assessment and the eight metrics that compose it. Columns 4 and 5 refer to the average of standard deviations (SD) of repeated measurements at individual sites, averaged over all sites. Metric
aquatic animal habitat bank stability/erosion bank veg up to 10 m channel alteration fine sediment flow types riparian buff width/ intactness riparian shade total
Pearson r (individual assessments)
Pearson r (site averages)
SD SD CG council
0.09 0.6 0.69 0.68 0 0.25 0.45
0.16 0.57 0.79 0.85 0.34 0.55 0.81
0.13 0.07 0.05 0.12 0.23 0.13 0.11
0.12 0.10 0.07 0.14 0.12 0.11 0.10
0.78 0.7
0.86 0.75
0.12 0.05
0.10 0.06
For some variables (bank vegetation, channel alteration, flow types, riparian buffer width/intactness, riparian shade, overall score), when repeated assessments for a site were averaged over the period (column 2 Table 3), the correlation between community groups and councils was stronger than when the data set consisted of individual assessments. This suggests that a more accurate assessment of a site is obtained when multiple assessments by one or more observers are averaged. Standard deviations (for repeated assessments of same variables) for council data were similar overall to those for community group data (Table 3). Because these variables (except for fine sediment deposition) were not expected to change between observations, standard deviations were interpreted as a measure of observer (or group) consistency over time. DISCUSSION Reliability of volunteer stream monitoring We found correlations ≥ 0.85 and little bias (consistent over- or underestimation) between community group and council data for most of the water quality and biological variables, but weaker correlations for the physical habitat variables. For water quality variables with established condition bands separating “healthy,̵ “slightly impacted,” “moderately impacted,” and “unhealthy” streams, community groups classified streams into the same band as councils in a high percentage of cases. For the macroinvertebrate biotic index the percent agreement was lower, but differences were almost always only one condition band; the average difference in index score between community groups and councils was 12%. The strongest agreements between community
groups and councils were for water temperature, electrical conductivity, visual water clarity, and cover of thick periphyton growths. Other studies comparing volunteer to professional water quality measurements have shown generally similar results to ours, but most are hard to compare directly because of differences in study design, equipment, and analysis methods. The majority (Nicholson et al. 2002, Shelton 2013, Dyer et al. 2014) have reported good agreement between volunteers and professionals for temperature, electrical conductivity, and pH, but poorer agreement for dissolved oxygen and water clarity or turbidity. In contrast, Coates (2013) showed poor agreement between New Zealand community groups and councils for pH, conductivity, and clarity, and good agreement only for temperature. It is important to note that, except for Shelton (2013), these studies were retrospective analyses of previously collected data, rather than true parallel monitoring studies, therefore they were only able to detect overall bias or differences in variance between volunteer and professional data, not pairwise differences. In our pairwise comparison, community groups showed little bias compared with councils for most water quality and biological variables. We had expected volunteer E. coli measurements to be only moderately correlated with council measurements because of the relatively high competency required for microbial testing and the high natural variability of bacteria counts in water, so we were surprised by the strength of the correlation. Au et al. (2000) also found a strong correlation (> 0.97) in total coliform counts between school students and a professional. E. coli is a key reporting variable that, with visual clarity, strongly affects suitability for recreation (Nagels et al. 2001, MfE 2014) and was one of the variables of greatest interest to our volunteers. In this regard, the ability of volunteers to reliably measure both faecal pollution and visual clarity, and thus assess recreational suitability, is strongly empowering. For macroinvertebrate metrics, the correlations between community groups and councils in our study (0.85 for MCI and 0.88 for %EPT) are comparable to those in other studies (though note that correlation coefficients depend on the data range). Volunteers in Virginia (USA), using a multimetric index, achieved correlations with a professional index between 0.69 (Engel and Voshell 2002) and 0.91 (Gowan et al. 2007), while in seven sites near Seattle (USA), macroinvertebrate metrics based on volunteer identifications were highly correlated (r > 0.92) with those based on professional identifications of the same samples (Fore et al. 2001). The correlations in our study were stronger than those found by Moffett and Neale (2015; r = 0.54 and 0.58 for MCI and %EPT, respectively) in a retrospective analysis of 21 sites (samples taken at different times in somewhat different locations) across Auckland City, New Zealand. In Storey et al. (in press) we analyze the macroinvertebrate data in greater detail. Periphyton cover and physical habitat assessments require a high degree of observer judgment. The data and feedback from community groups indicated observers had difficulty in assigning periphyton growth form categories. However, the strong agreement between volunteer and professional assessments of the percent cover of the thicker growth forms combined is encouraging because periphyton is a highly visible characteristic
Ecology and Society 21(4): 32 http://www.ecologyandsociety.org/vol21/iss4/art32/
that strongly affects public perceptions of stream health, visual appeal, and suitability for recreation (Suplee et al. 2009, Matheson et al. 2016). Our physical habitat data suggest that variability among observers (and possibly even for a single observer over time) is as high for professionals as for volunteers. The variability among professional observers in our study (average range of 0.15 among sites) was similar to that found by Clapcott (2015) among professionals using the same Rapid Habitat Assessment method. Overseas studies (Roper and Scarnecchia 1995, Poole et al. 1997) confirm that professionals often vary widely in their visual assessments of stream habitat. In summary, volunteer water temperature and electrical conductivity appear to effectively replicate professional results, and after quality assurance, councils could probably use these data alongside their own. Volunteer visual clarity, E. coli, MCI, and periphyton data should be treated more cautiously because of their somewhat weaker correlations with council data, but could be used to support council data in reporting, planning, or research. Volunteer dissolved oxygen, nitrate, and pH measurements, though they may be improved with further refinement of methods, are currently useful only to detect gross effects or to indicate where further investigation is needed. Visual assessments of physical habitat appear challenging for both professionals and volunteers, and further research is needed to determine whether consistency can be improved by better training and/or cross-validation among observers. Support for community groups Our experience from the study, and feedback from the community groups, highlighted several forms of support that contributed to the data quality obtained here. Obvious forms of support included training and instruction guides. Quality assurance (data checking and discussion with the groups as data were submitted) frequently identified issues that would have otherwise led to significant inaccuracies. These forms of support are known to increase the quality of volunteer data (Penrose and Call 1995, cf. Gowan et al. 2007, Nerbonne and Vondracek 2003, Whitelaw et al. 2003, Sharpe and Conrad 2006), but also, we found, increased volunteers’ confidence in their data and hence their motivation for continuing. Less obvious were the “softer” forms of support that maintained volunteer enthusiasm. Volunteers were strongly encouraged by interaction with scientists, and identified “learning” as one of the main rewards of taking part in the study. Interactions with their local council were also important, particularly where they felt the council had a genuine interest in their results, because volunteers were strongly motivated by a desire to “make a difference.” This desire also meant they wanted to share their results and monitoring stories with others. Finally, mutual support within the group, expressed as friendship and sense of shared purpose, contributed strongly to maintaining the monthly monitoring schedule (Kin et al. 2016). This feedback indicates that community monitoring could be supported by a web site where monitoring groups could upload and share data, receive training, and share ideas, questions, and observations. However, web-based interactions should not replace face to face contact with scientists, councils, and the local community. Data quality and continuity will likely be much higher where these forms of support are in place (Whitelaw et al. 2003, Conrad and Hilchey 2011).
Potential to enhance freshwater decision making Feedback from the community groups in this study indicated that participating in monitoring increased volunteers’ understanding of the science process, their knowledge of, and attentiveness to, freshwater issues, and their awareness of the ecology of local fresh waters (see Kin et al. 2016 for details). Similar findings have been reported in other studies of community-based monitoring (Evans et al. 2005, Bonney et al. 2009, Devictor et al. 2010, Conrad and Hilchey 2011). In these ways, their knowledge of local freshwaters became more specific, and therefore more useful for effecting positive change. Though only a minority of participants said they would engage in council-led planning processes, some felt more likely and better-equipped to engage as a result of their monitoring experience. Furthermore, almost all participants had used the monitoring as an opportunity to talk about freshwater issues with others in their communities, thus arguably increasing the ability of local communities overall to engage knowledgably in freshwater planning (Conrad and Hilchey 2011, Stepenuck and Green 2015). All community groups had developed closer relationships with their councils through the monitoring. Although in some countries governments have developed systems for integrating community monitoring data into resource management (Whitelaw et al. 2003, Weston and Conrad 2015), there are few examples of governments engaging community monitors in decision making (Vaughan et al. 2003, Sharpe and Conrad 2006, Conrad and Hilchey 2011, Dyer et al. 2014, Stepenuck and Green 2015). We anticipate that community groups could bring their own monitoring data to freshwater planning processes, able to discuss it in the context of council data. CONCLUSIONS Public participation in freshwater monitoring is growing around the world. We conclude, like others (Fore et al. 2001, Sharpe and Conrad 2006, Whitelaw et al. 2003, Gowan et al. 2007, Dyer et al. 2014), that given appropriate support, volunteers can collect good quality monitoring data for a number of water quality and biological variables, and that their data could be used to augment council data in statutory State of Environment reporting and freshwater planning. Volunteer data are potentially effective in filling the data gaps that hamper effective freshwater decision making in New Zealand, where recent policy changes require greater data coverage, and in other countries (Whitelaw et al. 2003). Further, community-based monitoring increases volunteers’ awareness of their local fresh waters, their understanding of stream ecosystems, and their awareness of localand national-scale freshwater issues, and improves their relationships with councils. As volunteers discuss their monitoring within their local communities, some of these benefits extend beyond the monitoring group. These benefits may help councils achieve another requirement of New Zealand’s freshwater reforms, that of increasing community involvement in freshwater decision making.
Responses to this article can be read online at: http://www.ecologyandsociety.org/issues/responses. php/8934
Ecology and Society 21(4): 32 http://www.ecologyandsociety.org/vol21/iss4/art32/
Acknowledgments: We warmly thank all the volunteers and regional/unitary council staff who participated enthusiastically in this study. We also thank two anonymous reviewers for their helpful comments. This research was funded by the Ministry of Business, Innovation and Employment under the Freshwater Values, Monitoring and Outcomes programme (Contract C09X1003 to Landcare Research Ltd.). LITERATURE CITED Au, J., P. Bagchi, B. Chen, R. Martinez, S. A. Dudley, and G. J. Sorger. 2000. Methodology for public monitoring of total coliforms, Escherichia coli and toxicity in waterways by Canadian high school students. Journal of Environmental Management 58 (3):213-230. http://dx.doi.org/10.1006/jema.2000.0323 Biggs, B., C. Mulcock, B. Stuart, S. Washington, J. van Rossem, M. Scarsbrook, and C. Kilroy. 2002. Stream health monitoring and assessment kit. NIWA Technical Report No. NTR111. National Institute of Water and Atmospheric Research, Auckland, New Zealand. Bliss, J., G. Aplet, C. Hartzell, P. Harwood, P. Jahnige, D. Kittredge, S. Lewandowski, and M. L. Soscia. 2001. Communitybased ecosystem monitoring. Journal of Sustainable Forestry 12 (3-4):143-167. http://dx.doi.org/10.1300/j091v12n03_07 Bonney, R., C. B. Cooper, J. Dickinson, S. Kelling, T. Phillips, K. V. Rosenberg, and J. Shirk. 2009. Citizen science: a developing tool for expanding science knowledge and scientific literacy. BioScience 59(11):977-984. http://dx.doi.org/10.1525/bio.2009.59.11.9
Davies-Colley, R., P. Franklin, R. Wilcock, S. Clearwater, and C. Hickey. 2013. National objectives framework - temperature, dissolved oxygen & pH proposed thresholds for discussion. NIWA Client Report HAM2013-056. Prepared for Ministry for the Environment, Hamilton, New Zealand. Davies-Colley, R. J., and D. G. Smith. 2001. Turbidity, suspended sediment and water clarity: a review. Journal of the American Water Resources Association 34:1085-1101. http://dx.doi. org/10.1111/j.1752-1688.2001.tb03624.x Devictor, V., R. J. Whittaker, and C. Beltrame. 2010. Beyond scarcity: citizen science programmes as useful tools for conservation biogeography. Diversity and Distributions 16 (3):354-362. http://dx.doi.org/10.1111/j.1472-4642.2009.00615.x Dickinson, J. L., J. Shirk, D. Bonter, R. Bonney, R. L. Crain, J. Martin, T. Phillips, and K. Purcell. 2012. The current state of citizen science as a tool for ecological research and public engagement. Frontiers in Ecology and the Environment 10 (6):291-297. http://dx.doi.org/10.1890/110236 Dyer, F., E. Harrison, B. Gruber, S. Nichols, A. Tschierschke, and W. O’Reilly. 2014. Waterwatch data quality: an opportunity to augment professionally collected data sets. Pages 357-362 in G. Vietz., I. D. Rutherford, and R. Hughes, editors. Proceedings of the 7th Australian Stream Management Conference. Townsville, Australia, 27-30 July. Engel, S. R., and J. R. Voshell Jr. 2002. Volunteer biological monitoring: can it accurately assess the ecological condition of streams? American Entomologist 48(3):164-177. http://dx.doi. org/10.1093/ae/48.3.164
Bonney, R., J. L. Shirk, T. B. Phillips, A. Wiggins, H. L. Ballard, A. J. Miller-Rushing, and J. K. Parrish. 2014. Next steps for citizen science. Science 343(6178):1436-1437. http://dx.doi.org/10.1126/ science.1251554
Evans, C., E. Abrams, R. Reitsma, K. Roux, L. Salmonsen, and P. P. Marra. 2005. The neighborhood nestwatch program: participant outcomes of a citizen-science ecological research project. Conservation Biology 19(3):589-594. http://dx.doi. org/10.1111/j.1523-1739.2005.00s01.x
Bradshaw, B. 2003. Questioning the credibility and capacity of community-based resource management. Canadian Geographer/ Le Géographe Canadien 47(2):137-150. http://dx.doi. org/10.1111/1541-0064.t01-1-00001
Fore, L. S., K. Paulsen, and K. O’Laughlin. 2001. Assessing the performance of volunteers in monitoring streams. Freshwater Biology 46(1):109-123. http://dx.doi.org/10.1111/j.1365-2427.2001.00640. x
Buckland-Nicks, A. 2015. Keys to success: a case study approach to understanding community-based water monitoring uptake in governmental decision-making. Thesis. Dalhousie University, Halifax, Nova Scotia, Canada.
Gollan, J., L. L. de Bruyn, N. Reid, and L. Wilkie. 2012. Can volunteers collect data that are comparable to professional scientists? A study of variables used in monitoring the outcomes of ecosystem rehabilitation. Environmental Management 50 (5):969-978. http://dx.doi.org/10.1007/s00267-012-9924-4
Carolan, M. S. 2006. Science, expertise, and the democratization of the decision-making process. Society and Natural Resources 19 (7):661-668. http://dx.doi.org/10.1080/08941920600742443 Clapcott, J. 2015. National rapid habitat assessment protocol development for streams and rivers. Cawthron Report No. 2649. Prepared for Northland Regional Council, Nelson, New Zealand. Coates, A. 2013. Volunteer monitoring of water quality in New Zealand: Where does the value Lie? Thesis. University of Canterbury, Christchurch, New Zealand. Conrad, C. C., and K. G. Hilchey. 2011. A review of citizen science and community-based environmental monitoring: issues and opportunities. Environmental Monitoring and Assessment 176 (1):273-291. http://dx.doi.org/10.1007/s10661-010-1582-5
Gowan, C., M. Ruby, R. Knisley, and L. Grimme. 2007. Stream monitoring methods suitable for citizen volunteers working in the Coastal Plain and Lower Piedmont regions of Virginia. American Entomologist 53(1):48-57. http://dx.doi.org/10.1093/ae/53.1.48 Huddart, J. E. A., M. S. A. Thompson, G. Woodward, and S. J. Brooks. 2016. Citizen science: from detecting pollution to evaluating ecological restoration. Wiley Interdisciplinary Reviews: Water 3:287-300. http://dx.doi.org/10.1002/wat2.1138 Hunsberger, C. 2004. Exploring the links between citizen environmental monitoring and decision-making: three Canadian case examples. Thesis, University of Waterloo, Waterloo, Ontario, Canada.
Ecology and Society 21(4): 32 http://www.ecologyandsociety.org/vol21/iss4/art32/
Jones, R., S. Moore, A. Jenks, and C. Henley. 2007. Wai Care invertebrate field guide. Wai Care invertebrate monitoring protocol (WIMP). Wai Care, Auckland, New Zealand. [online] URL: https://waicare.org.nz/Files/WIMP%20pdf%202013.pdf
Nagels, J., R. Davies-Colley, and D. Smith. 2001. A water quality index for contact recreation in New Zealand. Water Science & Technology 43(5):285-292.
Kilroy, C., and B. J. Biggs. 2002. Use of the SHMAK clarity tube for measuring water clarity: comparison with the black disk method. New Zealand Journal of Marine and Freshwater Research 36(3):519-527. http://dx.doi.org/10.1080/00288330.2002.9517107
Nerbonne, J. F., and B. Vondracek. 2003. Volunteer macroinvertebrate monitoring: assessing training needs through examining error and bias in untrained volunteers. Journal of the North American Benthological Society 22(1):152-163. http://dx. doi.org/10.2307/1467984
Kilroy, C., D. J. Booker, L. Drummond, J. A. Wech, and T. H. Snelder. 2013. Estimating periphyton standing crop in streams: a comparison of chlorophyll a sampling and visual assessments. New Zealand Journal of Marine and Freshwater Research 47 (2):208-224. http://dx.doi.org/10.1080/00288330.2013.772526
Nerbonne, J. F., B. Ward, A. Ollila, M. Williams, and B. Vondracek. 2008. Effect of sampling protocol and volunteer bias when sampling for macroinvertebrates. Journal of the North American Benthological Society 27(3):640-646. http://dx.doi. org/10.1899/07-101.1
Kin, E., R. G. Storey, A. Wright-Stow, and R. Davies-Colley. 2016. Engaging communities in freshwater monitoring: benefits and challenges. NIWA Technical Report. National Institute of Water and Atmospheric Research, Hamilton, New Zealand.
Nicholson, E., J. Ryan, and D. Hodgkins. 2002. Community datawhere does the value lie? Assessing confidence limits of community collected water quality data. Water Science & Technology 45(11):193-200.
Land and Water Forum. 2012. Second report of the Land and Water Forum: setting limits for water quality and quantity, and freshwater policy- and plan-making through collaboration. Land and Water Forum, Wellington, New Zealand.
Overdevest, C., C. H. Orr, and K. Stepenuck. 2004. Volunteer stream monitoring and local participation in natural resource issues. Human Ecology Review 11(2):177-185.
Latimore, J. A., and P. J. Steen. 2014. Integrating freshwater science and local management through volunteer monitoring partnerships: the Michigan Clean Water Corps. Freshwater Science 33(2):686-692. http://dx.doi.org/10.1086/676118
Penrose, D., and S. M. Call. 1995. Volunteer monitoring of benthic macroinvertebrates: regulatory biologists’ perspectives. Journal of the North American Benthological Society 14 (1):203-209. http://dx.doi.org/10.2307/1467735
Lin, L. I.-K. 1989. A concordance correlation coefficient to evaluate reproducibility. Biometrics 45:255-268. http://dx.doi. org/10.2307/2532051
Peters, M., C. Eames, and D. Hamilton. 2015b. The use and value of citizen science data in New Zealand. Journal of the Royal Society of New Zealand 45(3):151-160. http://dx.doi. org/10.1080/03036758.2015.1051549
Loperfido, J. V., P. Beyer, C. L. Just, and J. L. Schnoor. 2010. Uses and biases of volunteer water quality data. Environmental Science & Technology 44(19):7193-7199. http://dx.doi.org/10.1021/ es100164c
Peters, M. A., D. Hamilton, and C. Eames. 2015a. Action on the ground: a review of community environmental groups’ restoration objectives, activities and partnerships in New Zealand. New Zealand Journal of Ecology 39(2):179-189.
Matheson, F., J. M. Quinn, and M. Unwin. 2016. Instream plant and nutrient guidelines. Review and development of an extended decision-making framework Phase 3. NIWA Client Report HAM2015-064 Prepared for Ministry of Business, Innovation and Employment Envirolink Fund. National Institute of Water & Atmospheric Research, Hamilton, New Zealand. [online] URL: http://www.envirolink.govt.nz/PageFiles/1527/R9-3%20Instream% 20plant%20and%20nutrient%20guidelines%20Phase%203%20report. pdf
Pollock, R. M., and G. S. Whitelaw. 2005. Community-based monitoring in support of local sustainability. Local Environment 10(3):211-228. http://dx.doi.org/10.1080/13549839.2005.9684248
Ministry for the Environment (MfE). 2014. National policy statement for freshwater management. Ministry for the Environment, Wellington, New Zealand. [online] URL: http:// www.mfe.govt.nz/publications/fresh-water/national-policy-statementfreshwater-management-2014 Moffett, E. R., and M. W. Neale. 2015. Volunteer and professional macroinvertebrate monitoring provide concordant assessments of stream health. New Zealand Journal of Marine and Freshwater Research 49(3):366-375. http://dx.doi.org/10.1080/00288330.2015.1018913 Morin, A. 2009. Strengthening integrated water resource management in Canada. Government of Canada Policy Research Initiative, Ottawa, Ontario, Canada.
Poole, G. C., C. A. Frissell, and S. C. Ralph. 1997. In-stream habitat unit classification: inadequacies for monitoring and some consequences for management. Journal of the American Water Resources Association 33(4):879-896. http://dx.doi.org/10.1111/ j.1752-1688.1997.tb04112.x R Core Team. 2014. R: A language and environment for statistical computing. Version 3.1.1. R Foundation for Statistical Computing, Vienna, Austria. Reynoldson, T., L. Hampel, and J. Martin. 1986. Biomonitoring networks operated by schoolchildren. Environmental Pollution Series A, Ecological and Biological 41(4):363-380. http://dx.doi. org/10.1016/0143-1471(86)90027-9 Roper, B. B., and D. L. Scarnecchia. 1995. Observer variability in classifying habitat types in stream surveys. North American Journal of Fisheries Management 15(1):49-53. http://dx.doi. org/10.1577/1548-8675(1995)0152.3.co;2 Savan, B., A. J. Morgan, and C. Gore. 2003. Volunteer environmental monitoring and the role of the universities: the
Ecology and Society 21(4): 32 http://www.ecologyandsociety.org/vol21/iss4/art32/
case of Citizens’ Environment Watch. Environmental Management 31(5):0561-0568. http://dx.doi.org/10.1007/s00267-002-2897y Sharpe, A., and C. Conrad. 2006. Community based ecological monitoring in Nova Scotia: challenges and opportunities. Environmental Monitoring and Assessment 113(1):395-409. http:// dx.doi.org/10.1007/s10661-005-9091-7 Shelton, A. M. 2013. The accuracy of water quality monitoring data: a comparison between citizen scientists and professionals. Thesis, Saint Mary’s University, Halifax, Nova Scotia, Canada. Silvertown, J. 2009. A new dawn for citizen science. Trends in Ecology & Evolution 24(9):467-471. http://dx.doi.org/10.1016/j. tree.2009.03.017 Stark, J., and J. R. Maxted. 2007. A user guide for the Macroinvertebrate Community Index. Cawthron Report No. 1166 Prepared for the Ministry for the Environment, Wellington, New Zealand. Stark, J. D., I. K. G. Boothroyd, J. S. Harding, J. R. Maxted, and M. R. Scarsbrook. 2001. Protocols for sampling macroinvertebrates in wadeable streams. New Zealand Macroinvertebrate Working Group Report No. 1. Ministry for the Environment, Wellington, New Zealand. Stepenuck, K. F., and L. T. Green. 2015. Individual- and community-level impacts of volunteer environmental monitoring: a synthesis of peer-reviewed literature. Ecology and Society 20 (3):19. http://dx.doi.org/10.5751/es-07329-200319 Storey, R. G., A. Wright-Stow, R. Davies-Colley, and R. Stott. In press. Agreement between volunteer and professional monitoring of New Zealand streams: current state and opportunities for improvement. New Zealand Journal of Marine and Freshwater Research. Suplee, M. W., V. Watson, M. Teply, and H. McKee. 2009. How green is too green? Public opinion of what constitutes undesirable algae levels in streams. Journal of the American Water Resources Association 45(1):123-140. http://dx.doi.org/10.1111/ j.1752-1688.2008.00265.x United Nations Conference on Environment and Development. 1993. Agenda 21 - Programme of action for sustainable development. United Nations Conference on Environment and Development, New York, New York, USA. Vaughan, H., G. Whitelaw, B. Craig, and C. Stewart. 2003. Linking ecological science to decision-making: delivering environmental monitoring information as societal feedback. Environmental Monitoring and Assessment 88(1-3):399-408. http://dx.doi.org/10.1023/A:1025593728986 Weston, S., and C. Conrad. 2015. Community-based water monitoring in Nova Scotia: solutions for sustainable watershed management. Environment and Natural Resources Research 5(2): p1. http://dx.doi.org/10.5539/enrr.v5n2p1
Whitelaw, G., H. Vaughan, B. Craig, and D. Atkinson. 2003. Establishing the Canadian community monitoring network. Environmental Monitoring and Assessment 88(1):409-418. http:// dx.doi.org/10.1023/A:1025545813057 Wismer, S., and B. Mitchell. 2005. Community-based approaches to resource and environmental management. Environments 33 (1):1-5.
Appendix 1. Questionnaire for community monitoring groups.
General Information -
Name:
-
Age:
-
Gender:
-
(Previous) Occupation:
60
1.
What is the name of the site/stream where you do the monitoring?
2.
For how many years have you lived in this area?
3.
How many group members participate on an average monitoring day?
4.
For how long have you been involved in the community monitoring group?
5.
How did you get involved in the community monitoring group?
6.
Have you previously been involved in groups related to or similar to the community monitoring group? Yes
No
If you answered ‘yes’ to the question above: What groups have you been involved with?
7.
Did you have a connection with the stream/site prior to your involvement in the community monitoring group? Yes
No
If you answered ‘no’ to the question above, skip question 8 and continue from question 9 8.
Please indicate to what extent you disagree or agree with the following options Your connection with the site/stream originates from:
Strongly Disagree Occupation Recreational
Neither Disagree
agree nor disagree
Agree
Strongly agree
Comments
activities Environmental activities (voluntarily) Close proximity of the stream to my house Other:
9.
What motivated you to become involved in NIWA’s community monitoring study? The desire to …
Strongly Disagree
Neither Disagree
agree nor
Agree
disagree
Strongly agree
Comments
contribute to data collection to learn more about freshwater to learn more about the local environment to contribute to the environment Other:
10. Please indicate to what extent you disagree or agree with the following options. I gained knowledge prior to the monitoring study about natural freshwater ecosystems through the following activities: Strongly
Disagree
Neither
Agree
Strongly
Comments
Disagree
agree nor
agree
disagree Occupation Recreational activities Environmental activities (voluntarily) Close proximity of the stream to my house Other:
11. My knowledge on natural freshwater ecosystems increased after participating in the monitoring study Strongly Disagree
Disagree
Neither agree nor disagree
Agree
Strongly agree
12. I am familiar with scientific thinking and methods…
Strongly Disagree
Neither Disagree
agree nor disagree
Agree
Strongly agree
Comments (optional)
Prior to participating in the program After participating in the program
13. - Participating in the community monitoring group strengthened my connection with the stream/site
Strongly Disagree
Disagree
Neither agree nor disagree
Agree
Strongly agree
- Participating in the community monitoring group made me think more about the stream/site Strongly Disagree
Disagree
Neither agree nor disagree
Agree
Strongly agree
- Participating in the community monitoring group made me talk more about the stream/site with other people Strongly Disagree
Disagree
Neither agree nor disagree
Agree
Strongly agree
- Participating in the community monitoring group increased my level of activities for, on or around the stream/site, apart from the monitoring study Strongly Disagree
Disagree
Neither agree nor disagree
Agree
Strongly agree
14. - Based on my experiences with the community monitoring group, I will continue monitoring in the long term Strongly Disagree
Disagree
Neither agree nor disagree
Agree
Strongly agree
15. The following statements are about possible support from the regional council and/or scientists. Please indicate to what extent you disagree or agree - I value encouragement from regional council staff in order to continue monitoring in the long term Strongly Disagree
Disagree
Neither agree nor disagree
Agree
Strongly agree
- I value encouragement from scientists in order to continue monitoring in the long term Strongly Disagree
Disagree
Neither agree nor disagree
Agree
Strongly agree
- I value face to face contact with regional council staff in order to continue monitoring in the long term
Strongly Disagree
Disagree
Neither agree nor disagree
Agree
Strongly agree
- I value face to face contact with scientists in order to continue monitoring in the long term Strongly Disagree
Disagree
Neither agree nor disagree
Agree
Strongly agree
- I value interaction with scientists over the phone or by email in order to continue monitoring in the long term Strongly Disagree
Disagree
Neither agree nor disagree
Agree
Strongly agree
- I value training by scientists in order to continue monitoring in the long term Strongly Disagree
Disagree
Neither agree nor disagree
Agree
Strongly agree
16. Are there activities you got involved with due to your involvement in the community monitoring? Yes
No
If ‘yes’, please indicate what activities:
THANK YOU FOR YOUR TIME!


![Volunteer Stream Monitoring Training Manual [PDF]](https://m.moam.info/img/260x300/volunteer-stream-monitoring-training-manual-pdf_59c373181723ddd9d9c5ad75.jpg)