Vortex Shedding from Tapered, Triangular Plates: Taper and Aspect Ratio Effects Ian P Castro & Lee Watson School of Engineering Sciences University of Southampton, Highfield, Southampton, SO17 1BJ, UK
Contact e-mail:
[email protected]
Abstract Further experiments on features of the vortex shedding from tapered flat plates normal to an airstream are described. The work extends that of Castro & Rogers (2002) and concentrates on study of the affects of varying spanwise aspect ratio for a fixed shape plate, by appropriate adjustment of end-plates, and of the nature of the shedding as the degree of taper becomes very large, so that the body is more like a triangular plate - e.g. an isosceles triangle - than a slightly-tapered plate. With the taper ratio T R defined as the ratio of plate length to average cross-stream width, the paper concentrates on the range 0.58 < T R < 60. Reynolds numbers based on the average plate width exceed 104 . It is confirmed that for small enough taper ratio the geometrical three-dimensionality is sufficiently strong that all signs of periodic vortex shedding cease. For all other cases, however, the flow at different locations along the span can vary substantially, depending on taper. There appear to be at least four different regimes, each appropriate for a different range of taper ratio. These various regimes are described.
2
List of Symbols AR
Spanwise aspect ratio, W/dav
d
Local width of the plate
dav
Average width of the plate between the end-plates (or end-plate and tip or wall and tip), m
do
Base width of the plate (i.e. at z=0), m
f
Shedding frequency, Hz
H
Dimension of the tunnel cross-section normal to the plate symmetry axis, m
He
Splitter plate height (see fig.1)
L
Total length of plate (between base, where d = do , and tip, where d=0), m
Le , Lf Splitter plate dimensions (see fig.2) Ls
Length of splitter plate (see fig.2)
Std
Local Strouhal number, f d/U
Sto
Strouhal number based on base width, f do /U
TR
Taper ratio, L/dav
U
Measured free-stream velocity, m/s
W
Spanwise distance between ends of plate
z
distance along span, measured from base of plate
z0
= z/L
∆z
Spanwise width of a constant-frequency cell
1
Introduction
Relatively little attention has been paid to the way in which spanwise taper affects the high Reynolds number, fully turbulent, vortex shedding process from a bluff body. Taper - a
3
gradual change in the cross-stream width, d, of the body - introduces inherent mean flow three-dimensionality, quite apart from that inevitably linked with spanwise end-effects. One intuitively expects that the spanwise coherence in the shedding would be weakened. Even if the taper were weak enough to allow a region (or regions) of constant shedding frequency across the span despite the changing d, eventually d will have changed sufficiently to force some kind of dislocation in the shedding - assuming of course that the shedding process will be such as to try to maintain, as far as possible, the Strouhal number associated with the equivalent parallel-sided body. For low Reynolds number flow over tapered cylinders (cones with Re = U do /ν = O(100)) Gaster (1969) and Papangellou (1992) have clearly demonstrated ’cellular’ shedding in cases where the taper ratio, T R, was in the range 240 < T R < 2400; T R is here defined as the ratio of the total body spanwise length (L, from base to tip) to the average width (do /2, where do is the base diameter). At high Reynolds numbers (Re = O(104 )) cellular shedding appeared not to occur (Gaster, 1971) and later experiments using flat plates - to avoid the complications caused by Reynolds number effects - also suggested an absence of cellular shedding, Gaster & Ponsford (1984). They did show, however, that some features of the flow over a T R = 72 plate depended on the aspect ratio, AR = W/dav where W is the distance between end-plates (or other end conditions) and dav is the average plate width over that distance. Note that AR is a separately adjustable parameter except in the case when the plate tip (where d = 0) provides one of the end conditions in the flow, in which case AR = T R. Note also that a parallel sided body has T R = ∞, so that decreasing taper ratio refers to increasing tip angle α (see figure 2) and thus increasing three-dimensionality. We emphasise that throughout this paper a ’cell’ is defined as a spanwise region throughout which the time-mean shedding frequency is constant. The local Strouhal number, Std = f d/Uo , is thus not constant within a cell, whereas in regions where it is constant the shedding frequency must vary.
4
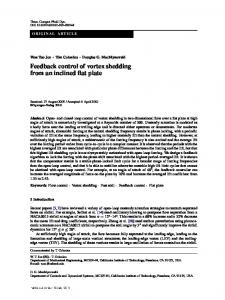
In contrast to Gaster & Ponsford’s conclusion, Maull & Young (1972) found evidence of a cellular structure in the corresponding case of a uniform shear flow over a parallel-sided flat plate. One might expect similar behaviour between this case and that of a uniform flow over a tapered plate; the apparent inconsistency provided part of the motivation for a more extensive set of experiments we have recently reported (Castro & Rogers, 2002, hereafter denoted by CR). These showed clearly that cellular shedding does occur for high Reynolds number flow over tapered flat plates at least for the range 20 < T R < 60. Provided the body tip (i.e. d = 0) is either within the flow or at a flow boundary, so that AR = T R, only one of these cells exists and it always occurs at the widest end of the body and has a span of typically 0.25W . Elsewhere across the span the shedding organises itself so that (on average) the local Strouhal number (rather than frequency) is roughly constant. Figure 1 illustrates these features; the local Strouhal number, Std = f d/U , is plotted as a function of spanwise location z 0 = z/L where z is measured from the base of the plate, where the local plate width is do . Note that with AR = T R the general behaviour of the Strouhal number as a function of spanwise position is similar for all taper ratios in the range 20 < T R < 60. However, there was also evidence that reducing the aspect ratio, so that AR < T R, led to multiple cells. In this paper, firstly, we explore this point further by presenting some results of new measurements obtained for the specific case T R = 40 - chosen because the earlier studies showed that this taper ratio is in some senses typical of this weak taper regime (see figure 8). In the present experiments, as AR increases towards T R the far (spanwise) end of the flow is removed further and further from the base (where d = do ). Here we explore how changes in AR affect the length of each cell and the extent to which significant ’overlap’ regions occur (where multiple peak frequencies appear in spectra).
Figure 1: Strouhal number variation for different taper ratios (20-60) with AR = T R and Re > 104 . (From Castro & Rogers, 2002)
5
None of the earlier studies explored what happens at taper ratios below 20. The second objective of the work presented here was therefore to characterise the wake for cases when T R < 20. This was done using a sequence of plates mounted on the floor of the tunnel and with taper ratios in the range 0.58 < T R < 20. In every case, the tip of the plate (where d = 0) was within the tunnel and no end plates were used, so that AR = T R. For the lowest values of T R the bodies would perhaps more usually be thought of as triangular plates, since the ’taper’ was in those cases very strong (even more ’squat’ than an isosceles triangle).
2
Experimental Arrangement
All experiments were undertaken in a 910 x 610mm, suck-down, open circuit wind tunnel in the School of Engineering Sciences. The free-stream velocity was spatially uniform to better than 0.25% outside the wall boundary layers and the free-stream turbulent intensity was below about 0.2% (above 1Hz). For the first stage of the work - studying the effects of aspect ratio - a bevel-edged tapered plate having T R = 39 and base width do = 39.5mm was mounted horizontally across the span of the working section (910mm), with endplates located at the do position and at a second, variable position towards the tip, which was held in position within the tunnel using fine, tensioned wires. Figure 2 shows the general arrangement. Further experiments using a larger plate of (nominally) the same taper ratio were also performed, largely to investigate possible blockage effects on the cellular shedding characteristics. This plate had do = 62.5mm (at one tunnel side-wall) and its (virtual) tip was outside the opposite side-wall. The end-plate geometry was chosen to ensure that the end-plate boundary layer would be as small as possible at the tapered plate location (but in its absence), consistent with preventing cross-talk between the flow either side of the end-plate and/or unwanted separation at the leading edge. Thus, referring to figure 2, Lf > 8do , Le > 10.5do and He > 3.5do .
6
Figure 2: Experimental arrangements (not to scale) For the second stage - characterising the wake for low-taper-ratio cases (0.58 < T R < 20) - ten further plates were constructed, having do = 40mm or 75mm. The included tip angles α (see fig.2) and corresponding taper ratios (in brackets) were: 140o (0.36), 120o (0.58), 90o (1), 60o (1.73), 30o (3.73), 22.5o (5), 15.2o (7.5), 11.4o (10), 7.6o (15) and 5.8o (20). Note that this range encompasses very squat cases, including the case in which the plate is an isosceles triangle (α = 60o ). These plates were vertically mounted (i.e. with the tip above the base) directly on the floor of the tunnel, at a location where the undisturbed boundary layer thickness δ was some 20mm. For the T R = 0.58 case δ was only a little lower than the plate height (21.7mm) so the wake would be expected to differ somewhat from what would occur if h/δ >> 1. (The same would be expected to be true for the even squatter plate, T R = 0.36). A second plate of the same T R but twice the size was employed to assess this effect. In all cases spectral data were obtained from hot wires placed near the outer edge of the separated shear layers. The probes were driven by University of Newcastle (NSW) constant temperature bridges whose outputs were taken to a/d converters interfaced to a Macintosh computer running LabAn - a comprehensive software package written in LabVIEW and capable of on-line calibration and measurement of a wide range of quantities from numerous instruments. The free stream velocity, measured with a standard pitot-static tube mounted well upstream of the plate, was nominally U = 10m/s; this instrument was used as the reference for hot wire calibration, although such calibration was unnecessary if only spectral peak frequencies were required. Hot wire sampling rates were typically 1kHz (anti-aliasing filters were used) and generally 50-100 blocks of 1024 samples were obtained for the spectral estimations. Some additional cross-spectra were obtained from two wires positioned on
7
opposite sides of the wake (at the same height and distance downstream), to investigate the nature of the shedding processes. Similar sampling criteria were used.
3
Results and Discussion
3.1
Effects of aspect ratio at high taper ratio
It would be inappropriate to present all the available data. Some specific results are selected in order to clarify the basic features of the various cases. As a reference, recall that fig.1 shows the previously measured shedding frequency data for the AR = T R case with T R = 20, 40 & 60 (see CA for a full discussion). As noted earlier, it is clear that in each case there is a cell of constant frequency (and thus linearly decreasing Std ) at the base end of the plate but outboard from there the average shedding frequency varies with the local plate width, d, so that Std remains roughly constant. Notice that the base Strouhal number (Sto = f do /U ) depends on the taper ratio and becomes increasingly lower than the parallel-sided value (about 0.14) as the degree of taper increases - i.e. as T R decreases. (Section 3.2 includes further discussion of this point). There is rather more scatter at the tip end of the plate and this may be due partly to Reynolds number effects (Re = U d/ν becomes very small as the tip is approached). although manufacturing tolerances also become relatively much more significant in that region. Individual spectra display noticeably broader peaks in the constant Std region (cf. the constant f region). This could suggest that the shedding there is less coherent with, at any particular location, a more-or-less random switching between shedding at different frequencies, each associated with a plate width not too different from the immediately local value. Note also that in this region the Std values for the T R = 20 and 60 cases are rather higher than for the T R = 40 case. In each case the tunnel blockage was small (less than 3%)
8
Figure 3: Strouhal number data for T R = 40. AR =: 20 (a), 15.4 (b), 10 (c) and 5.8 (d) but in the former case the ends of the plates were located on the tunnel side walls (unlike all the data presented below), rather than at endplates, which may partially explain the difference. Figures 3a-d present corresponding Std data for the T R = 40 case for aspect ratios in the nominal range 6 < AR < 20. In each case the straight lines refer to the Std variation which would be expected if the shedding frequency were precisely constant - so each line goes through the point corresponding to z 0 = z/L = 1 on the z axis. Fig.3a shows that once the aspect ratio is significantly lower than the taper ratio (about one half for the data in this fig.) a clear constant frequency cell appears at the narrow end of the plate, as well as at the wider end. In between these two cells there is a central region within which the shedding frequency remains roughly constant. It would arguably be possible to draw similar constant frequency, straight lines through some of the data points in this central section, but clearly any genuinely identifiable cell would be of very restricted spanwise extent. Near the boundaries between the three regions, spectral peaks are broader than at locations deep within the two end cells and sometimes contain two distinctly separate peaks sitting atop the overall broader band peak. An example spectrum is shown as an insert (for z/W = 0.39). At this location it would seem that for significant periods the shedding is locally in phase (and coherent with) the fixed cell frequency (at smaller z/W ) and during other periods it shifts to a rather higher frequency more appropriate to the local plate width. Similar behaviour occurs near z/W = 0.8. A reduction in aspect ratio to AR = 15.4 (fig.3b) leads to results which suggest that the flow is ’trying’ to develop at least one further constant frequency cell between the two end cells. In this case, as the insert shows (for z/W = 0.75), the two spectral peaks in the overlap region near the tip cell are particularly clear. This general trend is even clearer in fig.3c, for AR = 10.4. At some locations in this case there
9
are three distinct spectral peaks with (around z/W = 0.6, see insert) the one at the highest frequency being very much smaller than the other two, although still very noticeable. Only near the ends of the end cells - i.e. around z/W = 0.1 and 0.9 - are the spectra characterised by a single, relatively very sharp peak. At sufficiently small aspect ratio the major shedding frequency in the base end cell can be distinguished in spectra all across the span. This is indicated in fig.3d, for AR = 5.8. The spectral insert shows two discernible peaks even at z/W = 0.95. At nearly all locations beyond about z/W = 0.25 the secondary peak (of lower amplitude and higher frequency) can be distinguished but the corresponding St value is only included in the figures if its height is within a factor of five of the dominant peak. This case was repeated using the larger plate (so that the tunnel blockage was somewhat higher - 4% cf 2% based on total plate area) and the occurrence of two separate peaks was even more noticeable. The higher frequency peak was noticeable in the spectra even at z/W = 0.1, in contrast to the situation for the lower blockage ratio. Clearly, the precise nature of the ’switching’ in shedding frequency between the two values is rather sensitive to secondary influences, but it nonetheless seems certain that for a sufficiently small aspect ratio the variation in plate width across the entire span is not sufficient to support shedding (for significant periods) at more than two frequencies. Presumably it is the ratio AR/T R which is the dominant parameter determining when this occurs, but we have not studied variable AR cases for any T R other than the present (nominal) value of 40. For even smaller AR one might expect to see only a single spectral peak. An obvious further question arises concerning how small T R itself can become before multiple cells become unsustainable (even for AR = T R) and this is addressed in the following Section. It is of interest to enquire how wide a constant frequency cell can be before the ’dislocation’ in its end region, when significant shedding at other frequencies appears. Defining the
10
Figure 4: Variation of base cell width with aspect ration. Solid symbols refer to ∆z/W (axis at right). The solid line is ∆z = W (left hand axis refers) and the other lines are added for clarity. Figure 5: Wake spectra at z/L = 0.5 for various T R. E(f ) for each curve is multiplied by an arbitrary constant so that decreasing T R corresponds to lower and lower curves, from the top (T R = 20) to the bottom (T R = 1). precise end of a cell is obviously somewhat subjective. As noted above, St data are plotted in fig.3 for all those peaks in the spectrum whose heights are within a factor of five of one another. For the present purposes and consistent with that approach, we define the cell width, ∆z, as the spanwise region within which the height of the dominant peak exceeds those of any other peaks by at least this factor. Figure 4 shows the resulting variation of cell width as a function of aspect ratio. Intuitively one would expect that for a fixed taper ratio the base cell width will become independent of aspect ratio once the latter is large enough. Although there is some scatter, the data certainly have this general behaviour, with the width tending to about 9dav . Here, dav is the mean plate width (i.e. (do + dt )/2) so this value corresponds to a cell width of about 4do . ∆z/W will, of course, tend to zero as AR increases. As the aspect ratio falls the base cell tends to reduce in size and for small enough aspect ratio the cell will presumably extend all across the span, so that ∆z = W and the data should follow the line shown on the figure (this is why the dav normalisation is chosen for the left-hand ordinate). Since, as fig.3d implies, the base-cell shedding peak is visible in spectra all across the span, an alternative definition of cell-width, based for example on the spanwise region within which that frequency is visible (independent of its strength compared with other peaks), would clearly bring the AR = 5.8 data point in fig.4 in line with this expected trend.
3.2
Effects of taper ratio
We turn now to discussion of the wake characteristics for increasingly small taper ratio,
11
restricting attention to cases in which the plate tip is within the flow so that AR = T R. No endplates were used; on the basis of the data of CR it was assumed that an endplate at the tip, where d = 0, would not have a significant effect of the flow. Figure 5 shows a selection of spectra plotted against frequency (normalised by U and do ) and all obtained at z/L = 0.5 for plates having taper ratios in the range 1 ≤ T R ≥ 20. For T R ≤ 5 there is a clear shedding peak at this central location and cross-spectral measurements demonstrated that this was the signature of regular Karman shedding. Sto is in the region of 0.15 in each case. Data obtained at other positions demonstrated that this shedding occurs across the entire span, in stark contrast to what happens at higher T R, when the situation becomes more complicated. For T R = 7.5, for example, there is only a very weak peak discernible around Sto = 0.15, but a significant peak at lower Sto has appeared and the higher frequency, much broader peak is more prominent. The lower frequency peak also occurs at the smaller T R values, but only further out along the span, towards the tip. The differences between the overall behaviour for different taper ratios can be better seen by comparing sets of spectra for different T R and then comparing the variation of the various peak frequencies as z/L increases. So first, in Figure 6, three sets of spectra are shown, for T R = 20 (from CR), T R = 7.5 and T R = 3.73. Consider first the T R = 20 set shown in fig.6a. These data were discussed at length in CR; essentially they show that there is a constant frequency cell spanning the bottom 40% of the body, but higher up (larger z/L - denoted by z 0 in the figure) there is a broader peak whose frequency is such as to make the local Strouhal number, Std , constant at about 0.14 - the usual value for a parallel-sided flat plate. These peaks do not appear for lower aspect ratios (see later). Over the bottom 50% or so there are even broader, higher frequency peaks, distinct from those below and corresponding to much higher values of Std (0.25 < Std > 0.42); their source was discussed by CR. There is also some evidence of a rather broad but much lower frequency peak - not discussed in CR
12
(but see below). At T R = 7.5 (fig. 6b) the high-frequency, broad peaks can also be seen for z/L > 0.25. In this case, however, the broader peaks present for T R = 20 and corresponding to a constant Std are not present at all (nor were they there for T R=10 or 15). There is evidence that the constant frequency peaks remain and continue to larger z/L values - i.e. the base cell is rather longer - and there is also evidence of a further peak at a (constant) frequency somewhat lower than that in the base cell. This latter feature becomes rather more prominent for smaller taper ratios, as is clear for the T R = 3.73 case (fig. 6c). At these low taper ratios fig.6c also shows that the main vortex shedding peak is present all along the span. The base cell, therefore, is now no longer a base cell, but extends along the entire plate. This is in distinct contrast with the situation at higher T R but is similar to situations for much higher T R but with small AR, as discussed in the previous section. These variations are encapsulated in plots of local Strouhal number, Std , vs. z/L for each taper ratio, presented in Figure 7. Open symbols correspond to the dominant von Karman shedding peaks whereas the lower frequency, broader peaks are denoted by closed symbols. The data for T R = 20 are from CA (and see fig.1). Notice that as T R becomes smaller the range over which this peak can be seen increases until it covers the entire span, as noted for the T R = 3.73 case above. There is a clear trend in the corresponding value of Sto for these Karman-type peaks as T R decreases. This is shown by the open circle data in Figure 8, where it can be seen that Sto rises with decreasing T R (for T R < 20). (Other features of this figure are discussed later). Recall that the value for a parallel-sided flat plate is around 0.146 - shown in the figure as a horizontal line - and the value of Sto for T R = 60 is about 0.144 (see fig.1). The overall trend is non-monotonic, with an initial fall as the degree of taper first becomes significant, to a minimum of about 0.11 at T R = 20, before a subsequent rise towards the 0.146 value as T R reduces further. In the case of the
13
1.E-03
0.2
0.3 1.E-04
0.5
E(f) 1.E-05
TR=20
0.4
0.6 0.7
1.E-06
0.8 0.9
1.E-07 1.E-08 1
(a)
10
f, Hz
100
1000
1.E-02
0.13 1.E-03
TR=7.5
0.22
E(f)
1.E-06
0.41 0.31 0.5 0.59 0.78 0.87
1.E-07
0.96
1.E-04 1.E-05
0.69
1.E-08 1
(b)
10
f, Hz
100
1000
1.E-01 1.E-02
TR=3.73
0.3 0.4 0.5
E(f) 1.E-03 1.E-04
0.6 0.7 0.8
1.E-05 1.E-06
0.9
1.E-07
(c)
1
10
f, Hz
100
1000
Figure 6: Spectral sequences for three taper ratios. As in fig.5, curves are ordered vertically as indicated by the z 0 = z/L values shown for each. The dashed line in (a) follows the successive peaks which corespond to a fixed Std = 0.14; peaks indicated by the dotted line have Std > 0.25.
14 squattest plate (having α = 140o and T R = 0.36) there were no discernible spectral peaks anywhere along the span, but Sto values of about 0.18 were found for T R = 0.58 and 1.0. However, the flows around these three shortest plates are likely to be significantly influenced by the upstream boundary layer, since the h/δ values were, respectively, 0.53, 0.92 and 1.46. Indeed, it is rather surprising that Karman-type shedding occurred at all in the latter two cases. Not only is the fall of d with z very rapid but also the upstream velocity at height z rises significantly, because of the presence of the boundary layer; both these trends would presumably combine to mitigate strongly against the wake being able to maintain a constant frequency shedding cell. Cross-spectral measurements showed, however, that although spectral peaks were visible, the shedding was extremely weak, compared with that for higher T R cases - the cross-spectral coherence at the spectral peak was always below about 0.2. Interestingly, a geometrically similar, but double-sized T R = 0.58 plate yielded no spectral peaks at all. In this case, h/δ = 1.84 and one might expect the boundary layer to have less influence. We conclude that for low T R plates (at least for T R < 1) the rate of change of local plate width is sufficiently great to ensure that three-dimensional effects are strong enough to prevent regular Karman shedding. The reason for the apparent appearance of such (albeit weak) shedding when h/δ = O(1) remains unclear. The second major feature of fig.7 is the low Strouhal numbers corresponding to weak low frequency peaks (which may be ’beat’ frequencies - see later). These are discernible over at least some of the span but only in cases where T R > 2. Cross-spectral data was obtained in many of the cases, at locations where this low-frequency peak was evident as well as elsewhere. The results showed clearly that the low-frequency peak always corresponded to an in-phase motion, in contrast to the higher frequency Karman mode which, as usual, was
Figure 7: Spectral peak Strouhal numbers. Open symbols are for the dominant Karman shedding; solid symbols are the lower-frequency in-phase mode.
15
Figure 8: Variations of Sto vs. T R. The horizontal line is the parallel plate value. Vertical lines approximate to the boundaries delineating different qualitative behaviour. an asymmetric mode (motions induced by the passage of the vortices on either side of the wake were 180o out of phase, as expected for shedding from alternate sides of the body). The data seem to fall into two distinct bands: higher taper ratio cases for which the effective Sto is around 0.04, and lower T R cases (T R < 10) for which Sto is significantly higher, up to about 0.08. The various shedding regimes are shown as a function of taper ratio in Figure 8 and for convenience are identified by I-IV. The data can be summarised as follows, for gradually decreasing T R. Starting from the parallel sided plate (for which T R = ∞) finite T R first leads to the appearance of a constant frequency region at the base of the cell, with apparently no further cells outboard but a process which leads to the average local Strouhal number remaining roughly constant. This is regime I and was fully discussed in CR, but it must be recognised that data for T R > 60 have not been obtained. Once T R falls to 20, a much lower frequency shedding mode appears over a large part of the span. The frequency at any location is not an obvious integral divisor of the Karman frequency and, in any case, the shedding for this mode is symmetric (i.e. in-phase, compared with the usual out-of-phase Karman mode). Data for 20 < T R < 40 is not available, so it is not clear at precisely what T R this low-frequency mode first appears, but note that it is only visible in the upper region of the span (i.e. where d is significantly lower than its base value, do ). This is regime II. It may be that the low-frequency mode is caused by ’beating’ between the higher frequency Karman modes, which (on average) continuously change frequency (by large factors) across this upper region, but this is currently unclear. Regime III begins somewhere in the range 7.5 < T R < 10 and is characterised by a significant increase in the frequency of the in-phase, low-frequency mode and by disappearance
16
of the region away from the base cell in which the local Strouhal number remains constant. Bodies which are this squat often have ’arch vortices’ in their near wake, formed partly by an interaction between the separating shear layers and the upstream horseshoe vortex which gets wrapped around the base of the body. Such an arch vortex may well be susceptible to a low-frequency pulsing instability and it is perhaps this which distinguishes the lower frequency mode in regime III from that in regime II. Within regime III but for T R a little lower than 7.5 (but above 5) the base cell expands to cover the entire span of the body. In other words, Karman shedding occurs all along the span, at a fixed frequency despite the now rapidly changing d with spanwise position. This cannot be expected to continue and, indeed, once T R falls below about 1.7, shedding becomes very weak or disappears altogether. This is regime IV. As CR have pointed out, regular shedding can only occur in this range of T R if there is some other constraint which tends to inhibit vertical (i.e. spanwise) motions. Such constraint can be supplied by density stratification or by the presence of a free surface (see Castro et al, 2001, and Lloyd & Stansby, 1997, respectively). In all these regimes where multiple peaks appear in the spectra, it should be emphasised that any individual peak usually cannot be caused by continuous shedding at that particular frequency. Rather, for some time periods shedding at a particular frequency occurs whilst, at other intervening periods, a different frequency predominates. This must definitely be the case (as argued by CA) for Regime I, characterised in part by an extensive spanwise region in which, on average, a constant Std and thus continuously varying frequency appears. In contrast, where the dominant Karman mode at a constant frequency (varying Std ) is visible across the entire span - as in Regime III - it is perhaps more likely that this shedding is usually present (or, at least, nearly all the time and in any case modulated by the wake turbulence). The lower-frequency peak is probably evidence of a superposed in-phase mode also present all the time.
17
4
Conclusions
The general behaviour of the near-wake vortex shedding between tapered plates has been delineated for 0 < T R ≤ 60 (T R=body spanwise length divided by average cross-stream width). It has been shown that the nature of the shedding is strongly dependent on the degree of taper, with at least four regimes visible as T R decreases (from its value of ∞ for a parallel-sided plate). In some of these regimes broader, lower- and higher-frequency peaks (compared with the usual Karman, out-of-phase shedding peak) are visible and are probably a result of complex interactions between intermittent shedding at various frequencies. The lower-frequency peaks always correspond to an in-phase mode and, when they exist, are visible only in part of the span nearest the tip of the plate. For sufficiently strong taper (small T R) the geometrical three-dimensionality is sufficiently severe to prevent the appearance of any spectral peaks. However, for intermediate tapers Karman shedding of constant frequency is apparent across the entire span, despite the geometric three-dimensionality. This is perhaps something of a surprise and suggests that the initially inclined vortex lines just downstream of separation must rapidly become vertical (i.e. parallel to the plate’ symmetry axis). Larger taper ratios lead to isolated cells of constant frequency shedding, usually nearest the base of the body. However, if end plates are used to make the spanwise aspect ratio significantly lower than the taper ratio, then multiple cells each of constant frequency shedding can appear. A number of questions remain open and are the subject of further study. For example, the precise dynamics of the wake flows in cases where there are multiple shedding peaks along at least sections of the span is not clear. Multi-probe or, perhaps better, careful PIV studies will be needed to elucidate the behaviour of the vortex structures. It may be that corresponding low Reynolds number experiments for similar ranges of taper and aspect ratio would help here, since the presence of ’full-blown’ turbulence must undoubtedly obscure the
18
interactions. On the other hand, the turbulence itself may contribute intrinsically to the underlying dynamics. Despite these uncertainties, the present results have nonetheless been useful in identifying the qualitative nature of the different regimes and have quantified the resulting Strouhal number variations.
5
Acknowledgements
The authors are grateful to Jonathan Burnip and Andrew Meehan for help with some of the experiments and to the technical staff of the School of Engineering Sciences, who manufactured the various models with their customary care and without whom the work could not have been done.
6
References
CASTRO IP & ROGERS P(2002) Vortex shedding from tapered plates. Expt. in Fluids. 33, 66-74. CASTRO IP, VOSPER S, PAISLEY M & HAYDEN P (2001) Vortex shedding behind tapered obstacles in neutral and stratified flow. Dyn. Atmos. & Oceans 34, 145-163. GASTER M (1969) Vortex shedding from slender cones at low Reynolds numbers. J. Fluid Mech. 38, 565-576. GASTER M (1972) Vortex shedding from cones.
In: Eichelbrenner EA (ed) IUTAM
Symposium ”Recent research in unsteady boundary layers”, 1971, Vol.2. Less Presses de l’Universite Lavel, Quebec. GASTER M & PONSFORD P (1984) The flows over tapered plates normal to an airstream. Aero J. 88, 206-212. LLOYD PM & STANSBY PK (1997) Shallow water flow around model conical islands of small side slope. Part II. Submerged. J. Hydrol. Eng. 123, 1068-1077.
19
PAPANGELLOU A (1992) Vortex shedding from slender cones at low Reynolds number. J. Fluid Mech. 242, 299-321. MAULL D & YOUNG A (1972) Vortex shedding from bluff bodies in shear flow. J. Fluid Mech. 60, 401-409. WILLIAMSON C H K (1996) Vortex dynamics in the cylinder wake. Ann. Rev. Fluid Mech. 28, 477-539.