straightness monitor systems during the GEM Muon Alignment R&D ..... many emerging commercial media applications, thus will be aggressively developed,.
GEM-TN-93-331
Testing and Development of Extended Range Straightness Monitor Systems J. Paradiso Draper Laboratory May 1994
Abstract
This is essentially an archival document that summarizes the results of several tests performed at the Draper Laboratory on extended-range straightness monitor systems during the GEM Muon Alignment R&D activity. Two systems are discussed; standard 3-point LED/Lens/Quad-cell Straight Line Monitors (SLM) with multi-LED blocks, and the Video Straightness Monitor (VSM). Included are measurements of thermal sensitivity, turbulence effects, resolution dependence on lens width, defocus tolerance, VSM mask illumination, measurement of VSM mask rotation, and a discussion of component mounting/calibration.
Testing and Development of Extended Range Straightness Monitor Systems GEM-TN-93-331 by: J. Paradiso Draper Laboratory
May, 1994
Table of Contents: 1) Introduction and GEM Implementation................................................................... 1 2) The LED-Block SLM ............................................................................................... 5 3) The Video Straightness Monitor (VSM) System...................................................... 14 4) Mask Illumination..................................................................................................... 22 5) Effects from Mask Mounting.................................................................................... 30 6) Mask Rotation........................................................................................................... 32 7) Defocus ..................................................................................................................... 36 8) Effect of Changing the Lens Aperture ...................................................................... 38 9) Thermal Effects and Turbulence .............................................................................. 42 10) Long-Term Drift ....................................................................................................... 47 11) Mounting and Calibration of VSM Components...................................................... 49 12) Conclusions............................................................................................................... 54 13) Acknowledgments .................................................................................................... 55 14) References................................................................................................................. 56
Testing and Development of Extended Range Straightness Monitor Systems -- J. Paradiso, May 1994 1) Introduction and GEM Implementation In order to measure muon momentum with high precision at high energies in the GEM detector (i.e. ∆pt/pt ≈ 5% for the barrel at pt = 500 GeV/c), a system of three muon superlayers must resolve the muon sagitta to within a net error of σ = 55 µm 1 . Fig. 1 gives a summary of all errors included in this budget, and illustrates how they combine to this total. After accounting for the chamber resolution and mechanical tolerances1 (weighted in the radical by the inverse of the number of layers per superlayer [NL = 6]; it is assumed that these errors are identical for all superlayers) together with multiple scattering, an error of σ = 25 µm is allotted to measuring the superlayer alignment, as projected onto the sagitta coordinate. Fig. 2 is a simpler view of this situation, and shows how a misaligned superlayer translates into a momentum measurement error. Rather than placing the chambers precisely and requiring a muon support structure to hold this level of accuracy, the superlayer misalignment was to have been periodically monitored, and the resulting measurements used to update the muon chamber positions during track reconstruction. As depicted in Fig. 3, the philosophy of "projective alignment" was adopted in GEM, where the interlayer sagitta error is measured orthogonal to straight lines pointing back to the interaction point. Since these projective paths roughly follow the trajectory of a high-momentum muon track, these measurements correspond to the misalignment that would be encountered by a muon track traveling along the alignment line. The basic concept of projective muon alignment was introduced in the proposal by the L★ collaboration2 , then carried along to GEM 3 , where it evolved considerably, and is now a contender at future experiments such as ATLAS4. The GEM adaptation was to measure the error from several projective lines (at fiducials placed on the inner, middle, and outer superlayers) distributed about the perimeter of an alignment tower, as shown in Fig. 3. These each detect the sagitta error that would be encountered by a muon collinear with the alignment path. To estimate the error that a muon would see inside the tower, the alignment measurements made on the chamber perimeters are appropriately blended via a linear/quadratic interpolation algorithm5 . Several simulations have been performed 5,6,7 to guarantee that a series of interpolated 3-point alignment measurements, taken at the appropriate points (as shown in Fig. 3), will compensate sagitta errors across muon towers with large (i.e. mm\mr-level) translations and rotations in their component superlayers (Fig. 4).
1
∆pt /p t = 5% @ p t= 500 GeV ➾ σsag ≤ 55 µm Strip Placement error
Intrinsic Measurement error
σs /s
σc h
Fiducialization error
Error Source
σf i d
RMS Value (µm)
Layer/Layer error
Outer superlayer
σ L/L
Chamber fiducial
Layer fiducial
Sagittaerror measurement accuracy
Middle superlayer
Inner superlayer
σalg
σsag
=
1.5
Intrinsic chamber measurement Multiple scattering (p = 500 GeV) Strip to strip fiducial placement Layer to layer placement
75 5 17 50
Fiducialization placement
10
Superlayer to superlayer alignment
25
2 + σ 2 + σ2 σch L/L s /s
NL
2 2 2 + σfid + σalg + σms = 54 µm
Figure 1: Error budget for GEM muon alignment
Detector Misalignment (from projective line)
Reconstructed muon track from detector measurements with error from false sagitta
→
B
⊗
False Sagitta True Sagitta
Inner Detector Layer
Actual Track of muon particle in magnetic field B
Middle Detector Layer
Outer Detector Layer
Figure 2: Muon momentum error from misaligned superlayer
2
Detector
Lens
Source
y x P
P
z
IP
Figure 3: Projective muon alignment in a GEM barrel tower Sagitta Residual After Alignment Correction
Sagitta Errors Before Alignment Correction
ε
ε
mm 4.0
mm 0.02 0.01
2.0
0.00 -0.01
0.0
-0.02 85
85 80
Th
eta 75 70 (de g) 65
2 0 -2
Phi
80
Th
eta 75 70 (de g) 65
) deg
(
= 1.1 mm
2 0 -2
Phi
g) (de
= 5.0 µm
Figure 4: Sagitta errors in a projective alignment tower before & after alignment correction
The alignment system of Fig. 3 considerably relaxes the tolerance imposed on the mechanical positioning of the muon superlayers; as shown in Fig. 5, simulations 8 have dictated that a projective/interpolating alignment system with a resolution of 25 µm per monitor will enable chambers to be positioned within several millimeters and milliradians of their nominal locations, and still attenuate sagitta errors below the 25 µm limit. Toward the conclusion of the GEM program, studies were underway into incorporating other alignment information (i.e. from measurements of background muons9 and the
3
Muon Barrel Tower Positioning Accuracy
Note: Displacements relative to inner layer m
± 3 mm
±3m
± 1.5 mrad
± ± 5 mrad
± 1.5 mm
± 1.5
3
m
m
rad
m
±
m 1.5 m
Muon Endcap Tower Positioning Accuracy ± 3 mm
± 1 mrad
± ± 3 mrad
1.
5
±3
m
m
mm
± 5 mrad
±3
mm
± 1.5 mm
± 1.
5m
rad
m
± 3 mrad
mm
.5
±1
rad
.5 m
±1m
±1
±1
± 1.5
ad
mr
mra
±1m
rad
Z Y
Dz,Dr = ±30 mm Interaction Point X
Figure 5: Maximum allowed local deflections and rotations in an alignment tower
sagitta-orthogonal alignment monitor readings) in an optimal (i.e. least-squares) estimator10, potentially relaxing these position tolerances even further. In its final months, the alignment scheme for the GEM muon barrel evolved into an "axial/projective" configuration, outlined in Fig. 6 (this is a simplified schematic not showing chamber Lorentz tilt, etc.). Here, we combine two types of alignment systems in each muon tower; an axial multipoint monitor (i.e. a stretched wire) to transfer the positioning of the various chambers in a superlayer into precise "alignment reference bars", and an interlayer 3-point projective system that measures the sagitta errors across these bars. This removes the need to place projective monitors inside the barrel at intermediate θ, which leads to acceptance losses, among other difficulties1,11. This arrives at a price, however, in that the alignment subsystems (wire and projective 4
d
3-Point Projective Optical Alignment Paths
2-Coordinate Wire Pickoffs
s
ire
tW
en
m gn
i
d he
Al
tc
re
St
SL3
.
SL2
Alignment Reference Bars
Alignment Reference Bars
SL1 3-Point Projective Optical Alignment Paths
Figure 6: Axial/Projective alignment as applied to GEM barrel module
monitors) now hand off to one another through additional transfers. In order to keep the error budget constrained as in Fig. 1, the performance of the alignment subsystems must be even tighter. Simulations7 have indicated that a wire system with 10 µm sagittacoordinate resolution (as seen in tests12) will suffice nicely with a projective monitor that resolves at the 15 µm level. The GEM alignment requirements thus requested a 3-point sagitta-error monitor with resolution around σ = 15 µm and a dynamic range on the order of a centimeter (thereby exploiting the loosened positioning constraints). This document details the systems that were designed and prototyped to meet this need. The axial monitor development has been described elsewhere 7,11,12,13. 2) The LED-Block SLM Three-point optical straightness monitors (SLM's) were first developed14 for the L3 muon detector at LEP, where they were deployed as the RASNIK15 system. These are simple devices composed of a light source, lens, and position-sensitive photodetector, as shown in Fig. 7. An image of a smooth-aperture, collimated source (i.e. LED) is projected onto a planar detector (i.e. quadrant photodiode) through a focusing lens. Displacements of the lens from the line between source and detector are measured as a shift in the illumination centroid at the photodiode.
5
LED LED
Quad Photodiode
Lens Lens
dx dx
dy dy
S
2S
Figure 7: The standard RASNIK straight line monitor system (SLM)
Figure 8: Scan across SLM quad-cell, showing limited measurement range
With the lens at the midpoint, these devices have an implicit gain of two in the sagitta measurement; the offset read at the detector is twice the 3-point sagitta error, as diagrammed in Fig. 7. The measured displacement is relatively insensitive to rotations of the lens and LED (provided it exhibits a symmetric illumination profile) about their optical axes. The LED is modulated by a low-frequency carrier, and synchronously detected to minimize the effects of any ambient light background16. One straightness monitor component is fixed to each superlayer package such that it precisely references the cathode or wire plane of one composite chamber layer; incident charged tracks (and/or X-rays from a calibration table1 ) will rapidly determine the displacement of the
6
Quad photodiode
Lens Lens
LED Array
dx
dy
Figure 9: Multiple LED straightness monitor for extended range
mounted layer (hence the alignment element) with respect to the superlayer mean to better than σ = 10 µm. This is discussed further in Sec. 11. Although these simple LED/Lens/Quad-cell systems are proven to provide high accuracy in deployed detector systems (i.e. below 5 µm 15,17) at minimal cost, their useful measurement range is generally restricted to within a millimeter or two, as depicted in the data of Fig. 8, where one can note the linear measurement range quickly saturating as the illumination is displaced off to either side of the quad cell. The range of these alignment systems may be extended a bit by defocusing (as shown in Fig. 8), and boosted further by replacing the quad cell by a continuous lateral-effect photodiode18, or by employing a wide-area diffuser over the LED and using a larger quadrant diode 19. These techniques, however, can appreciably increase the hardware expense and/or potentially degrade the alignment resolution beyond the 25 µm limit. An alternative solution is provided by replacing the single source of Fig. 7 with an array of LED's or optical fibers; by placing LED's sufficiently close together (such that their measurement range will overlap with adequate defocus) and pulsing them individually, precision measurements may be obtained over a range limited only by the size of the LED matrix (Fig. 9). By employing a local counter, only three logic lines are required to illuminate any LED in the matrix; i.e. one to cycle the counter (and address the next LED), one to reset the counter, and one to modulate the LED intensity (filtering out effects of background light16). Inexpensive commercial LED arrays developed for alphanumeric displays have been evaluated for their utility in this scheme. Several LED blocks have been examined; most, however, either have very large LED's spaced too far apart (intended for wallmounted displays), or have tiny LED's packed in a denser configuration (used for display windows on devices), which yield insufficient intensity.
7
The best compromise appears to be the units with ø = 2 mm LED's packed in a 2.5 mm matrix; i.e. devices such as the Sharp LT5106D 8x8 array or the LiteOn LTP757HR 5x7 array. This spacing is still a bit wide, but with sufficient defocus, the linear regions of each LED can be made to overlap. One of these LiteOn devices has been tested for its SLM application. Fig. 10 shows the left\right difference-over-summed outputs of a quad-cell as the lens is scanned along the x-axis (Fig. 8), through the range of four adjacent LED's, each of which was separately illuminated, as sketched above. The linear measurement regions (upper plot) are seen to "leapfrog", extending a precision measurement across 5 mm of lens displacement (1 cm at the detector). The lower plot shows the scan-orthogonal quad-cell response (up\down difference-over-sum) with the same vertical scale; one sees that the scan axis was slightly tilted with respect to the quad-cell, but the vertical measurement remained in its linear range throughout the scan. Figs. 11-16 show a deeper analysis of the x-axis signals in Fig. 10. First, the linear region of each LED was fit to a least-squares line, as shown in Fig. 11. Next, the response to each LED was biased up to fit along a line with slope averaged over the leastsquare fits in Fig. 10, thereby accounting for the position of each LED in the matrix (Fig. 12). Residuals from this common line are plotted for all LED data in Fig. 13, and for the linear region in Fig. 14. The so-called "linear" region is not quite so linear in practice, as plotted in Fig. 14. Before leapfrogging to the next LED in the sequence, the quad-cell measurement began to approach saturation, leading to the circa 40 µm departures evident in Fig. 14. If one restricts the data to an even tighter range around each LED, as in Fig. 15, the residuals begin to come into the range desired at GEM (the data indicates errors on the order of 8 µm RMS), but there are now large (circa 700 µm) gaps in the scan coverage. Figs. 14 and 15 indicate significant structure in the linear residuals; the generic response appears somewhat cubic, and is due to the distribution of LED illumination. Indeed, such correction factors have been applied19 to the quad-cell data to extend the high-resolution measurement range. As can be noted in Figs. 14/15, however, this parameterization is significantly different for each LED, hence an LED block must be scan calibrated if one wishes to adopt this approach to reducing residuals. Fig. 16 shows the deviation in the reconstructed midpoint of each LED from the common line. The listed average is 1.3 mm; since this is relative to lens displacement, it indicates that the LED's are placed 2.6 mm apart. This is a bit larger than the manufacturer's specification of a 2.5 mm pitch; the difference is probably due to a small amount of magnification introduced through the axial lens placement and defocus.
8
Raw LED Readouts, deflection coordinate
Normalized Quad Cell Output
1.5
LED #1
LED #2
1
LED #3
LED #4
0.5 0 -0.5 -1 -1.5
0
1000
2000
3000
4000
5000
6000
7000
6000
7000
Lens Displacement (µm)
Scan axis output Raw LED Readouts, orthogonal coordinate
Normalized Quad Cell Output
1.5 1 0.5
LED #2
LED #1
LED #3
LED #4
0 -0.5 -1 -1.5
0
1000
2000
3000
4000
5000
Lens Displacement (µm)
Scan-orthogonal output Figure 10: Quad-cell response across a block of 4 LED's
9
3 2 1 0 -1 -2 -3
0
1000
2000
3000
4000
5000
6000
7000
6000
7000
Lens Displacement (µm) Figure 11: Least-Square fits to linear regions
10 8 6 4 2 0 -2 -4
0
1000
2000
3000
4000
5000
Lens Displacement (µm) Figure 12: Quad-cell data after being offset to common line
10
Full Residuals
1000
µm Residual
500 0 -500
-1000 -1500
0
1000
2000
3000
4000
5000
6000
7000
Lens Displacement (µm)
RMS: 401.4 µm
Figure 13: Residuals from common line
Tighter Residuals
60
µm Residual
40 20 0 -20 -40 -60 1000 RMS: 21.26 µm
2000
3000
4000
5000
Lens Displacement (µm) Figure 14: Linear-range residuals from common line
11
6000
Tightest Residuals
.
30
µm Residual
20 10 0 -10 -20 1000
2000
3000
4000
5000
6000
Lens Displacement (µm)
RMS: 8.346 µm
Figure 15: Inner-range residuals from common line
LED Midpoint Residuals
µm Residual
10
5
0
-5
1.5 1 Average: 1302 µm RMS: 5.909 µm
2
2.5
3
3.5
Lens Displacement (µm)
Figure 16: Deviation in reconstructed LED midpoint spacing
12
4
More importantly, the LED's seemed to be placed reasonably accurately (typically within 10-20 µm, remembering the factor of 2 on the data of Fig. 16), however the discrepancy is a little large for GEM application (note that even perfect mechanical placement does not guarantee that the LED illumination will be centered at its proper locations). Several problems thus seem endemic to such commercial LED blocks. First, the common 2.5 mm LED pitch is a bit too wide, creating coverage gaps or forcing considerable defocus (which can reduce net accuracy). Second, the response and optical centering of each LED are borderline; for the 15 µm net GEM accuracy, each LED block may need to be scan-calibrated and results corrected via an on-line lookup. Finally, there is yet another disadvantage, namely that the light output is still not terribly high in the units that were tested. With the readout electronics that were employed in these tests20, the system could not be effectively used when the distance between the LED block and quad-cell surpassed 2 meters (these results employed a 1.6 meter spacing). Since the GEM system assumed paths ranging up to 9 meters, this presents a significant difficulty; upon examination, however, it appeared that illumination sensitivity could be boosted appreciably at the detector by increasing the gain of the front-end circuitry. Rather than employ such commercial LED blocks, one could fabricate custom blocks with superior LED's placed at a finer pitch. Indeed, this was considered; either by mounting the LED's themselves onto a template and scan-calibrating, or launching the LED illumination into glass fibers, which are themselves placed into precision holes perforating the template. Several LED's were evaluated for their application in single-and-multi-LED SLM systems. Two are presented in Fig. 17, which was obtained by replacing the quad-cell at the focal plane of the SLM system with an imaging array. The lens was adjusted for its sharpest focus, and the images stored in a conventional frame-grabber. The infra-red LED's used in the SLM's developed for the Harvard/SDC effort17 (i.e. the Motorola MFOE1101) exhibit a very smooth illumination profile (Fig. 17, middle) and are collimated to throw most of their light forward (note the nicely concentrated circle of illumination), thus are very efficient. A block made of such devices could be quite effective over longer optical paths. Other devices that were tested (such as the Siemens SFH480) produced considerable light, but yielded a less concentrated and uniform illumination (Fig. 17, left; note the splotches and wider radius), implying a potential need for additional calibration or diffusing for each LED. Finally, the quality of the lens used in the SLM systems can exert some bearing on the system sensitivity and performance. The images shown at left and middle in
13
Figure 17: Images of LED spots at SLM focal plane
Fig. 17 were focused using a good-quality Melles Griot lens in a 9-meter SLM system, and appear fairly sharp. The image at right used an eyeglass blank21 of considerably less quality (i.e. priced well under $1. in single units); the distortion and aberration is considerable, plus this lens can not be properly centered, leading to rotational sensitivity. Granted, this comparison is somewhat extreme; it serves to emphasize that the use of a lowest-quality lens in this application may lead to problems.
3) The Video Straightness Monitor (VSM) System The LED-Block SLM system described in the previous section is far from optimal; it is basically a "fix" imposed on the standard RASNIK setup that adds more complication; i.e. the need to precisely build and/or scan calibrate an array of LED's. The development of this architecture was thus not pursued further under GEM R&D. It was supplanted by the superior (and ultimately simpler) concept of the Video Straightness Monitor 22 , which was co-developed by Draper Laboratory2 3 and NIKHEF in Amsterdam24. The philosophy behind this idea begins with the setup in Fig. 17. Instead of putting a quadrant photodiode at the focal plane, place an imaging array there to collect much more information (i.e. tens of thousands of pixels, as opposed to only four). Likewise, instead of imaging a simple spot25, as in Fig. 17 , project a complicated pattern.
14
Coded Mask Photodetector (Imaging Array)
Light Source (i.e. LED/field lens) Lens
Projected Mask Image
Figure 18: Video straightness monitor (VSM) scheme
This concept is illustrated in Fig. 18, and has two major advantages. First, since the image is projected and detected over a full frame with many pixels, there is much more tolerance to local defects in the projected image and the focal plane array (this relieves much of the tedious calibration and component selection needed in SLM systems). Second, the operating range is greatly increased. Only a portion of the projected image need be seen by the sensitive array; if it is unambiguous, a correlation with the mask template will determine the offset between the array and the image. Recent advances in imaging technology and related microelectronics have dramatically reduced the cost and size of solid-state video cameras and image processing hardware. Highly integrated monochrome cameras are now available26 on circuit cards that measure under 35 x 35 mm. They are self-contained, in that they typically require only 12 V of power and will output composite RS-170 video onto a 75 Ω cable. These units are quite inexpensive, costing below $100 in moderate quantities. Although most of these devices still employ several integrated circuits and discrete components (surfacemount devices packed together densely, as in a typical Walkman), some are now packaged on a single chip27 , which incorporates the imaging array with all video formatting and analog signal processing. This technology has an exploding future in many emerging commercial media applications, thus will be aggressively developed, leading to further reductions in price and improved performance. As depicted in Fig. 19, the implementation of such a system at a large detector such as GEM is very simple, potentially even more straightforward than an equivalent SLM deployment. All video outputs in a segment of the detector are routed to a multiplexer16 (if the cameras can also be powered through the video coax, only one cable 15
LED Illumination Composite Video
... Power (12 V) Frame Grabber
Multiplexer
RS-170 Chip or SS camera card
LAN
µ-computer
RS-170 Video
Detector Site
Detector sites (per module)
Figure 19: Multiplexed application of a system with several VSM sites
Start: Address first imager input to multiplexer
Grab series of video frames from addressed imager
Average sequential frames to attenuate atmospheric effects
Address next imager input to multiplexer
Correlate displaced frame images to stored mask template
Output alignment parameters from correlation shifts
Alignment Data Figure 20: Structure of a generic VSM analysis software package
is needed per camera site). When acquiring data, the supervisory processor addresses the multiplexer for the appropriate camera and activates the corresponding LED illuminator. Granted, we lose the ability to easily do synchronous detection16 here, but this is much more important for SLM's, where extraneous light can severely affect the centroid balance; as it stands, the illumination of the mask poses little problem, as will be described in Sec. 4. A series of frames is then acquired at each site and averaged to attenuate transient thermal disturbance (tests in the laboratory have indicated that averaging frames at 1 Hz for 15 seconds is sufficient; see Sec. 9), whereupon a simple correlation analysis fits the
16
Figure 21: Precise PostScript-generated barcode used in Draper tests, measuring 2.4 by 2.4 cm
mask offsets to the stored template, producing the required alignment measurements. This generic procedure is diagrammed in Fig. 20. The component selection is not critical. Because of jitter in the phase-lock loop circuitry, standard asynchronous consumer-quality frame grabbers typically are able to resolve no better than 20% of the pixel pitch28,29 after they warm up, thus producing under 4 microns of error with a typical imaging array, which is adequate for the intended application at GEM. The processing requirements are also minimal when using an efficient mask coding and analysis procedure, as described below. The projected mask may be formatted in various ways. The most direct implementation of the VSM technique would be to image a mask of complicated (i.e. 17
pseudorandom) features, and derive the alignment measurement by cross-correlating the captured image to the mask template. This process can be computationally demanding, however, especially if the lens magnification is not precisely known, or there is no coarse a priori knowledge of the mask offset. The amount of useful information encoded in the image (hence the length of possible codes, thus range of measurement) is limited by the resolution of the optical system and imaging array. The full 2-dimensional frame can be used to define complicated codes, which can produce enormous range, but also increase the susceptibility to errors and lead to considerable computation requirements. A simple, redundant 2-dimensional barcode has been developed as an appropriate compromise. While it doesn't deliver as wide a range as possible, the barcode technique entails a trivial amount of processing overhead, and is quite tolerant of local mask/imager errors, as it spreads its information evenly across the entire frame. The 2.4 cm barcode mask (Fig. 21) used in the Draper tests already produces more than enough range for the intended implementations at GEM and ATLAS. The 2D correlation is unnecessary when using the coincident 2-dimensional barcoding scheme23 shown in Fig. 21. This is a superposition of two barcodes; one with vertical bars (running black-on-white), and another with horizontal bars (running whiteon-black). By summing all pixel rows together to form a vertical (y) projection, and summing all pixel columns together to form a horizontal (x) projection (plus inverting the x data to reverse the negative image), calculating the offset of the video frame breaks into an independent 1-dimensional correlation on each of these projections. The barcode of Fig. 21 has been programmed entirely in PostScript, thus the features are absolutely accurate to the resolution of the output device. The code is broken into 16 "digits", each of which begins with a thick bar; the digit's value is determined by the distance to the next thick bar and the number\placement of thin bars encountered within this span. An 8-bar "comb" pattern has been appended to the edges of the main barcode to provide good resolution reaching beyond the edges of the basic code. An analysis program (Fig. 22) has been written to process the X\Y projections of frame data. Fig. 23 shows a typical projection plot, annotated to describe the processes in Fig. 22. First, the data is slightly low pass filtered (to remove noise) and lightly high pass filtered (to attenuate baseline shifts), then discriminated by a floating threshold, recovering the barcode. Phase-invariant filters are used to avoid offset shifts. This code is then "read", identifying the coarse mask offset. The centroids of all peaks (bars) and symmetric valleys (between evenly-spaced bars) are taken from the projection data, and least-squares-fit to their presumed location in the mask template. This fit relates the
18
(Note: sensitivity to thermal turbulence may be reduced if each frame is analyzed before averaging, at the expense of increased computation load)
Start: Address first imager at the multiplexer
Grab series of video frames from addressed imager
Average sequential projections to attenuate atmospheric effects
Take X,Y frame projections
Threshold and filter projection data Extract and parse barcode segment
If code segment is unreadable
Identify parsed segment in master barcode template
Determine centroids of all relevant bar/valley features
Fit measured centroid positions to barcode template
If necessary, cross-correlate displaced projections to stored mask template (start with above fit results if available)
Address next imager input to multiplexer
Output alignment parameters from fit results and/or correlation
Alignment Data
Figure 22: Techniques of analyzing a 2D coincident barcode mask image
imager coordinates (in pixels) from the captured frame to the coordinate system that was used to generate the barcode; i.e. solve for α and β in the relation: 1)
xbarcode = α xpixels + β
where xpixels is a vector of detected feature centroids (in pixels) and xbarcode is a vector of the corresponding feature positions in the barcode template (in mm). In addition to the mask offset (β), which is the desired alignment parameter, this technique also produces a
19
Relevant segment of barcode template Video Projection: X; Frame 27
100 8(3)
Sequence (digit) of parsed barcode segment Barcode discriminated from data over threshold + = Parsed barcode peak, x = Peak from unread code, o = Valley centroid Threshold from clipped LPF of data
9(14)
Intensity
80 60 40
Lightly filtered X-projection of video data
20 0 0 100 Offset: 8.452 Slope: 7.124 Sigma: 1.201 \ 1.316
200
300 Pixels
400
500
No Codes: 2
Figure 23: Analysis of X-projection from captured frame
scale factor (α) that quantifies the magnification between mask and imager. By assuming the center of the imaging array as the local coordinate origin for x pixels, this system is insensitive to mild rotations and scale shifts (the rotations may also be precisely determined, as outlined in Sec. 6). This analysis package has been coded in the MATLAB30 interpreter on a Macintosh II computer, where the alignment of a frame is calculated within a couple of seconds. By writing tighter code that is compiled in a language such as C, one can easily expect a huge gain in speed, allowing full analysis at the 30 Hz frame rate if needed. Additional details on the barcodes and analysis software are given in Ref. [23]. In addition to the above fit technique, another approach was examined, where the barcode template was fit to the entire frame projection (the code was not actually read and no features were extracted) by maximizing the correlation integral and minimizing chi-square. This technique was used when analyzing the thermal data in Sec. 9. Because of offset shifts, tails, etc. created by the optical point-spread function, this method, in general, produced less accurate results, although the performance may improve after appropriate data filtering. By selecting particular features, such background effects are reduced. At the very least, cross-correlation can serve as a fallback, as depicted in Fig. 22 for cases where the images are of very poor quality, and coherent codes can not be easily extracted. The remainder of this document describes a series of tests that were performed on a prototype VSM system. An 8-meter optical baseline (barcode\camera distance) was set up on a 5x12 foot optical table, as depicted in Fig. 24 (the monitor shows an actual display of the barcode as seen by the camera). A 2-meter focal length, 42 mm diameter lens was used at the midpoint to image the barcode at 1:1 magnification. A Chinon
20
.
Figure 24: VSM prototype as set up on an optics table at Draper
CX-102 mini-camera26 was used, featuring a switched MOS photodiode matrix of 324 × 246 pixels across a
/3" diagonal area. The lens was removed from the camera; all imaging is performed by the 42 mm lens at the baseline's midpoint, described above. In order to collimate away ambient light, a narrow cardboard tube roughly 10 cm in length was mounted over the sensitive array. In Fig. 24, the illuminator, condenser lens, and mask are at lower-middle left, the imaging lens is at the upper left of the table, and the camera is to the right of the monitor. In all, a system of 4 mirrors was used to fold the 8meter path onto the table. Video data was acquired and averaged via a Data Translation DT2861 frame grabber in an IBM PC, where it was projected into horizontal and vertical rows, then transported to a Macintosh II for analysis, where the procedure of Fig. 22 was coded in MATLAB. Investigations 16 were conducted into porting the entire process over to the Macintosh and heavily multiplexing the inputs for application at the GEM Alignment Test Stand31. Because the Data Translation grabber used only 8-bit integer arithmetic, 1
21
Lens (50 mm dia, 10 cm focal length)
Mask
LED Mot oro la MFOE 1102 IR LED
10 cm
Figure 25: Illumination of mask with single IR LED
the 8-bit gray scale in each original frame was decimated to a 4 bit range in order to avoid numeric overflow in the 15-frame average. Although this practice would be unnecessary with other grabber/computer configurations, it presented little problem; there was still ample dynamic range in the frame-averaged data. The PostScript barcode of Fig. 22 was used in all tests. It was originally printed across a full page using a Linotronic 200 printer with 1200 DPI resolution, and photographically reduced by a factor of 7 (down to 24 x 24 mm) onto a conventional 7-mil high-contrast negative, which was back-illuminated using LED's and a condenser lens (further detail on this is given in Sec. 4 below). Future tests would have employed chrome-on-glass masks made directly from the barcode template, with features accurate to 0.1 µm. In the scan tests, the lens was translated, and its position computer-monitored by an Ono-Sokki DG-925 precision digital linear gauge, accurate to better than a micron across a range of 2.5 cm. The lens displacements are thus quoted in the scan plots; because of the geometry, the corresponding displacements at the source and detector are a factor of two larger. The scans weren't entirely automated; one had to advance the lens on a motorized micrometer, then command the computers to grab the frames and read the gauge. As a result, the scans took roughly 45 minutes each (sampling every 250 µm over 12 mm of lens motion). 4) Mask Illumination Illuminating the mask for tests in the lab proved to be very simple; the combination of LED and condenser lens worked very well. The compact, uniform, and efficient illumination of a large mask (as would be required in practice), however, is an
22
Lens Edmund Sci. #R32,564 (45mm dia.)
Ground Glass
Mask
LED Radio Shack 5000 MCD Jumbo Red LED #276-086
54 mm
Figure 26: Illumination of mask with single visible LED
area which still could use development. At the conclusion of GEM, this remained sub-optimal. Fig. 25 shows the illuminator used in the initial 1993 tests, and depicts an actual frame taken with this setup using the CX-102 camera across an 8-meter optical path. Here, one of the Motorola IR (850 nm) LED's from the SLM setup was used as the light source. Because it produces a smooth profile of intense light (running at roughly 50 mA), it is well suited to this task. It is somewhat collimated by its own internal optics, however, and throws most light into a ±10° cone around its axis. As this is still too wide to use by itself over long baselines, a condenser lens was added to further confine the illumination. This is similar to what is done in a conventional slide projector; the condenser ideally focuses the light source into the imaging lens, producing a smooth illumination across the projection. Since the imaging lens is at such a large distance here, the light source, in practice, is placed very close to the condenser's focal plane. Because of the relatively narrow emittance angle emerging from this LED, the condenser had to be placed appreciably forward in order to illuminate all of the 2.4 cm square barcode. This resulted in the choice of a condenser lens with a 10 cm focal length, which produced a net LED/condenser/barcode assembly roughly 15 cm in extent (this setup is seen at the bottom of Fig. 24); certainly too large for practical application. As a first step in collapsing this setup, a shorter lens was chosen (f = 54 mm), allowing an LED with a broader illumination angle to be brought significantly closer; this is the setup shown in Fig. 26. To make the setup adjustment simpler, a red visible LED was chosen. This LED was indeed extremely bright (running a bit over 50 mA), but produced a very uneven illumination profile, due to the physical layout of the LED chip
23
Lens Edmund Sci. #R32,564 (45mm dia.)
Ground Glass LED Bank Radio Shack 5000 MCD Jumbo Red LED #276-086
Mask 3 cm
7 cm
Figure 27: Illumination of mask with bank of 5 visible LED's
and the built-in lens which again threw most light forward, and projected an annular distribution. A diffuser was thus added immediately in front of the LED to smooth the illumination. A sample frame taken with this setup is shown in Fig. 26, where one can see that the contrast is not nearly as good as obtained with the setup of Fig. 25. Although this arises from several factors, the major contribution is a loss of efficiency at the groundglass diffuser. Because the IR LED in Fig. 25 exhibited a sufficiently even spatial profile, a diffuser was unnecessary, leading to much greater illumination efficiency. Rather than locate a more uniform LED with broader illumination angle, a bruteforce improvement was pursued to improve this situation, as depicted in Fig. 27. Here, an array of the same red LED's was used; 5 in all, pointed at the diffuser, which is now offset roughly 3 cm from the LED plane. The LED's were all pointed separately such that the superposition of their projected spots filled a roughly uniform, sizable region of the diffuser, which was now placed near the condenser focus. This provided the large, homogeneous light source needed by this condenser lens to illuminate the mask, thus more intensity was projected across a larger area of the barcode, as seen in the sample frame of Fig. 27. Granted, this is far from ideal for several reasons; it consumes considerable current (circa 400 mA for all LED's), still has hotspots (the LED's don't perfectly superimpose, thus there is illumination rise and fall across the mask image), and the net illuminator baseline is again beyond 10 cm. It was adequate for the final lab tests performed at the GEM close-out, but still diverges from what is ultimately needed. Several suggestions can be made for improving this design. The setup in Fig. 26 would be attractive if an efficient, smooth light source with an output angle around ±25°
24
or irr
M
Condenser Lens
LED
Mask
Figure 28: Compact folded-baseline illuminator
could be located, and the diffuser thus dispensed. The illuminator baseline could be shortened still further by folding the optical path with a mirror, as depicted in Fig. 28. The infra-red LED used in the early tests (Fig. 26) was nearly ideal, except for its narrow illumination angle. There are several benefits from using an infra-red device; running in the IR can provide a bit more efficiency in the photodetector and aid in attenuating ambient light when placing an IR filter before the camera. The difficulties in adjusting a setup with invisible illumination, however, can be considerable. Other, more radical illumination concepts are possible; i.e. use of an edge-lit hologram behind the mask for extremely compact illumination, such as is under consideration for LCD panel displays33, or front-illuminating an opaque mask with a flash triggered during the frame integration period (this allows the coded mask to be printed directly onto the detector surface, without adding alignment transfer errors). In general, the illumination requirements are loosening as the camera technology advances26 and inexpensive arrays become more sensitive. In order to quantitatively examine the sensitivity of this system to the transverse position of the condenser lens, the condenser was scanned vertically through the illumination maximum (the "LED bank" setup of Fig. 27 was used). The illumination at the camera location (8 meters from the source) was monitored with a collimated silicon solar cell. Results are shown in Fig. 29, where one notes a smooth, almost Gaussian profile having a roughly 4 mm width. Replacing the solar cell with the camera, Fig. 30 shows sample frames taken when the condenser was properly aligned (right) and when it was displaced 5 mm from the maximum (left). Although the camera AGC and normalization in the frame averaging routine do their best to correct for the lack of light, the dynamic range is negligible in the poorly illuminated frame. Fig. 31 takes this a bit further by analyzing a set of frame projections that were grabbed across the condenser scan. The top row shows actual projections (see Fig. 23) that were derived from video frames taken at condenser displacements of 500 µm. 25
..
Measured Luminosity vs. Y-axis Field Lens Shift
Detected Luminosity (mV)
3.5 3 2.5 2 1.5 1 0.5 0
0
2
4
6
8
10
12
Field Lens Displacement (mm) Figure 29: Luminosity measured by solar cell as a function of condenser displacement
Figure 30: Sample frames, with condenser displaced and centered
The left plot shows the horizontal (X) projections, and the right plot shows the vertical (y) projections. The "bumps" corresponding to the barcode features can be seen quite clearly when the condenser is centered, and are much less pronounced where there is less illumination. The bottom row of plots show the dynamic range in these projections (i.e. the difference between the maximum and minimum projection values) as a function of condenser displacement. These plots indeed indicate a somewhat peaked response, but are less sharp than the illumination response of Fig. 29 because of the camera AGC, averaging normalization, and frame noise. Nonetheless, Fig. 31 shows a
26
Horizontal
Vertical 10
8
8
Field Lens Shift (mm)
Field Lens Shift (mm)
X Video Projections vs. Field Lens Shifts 10
6 4
6
4 2
2 0 0
100
200
300
400
Pixels
0 0
500
Change in Dynamic range of X Video Projection 3500
2500
3000
2000
2500
Height
Height
100
200
1500 1000
300
400
500
Pixels
Frame Projections
3000
500 0
Y Video Projections vs. Field Lens Shifts
Change in Dynamic range of Y Video Projection
2000
1500
2
4
6
8
1000 0
10
2
Field Lens Shift (mm)
4
6
8
10
Field Lens Shift (mm)
Dynamic Range in Projections Figure 31: Frame projections and dynamic range across condenser scan
region of 4-5 mm around the illumination maximum where the dynamic range is fairly stable and the projections are well-resolved. Even though the frames taken at the extremes of Fig. 31 were ill-lit, the analysis program of Fig. 22 was able to identify sufficient barcode features in all situations and calculate the alignment offset without resorting to a cross-correlation. Fig. 32 shows horizontal (left) and vertical (right) projections together with the analysis findings for the first (upper), middle (center) and last (lower) frames in the scan of Fig. 31 (the legend in Fig. 23 describes the different curves and symbols). The middle plots are seen to be very well resolved, with barcode features standing well above bias shifts and signal-to-noise. This is hardly the case in the upper and lower plots, where the barcode features sit atop a shifting baseline from noise and background illumination. Nonetheless, the floating threshold (derived using a low-pass filter 23) is able to still discriminate the barcode well enough for at least one digit to be read, and the imager position determined. The results of the full alignment analysis across the condenser scan are shown in Fig. 33. The horizontal coordinate (orthogonal to the direction of condenser
27
.
Video Projection: X; Frame 1
100
Video Projection: Y; Frame 1
100
11(9)
7(13)
80
80
60
60
Intensity
Intensity
10(4)
40 20
8(3)
40 20
0 0 100 Offset: 10.78 Slope: 8.986 Sigma: 3.324 \ 17.02
200
300 Pixels
400
0 0 100 Offset: 7.221 Slope: 7.697 Sigma: 3.009 \ 12.61
500
No Codes: 2
200
300
400
Pixels
500
No Codes: 2
Condenser Displaced Up Video Projection: X; Frame 10
100 .
Video Projection: Y; Frame 10
100
11(9)
7(13)
80
80
60
60
Intensity
Intensity
10(4)
40 20
8(3)
40 20
0 100 0 Offset: 10.76 Slope: 8.996 Sigma: 2.558 \ 2.897
200
300 Pixels
400
0 100 0 Offset: 7.278 Slope: 7.29 Sigma: 0.7676 \ 4.571
500
No Codes: 2
200
300
400
Pixels
500
No Codes: 2
Condenser In Middle Video Projection: X; Frame 21
100
Video Projection: Y; Frame 21
100
11(9)
7(13)
80
80
60
60
Intensity
Intensity
10(4)
40
20
40
20
0 0 100 Offset: 10.76 Slope: 9.033 Sigma: 11.89 \ 20.26
200
300 Pixels
400
0 0 100 Offset: 7.174 Slope: 7.884 Sigma: 5.926 \ 12.37
500
No Codes: 2
200
300
400
Pixels
500
No Codes: 1
Condenser Displaced Down Figure 32: Barcode analysis of frame projections at 3 points along condenser scan
displacement), as shown in the top plot, shows nearly total stability and generally stays within ±2 µm of its average value, in correspondence with the resolution seen in previous tests23. The vertical coordinate (aligned with the direction of condenser displacement), however, shows a very stable region within the innermost 6 mm of condenser scan, then appears to depart significantly as the illumination is shifted off axis. These departures may be due to several effects; i.e. aberration in the focusing lens becoming exaggerated as the beam of illumination moves off the edge, and systematics in the analysis routine arising from the large baseline shifts evident in Fig. 32. Fig. 34 28
X-Axis Alignment Shifts from Y-Axis Field Lens Displacement
Measured Saggitta Difference (µm)
6 4 2 0 -2 -4
0
2
RMS: 2.219 µm
6
8
10
Field Lens Shift (mm)
Y-Axis Alignment Shifts from Y-Axis Field Lens Displacement
40 Measured Saggitta Difference (µm)
4
30 20 10 0 -10 -20
0
2
RMS: 14.36 µm
4
6
8
10
Field Lens Shift (mm)
Figure 33: Change in measured alignment as condenser is displaced
expands the flat region seen in the lower plot of Fig. 33, and demonstrates that the data is indeed constant there to within a few microns. The data presented above indicate that there is a wide region of adjustment (i.e. circa ±3 mm away from center) in which the condenser of Fig. 27 can be placed without significantly affecting the illumination or alignment measurements.
29
Y-Axis Alignment Shifts from Y-Axis Field Lens Displacement
Measured Saggitta Difference (µm)
4 3 2 1 0 -1 -2 -3
1
2
3
RMS: 1.456 µm
4
5
6
7
8
Field Lens Shift (mm)
Figure 34: Expansion of flat region in Y-alignment data (lower plot of Fig. 33)
5) Effects from Mask Mounting The results presented in Ref. [23] showed linear residuals from horizontal and vertical scans across the barcode of Fig. 21 that exhibited RMS resolutions of 2 µm and 4 µm, respectively. The difference between these two values was exhibited in the shape of the residual vs. displacement curves; the horizontal scan showed the residuals essentially scattered randomly between ±4 microns of the fitted line, while the vertical residual displayed a highly structured "smile" form, i.e. a curve running from +10 µm at the barcode edges to -6 µm at the center, with circa ±2 µm of scatter. The barcode fixture was altered slightly since the data of Ref. [23] were taken, and the same effect started appearing in the horizontal (X) coordinate. Fig. 35 shows this data; the plot at top left indicates the barcode-to-displacement measurements across the scan, and the plot at top right shows the linear residual from a straight line. The "smile" curve mentioned above is very obvious, and certainly indicates structured error. The shape of this residual is indicative of the kind of error that one would expect from a mask defect; either a problem in its original photographic reduction (not likely), or from curl of the mask negative mounted in the illuminator. Since the mask was originally on a thin (4 mil) negative taped to a piece of glass, and exhibited a small amount of
30
Position Measurements
25
6 4
15
microns
mm (barcode)
20
10 5
2 0 -2
0 -5
Straight-Line Residual
8
-4 0
2
4
6
8
10
-6
12
0
Displacement of Lens (mm)
2
RMS: 3.263
4
6
8
10
12
10
12
Displacement of Lens (mm)
Scan with taped mask negative Position Measurements
25
Straight-Line Residual
6
20
microns
mm (barcode)
4 15 10 5
0 -2
0 -5
2
2
0
4
6
8
10
-4
12
Displacement of Lens (mm)
0
2
RMS: 2.031
4
6
8
Displacement of Lens (mm)
Scan with mask negative sandwiched in glass
Figure 35: Scan results for different mask supports
Barcode Calibration
9.04
Barcode Calibration
8.99
9.03 Barcode µm/pixel
Barcode µm/pixel
8.98 9.02 9.01 9 8.99
8.97 8.96 8.95
8.98 8.97 0 Slope: -0.003539 RMS: 2.836 mm
2
4
6
8
10
8.94 0 2 Slope: 0.0008302 RMS: 10.83 mm
12
Displacement of Lens (mm)
Scan with taped mask negative
4
6
8
10
12
Displacement of Lens (mm)
Scan with mask negative sandwiched in glass
Figure 36: Barcode-to-mask scale factors for above scans
visible bow, this was most likely (i.e. circa 500 µm of axial bow in the negative would produce an effect of the magnitude seen in Ref. [23] and Fig. 35). To investigate this, a new negative was made on thicker (7 mil) substrate, and sandwiched between two pieces of 1/16 inch photographic-quality glass when mounted in the illuminator. The X-axis results are shown at the bottom of Fig. 35 (this scan was
31
made in the opposite direction, as noted by the flipped slopes). The residual is now much flatter, and does not exhibit such a pronounced "smile" structure, as noted in Fig. 35, indicating that the major effect came from negative curl. Fig. 37 investigates further, by plotting the barcode-to-camera scale factors across the scan. If the mask is uniform, this curve should be essentially flat across the scan. In the glass-sandwiched case, it pretty much is. In the original taped-negative situation, however, there is a clear dependence of the scale factor on the scan coordinate, supporting an effect such as negative curl or twist. Additional data from these scan tests is presented in Ref. [26]. 6) Mask Rotation Provided that the camera coordinate origin is assumed to be at the camera center, the VSM system should be relatively insensitive to small differential rotations between the mask and imaging array. As a cross-check, however, it is worthwhile to measure and track this rotation. The wealth of pixel data that is provided, together with the linear features in a bar code such as in Fig. 21, enable rotations to be precisely estimated in a VSM system; in contrast, this is impossible to calculate in a standard SLM setup (Fig. 7). Rotations can be calculated from the VSM frame data in a variety of ways. One of the simplest methods would be to run the barcode analysis of Fig. 22 on several "band" projections across the image, then fit the offsets to a common angle. A much more accurate technique, however, would be to use data across the entire frame simultaneously in fitting the angle, rather than breaking the image into bands for separate analysis. Such an approach has been implemented by running a Hough transform34 on the frame data. The Hough transform is a special 2D case of the Radon transform that maps the Cartesian (x,y) pixel data into slope/offset (m,b) pairs by integrating the pixel density ρ(x,y) along lines traversing the image frame: H : (x,y) ⇔ (m,b)
2)
∞
H m,b =
ρ(x,y) δ(y – mx + b) dx dy
–∞
A routine has been coded in the MATLAB30 interpreter to calculate H(m,b) from the frame data for lines running over the entire usable frame (b = 0 → 475) and slopes (m) covering angles between ±15°, at half-degree increments. Although this consumed lots of execution time in MATLAB (calculating a 30 x 476 Hough matrix required circa 20
32
+10°
0°
-10°
Original Frames
After Edge Detection Figure 37: Rotated barcode frames and their edges
minutes on a Macintosh Quadra 650), it would easily execute within seconds if coded in a compiled language, and can be run at the frame rate with special-purpose or DSP hardware35. Again, since the estimation of frame-mask rotation is basically a diagnostic operation for the VSM, H(m,b) would only have to be calculated on occasion, thus no such special hardware need be provided with the processor in Fig. 19. The preparation employed in calculating the Hough transform is summarized in Fig. 37 for frames with positive, negative, and zero rotations. First, the frame data (top row) is spatially differentiated with the LOG (Laplacian of Gaussian 34) filter under the "Find Edges" menu command in Adobe PhotoShop36; these results are shown in the bottom row. The Hough transform is calculated from this edge data via Eq. 2 running in MATLAB; Fig. 38 shows gray-scale maps of the H(m,b) resulting from the three rotations of Fig. 37. Finally, this data is thresholded to pull out the significant peaks
33
Angle (deg)
Angle (deg) Angle (deg)
10.0 0.0 -10.0
.
0.0
200.0 Offset (pixels)
400.0
0.0
200.0 Offset (pixels)
400.0
0.0
200.0 Offset (pixels)
400.0
10.0 0.0 -10.0
10.0 0.0 -10.0
Figure 38: Hough transforms of rotated edge frames from Fig. 37
Hough Angle Projection: ANGEH5
1.2
0.8 0.6 0.4 0.2
0 -15 -20 Rsd: 0.008775 Mean: -10.72°
Hough Angle Projection: ANGEH3
1.2
1
Normalized Projection
Normalized Projection
1
0.8 0.6 0.4 0.2
-10
-5
0
5
Reconstructed Angle [deg]
10
15
20
0 -15 -20 Rsd: 0.01448 Mean: -0.5263°
Hough Angle Projection: ANGEH1
1
Normalized Projection
1.2
0.8 0.6 0.4 0.2
-10
-5
0
5
Reconstructed Angle [deg]
10
15
20
0 -15 -20 Rsd: 0.01471 Mean: 9.23°
-10
-5
0
5
10
15
20
Reconstructed Angle [deg]
Figure 39: Angle projections of thresholded Hough data in Fig. 38
corresponding to the edge lines, and projected onto the angle (vertical) axis after correcting for the uneven x/y aspect of the camera, producing the distributions in Fig. 39. As seen in Fig. 39, the linear barcode features produce a very well-defined peak in the Hough angle projection; the centroid of this peak thus precisely determines the barcode-camera rotation angle. The centroid is taken by fitting a quadratic over the main lobe; this can (barely) be seen as a dotted curve drawn over the data in Fig. 39. Two additional intermediate frames were taken in this series to accumulate a set of rotations spanning [-10°, -5°, 0°, +5°, +10°]. All frames were run through the Hough analysis outlined in Figs. 37-39, and the centroids of the resultant angle projections are
34
Trend of Reconstructed Angle Series
Reconstructed Angle [deg]
10 5 0 -5 -10 -15
1.5 1 Slope: -4.992°/step RMS: 0.1173°
2
2.5
3
3.5
4
4.5
5
Point #
Figure 40: Reconstructed angles for points at 5° rotation intervals
plotted in Fig. 40 over a least-squares fit line. The Hough-derived data is indeed linear (to within σ = 0.12°), and reproduces the implemented 5° of rotation per step extremely closely. In order to look at this from another perspective, the mask angle was fixed at roughly 4°, and the lens was scanned to look at the mask from various displacements. The frames were stored and run through the Hough analysis described above. Since the mask angle was unchanged, this data should be constant, excepting errors from mask nonuniformity and resolution. The results of this analysis are plotted in Fig. 41, where we see that the reconstructed angles indeed are quite constant; i.e. within 0.03° RMS. (corresponding to roughly 6 µm displacement at the edges of the mask). Again, the potential resolution may be even better, since this figure includes all inhomogenieties and distortions encountered across the mask. This level of angle resolution is more than adequate for any intended VSM application at GEM. For other applications, however, it could be improved by adding additional linear features into the mask; if one is observing at closer range, the optics can resolve finer features, and more lines (i.e. a denser barcode) can easily be accommodated.
35
Reconstructed Angles
Reconstructed Angle [deg]
4.02 4 3.98 3.96 3.94 3.92 3.9
0 Mean: 3.949° Sigma: 0.03029°
2
4
6
8
10
12
Point #
Figure 41: Reconstructed angles for points across barcode at constant rotation
7) Defocus When the VSM system is moved away from focus, the image resolution will degrade and the camera-to-barcode magnification scale will change. The former effect limits the VSM operation; if the barcode can no longer be properly resolved, the concept no longer works. The latter effect can actually be measured, at least while the barcode is reasonably imaged. A set of tests was performed to examine the defocus sensitivity. Fig. 42 shows a series of frames that was taken by moving the camera longitudinally at 1 cm intervals from focus to 5 cm defocus (using the 8 meter 1:1 optical baseline employed in all other tests), together with their horizontal pixel projection (plotted below the frames). An obvious shift in the y-axis displacement occurs because the lens is significantly off-axis in that coordinate, hence the physical sagitta changes (see Fig. 7). The barcode images begin to degrade; the first 3 cm of defocus show a slow change, which rapidly becomes intolerable as 5 cm is approached. Looking at the barcode projections, any image with more than 3 cm of defocus will require additional prefiltering/processing and/or a crosscorrelation analysis, as extracting a reliable barcode will be difficult.
36
0 cm defocus
1 cm defocus
2 cm defocus
3 cm defocus
4 cm defocus
5 cm defocus
Figure 42: Frames and projections for progressively increasing defocus
37
Barcode Calibration
8.82
7.14
Barcode µm/pixel
Barcode µm/pixel
8.81 8.8 8.79 8.78
7.13 7.12 7.11
8.77 8.76 5 0 Slope: 0.001709 RMS: 0.8849 mm
Barcode Calibration
7.15
10
15
20
25
7.1 0 Slope: 0.001718 RMS: 1.061 mm
30
Displacement of Lens (mm)
Horizontal (X) Axis
5
10
15
20
25
30
Displacement of Lens (mm)
Vertical (Y) Axis
Figure 43: Dependence of barcode-to-camera scale factor on defocus
The first inch of defocus was quantitatively explored with the barcode analysis routine of Fig. 22. The camera was moved away from focus (toward the barcode) in 0.2" intervals, and the evolution of the barcode-to-camera scale factors is shown in Fig. 43, together with a least-squares fit (dotted line). A definite trend is seen in the direction of increasing magnification, looking somewhat linear over this range, and with a resolution of a millimeter or so in both X and Y axes. Again, the actual resolution may be somewhat better, as the camera translation was not mechanically precise in this test; Ref. [37] quotes axial position resolutions of under 100 µm when using this approach across a 5.5 meter baseline. This quality of measurement indicates a possibility of compensating any magnification-dependent effects, since magnification can be well determined from the frame data. One must beware, however, of coma and pincushion nonlinearities32 skewing a defocused image if the line-of-sight is significantly off-axis. 8) Effect of Changing the Lens Aperture When decreasing the aperture of the lens, two major things happen. First, the amount of light directed to the camera will decrease. Second, the resolving power of the system will degrade because of a widening optical point-spread function; i.e. from basic diffraction theory, the minimum distance that an optical system can resolve is: 3)
∆xmin = 1.22 (1 /2 L) λ D
where L is the optical baseline between the mask and camera (the lens is assumed at its midpoint), λ is the illumination wavelength, and D is the lens aperture. In our system, i.e. L = 8 meters, D = 4.2 cm, and λ ≈ .65 µm for the red LED's, we calculate ∆xmin = 75 µm. The width of the narrow bars that are projected (as seen in all of the frame data presented in this report) is roughly 120 µm, thus we aren't too far above the diffraction limit; its effect should thus begin to become problematic with lenses below 2.5 cm in diameter. 38
4 cm aperture (f50)
3 cm aperture (f70)
2 cm aperture (f100)
1.5 cm aperture (f135)
1 cm aperture (f200) Figure 44: Frames and projections for progressively decreasing lens aperture
39
A series of images was captured as the lens was stopped down; the resulting frames and X/Y projections are given in Fig. 44. Here we can clearly see the loss of illumination and degradation in resolution with smaller effective lens width. Little noticeable effect is seen when dropping the lens diameter from 4 cm to 3 cm. When progressing lower, however, things start to degrade; at 2 cm the barcode is a bit smeared and the illumination is noticeably more muddy; below this it rapidly becomes difficult to discern all meaningful barcode features. As noted in Fig. 44, f#'s at this baseline are very high. At GEM, the fiducial lens diameters were specified at a conservative 1.5" (3.8 cm)1 . As seen in this example, it appears that we could go down to circa 3 cm without problem; regardless, it's always best to make the lens as wide as possible to allow some margin for problems in illumination, etc. One of the major drivers in the all-projective alignment scheme proposed1 originally at GEM was to minimize the needed diameter of the alignment path in order to reduce the resulting holes needed for optical clearance in the middle superlayer and maximize the detector acceptance (as it stands, the major acceptance impact is not from the alignment path diameter itself, but from the inclined angle of the projective paths when penetrating thick chambers in the forward barrel). This situation relaxed somewhat after the axial/projective strategy (Fig. 6) was adopted, since alignment paths were no longer penetrating the midst of the barrel. Beforehand, however, there was interest in accommodating an asymmetric alignment path; i.e. opening a slit through the middle superlayer rather than a full cylindrical hole. This would allow, for instance, the chambers to be brought closer to one another in the beam direction, while still passing significant amounts of light through the cracks between the chambers in φ (the figures in Ref. [1] portray this geometry). This idea was tested with the 8-meter VSM rig, and Figs. 45 and 46 present the results. Fig. 45 employs a slit aperture placed over the lens that is open in the horizontal direction (the quoted number is the slit width) and Fig. 46 employs a slit in the vertical direction. The findings agree with what is predicted by optics, namely that the point spread function becomes asymmetric; narrower in the coordinate aligned with the slit (thus providing nearly full resolution) and diffraction-spread in the slit-orthogonal coordinate. More light is obviously admitted, but if two coordinates are measured, the degradation in the slit-orthogonal coordinate can be problematic. Figs. 45 & 46 show results for 1 cm and 1.5 cm slits; while the illumination is much better than in previous situation (Fig. 44, with a symmetric aperture), the diffraction smearing in the slit-orthogonal coordinate is significant, preventing a simple
40
1.5 cm slit
1 cm slit
Figure 45: Frames and projections for horizontal slit apertures
1.5 cm slit
1 cm slit
Figure 46: Frames and projections for vertical slit apertures
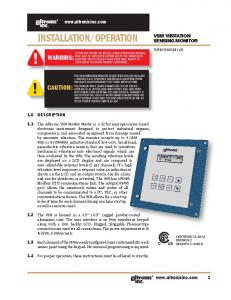
barcode readout, especially with the 1 cm slit. In all cases, the projection aligned with the slit is unaffected by the slit diameter. When the slit width is increased to 2 cm (not shown), the images with slits directed along X and Y are nearly indistinguishable, and look much like the frame taken with a 3 cm aperture in Fig. 44. A 2 cm slit would thus have been allowable in the longest path lengths implemented at GEM. Note that the horizontal projections are much noisier than the vertical projections, particularly noticeable in the darker frames with low dynamic range. This seems to arise from bias shifts when reading out the columns of the photodiode array in CX-102 camera that was used in these tests, and is examined further in Ref. [26]. Running the data through a soft low-pass filter easily removes these artifacts. 41
9) Thermal Effects and Turbulence A beam of light traveling through the atmosphere will be refracted upon encountering a thermal gradient. This can limit the precision of any optical distance or displacement measuring system; thermal gradients must either be controlled to be brought below tolerant levels, or monitored and the optical measurements corrected. A steady-state thermal gradient oriented perpendicular to a light beam will cause an apparent beam displacement along the gradient direction that increases quadratically with the distance that the beam travels through the gradient. The VSM and SLM systems, however, employ a detail that a mere light beam lacks; a lens is placed midway across the optical path, effectively cutting it in half from the thermal perspective. A thermal gradient near the camera or mask thus has little effect; in the region of the camera, there is no lever arm across which the refraction can work, and any refraction at the source merely selects the light ray that is imaged by the lens. Disturbances near the location of the lens have the most impact, as the light ray is effectively back-projected to source and detector in the imaging process, yielding largest lever arm. Granted, this is a very simplistic analysis; ultimately the conditions in which the system is to be operated should be simulated with a ray-tracing algorithm in order to anticipate what thermal constraints must be enforced for the specifications to be met. Because the VSM prototype was readily available, a series of thermal tests was performed to get some idea of what happens when a heat source is applied in the vicinity of the lens. An aluminum block measuring 15 cm x 15 cm in area and 5 cm in depth was heated in an oven to a desired temperature, then placed roughly 2 inches below the lens and a standard VSM 15-frame 1-Hz average quickly taken. This was done in 10°C steps, ranging from the block at room temperature (25°C) through the block heated at 75°C. A set of such averaged frames are shown in Fig. 47. The effects of connective turbulence are obvious at the higher temperatures, where the barcode appears heavily blurred (the turbulent smear may be somewhat tamed, however, if, instead of analyzing the barcode pattern on the averaged frame, the barcode in each sequential frame is analyzed separately, then the results averaged). The projection data is shown in Fig. 48 for the averaged frames. In the bottom plots, the barcode pattern is seen to degrade with increasing temperature (significantly worse in the direction orthogonal to the thermal gradient); in cases with the block temperature beyond 55°C, the barcode pattern starts to wash out. When all projections are plotted together (upper plots), position shifts from the thermal gradient can also be
42
25°C
55°C
75°C
Figure 47: Frames taken with heat source placed near lens
Horizontal Coordinate
Vertical Coordinate
25°C TT == 25°C
T = 25°C
T = 75°C 0
100
T = 75°C 200
300
400
500
0
100
200
300
400
500
0
100
200
300
400
500
T (°C) 75° 65° 55° 45° 35° 25° 0
100
200
300
400
500
Figure 48: Projections for frames taken with heat source placed near lens
discerned, especially in the vertical direction (along the gradient), where one would expect the major effect. Because the barcode features are washed out at the higher temperatures, the main analysis procedure of Fig. 22 is not used on this data. Instead, a correlation approach is pursued (depicted as an option in Fig. 22), in which the projections at 35° - 75° are crosscorrelated with the corresponding projection at 25°. The correlation may be viewed as an inner product:
43
Vertical (y) Coordinate
Horizontal (x) Coordinate Correlation Peaks
1
Correlation Peaks
1
T = 25° C 0.8
0.8
0.6
0.6
0.4
0.4
0.2
0.2
T = 75°C
0 -600
-400
-200
0
200
400
600
0 -600
-400
-200
D (Pixels)
0
200
400
600
z (Pixels)
Correlation over full frame Correlation Peaks
1
Correlation Peaks
1
T = 25° C
0.95
0.9
0.9
0.8
0.85
0.7
0.75
0.8
0.7
0.6
0.65
T = 75°C 0.5 -30
-20
-10
0
10
20
30
0.6 -30
-20
D (Pixels)
-10
0
10
20
30
D (Pixels)
Correlation peaks
Figure 49: Cross correlations of projection data with projection at room temperature
4)
RT(z) =
∞ –∞
p25°(x) p T (x – z) dx = p25°• p(z) T
where R T(z) is the correlation value for temperature T at a displacement ∆x (or ∆y) = z, p25° is the video projection at room temperature, and pT is the video projection taken at temperature T. The dot product at right is how the integral was evaluated; here we view the video projection p as a vector, and the nomenclature p(z) T denotes the vector shifted right or left by "z" entries. The correlations were run over the full length of the projection vectors (i.e. with the CX-102 camera, z runs between ±480 for the x projections and ±409 for the y projections); the ends of p(z) T were padded with zeros as z departs from the origin and data was shifted out of the vectors. Fig. 49 shows RT(z) for the thermal data in Fig. 48. The correlation peak is very well pronounced at all temperatures. The top row shows RT(z) for z ranging across the full pixel map, and the bottom row expands a much narrower region around the origin, where the change in peak position with temperature is obvious. 44
Vertical Coordinate
Calibrated Position Measurements
Calibrated Position Measurements
60 Calculated Sagitta (µm)
Calculated Sagitta (µm)
60
Horizontal Coordinate
Perturbed? 40
20
0 25
35
45
55
65
Perturbed?
40
20
0
75
25
Temperature applied at lens (°C)
35 45 55 65 Temperature applied at lens (°C)
75
Figure 50: Alignment offsets due to thermal source at the lens
The region of RT(z) around the correlation peak was interpolated up by a factor of 10 and differentiated, then the peak position was determined by finding the zero crossing. The resulting displacements are converted to microns using the pixel-to-barcode calibration provided by the scan tests26, and plotted in Fig. 50. Aside from the perturbed point (it was easy to disturb the system when moving the heated block into place), the trend is very clear. Significant displacement is seen in the vertical coordinate with temperature; when T exceeds 55°, the displacement rapidly increases, reaching 60 µm when T = 75°. One would expect the primary effect to be along the vertical, since this is the direction of the thermal gradient. Indeed, the horizontal displacements are much less (maxing out at 20 µm @ 75°C), although there is still a clear trend, probably because of the steady-state connective currents that are developing. This convection also plays a role in the smearing of projections depicted in Fig. 49; the projections showing the y coordinate (where there is a clear motion of air going up) are less degraded than the x projections at the same temperature, indicating that the air density is fluctuating along the horizontal. For an installation like GEM, where the temperature is desired to be regulated1 to within 1°C in the muon region, these thermal effects are inconsequential. So long as the temperatures in the vicinity of the lens are kept within 10° C of room temperature, this data indicates that there should be well under 10 µm of alignment error. This does constrain the cooling and placement of electronics and chamber amplifiers somewhat, but tighter requirements arise from other thermal sensitivities in the muon system, which result in the 1°C requirement. Again, these quick tests are approximate, and remain to be verified by an appropriate ray-tracing analysis.
45
Measured Position (mm)
1.6325
1.6300
..
1.6275
10 µm
1.6250
125
100
75
50
25
0
1.6225
Fan On Figure 51: SLM measurements with large box fan blowing onto optics table
During the GEM discussions, the effects of air conditioning on the muon alignment system were debated. In order to coarsely simulate this environment, a large box fan was brought into the optics lab, and blown full-tilt onto the optical table and VSM setup. No change was seen in the captured VSM frames; the fidelity was perfect with the fan running. A standard SLM system with LED and quad cell (Fig. 7) was substituted for the mask and camera of the VSM, and sequential position data was taken with and without fan running. The results are shown in Fig. 51. Without the fan, there is some random spread in the data (ranging across a 10 µm span). Once the fan is activated, two things happen; the spread is dramatically reduced from fast mixing and equalization of the ambient drafts, and the mean position drops by a few microns due to the change in average temperature. In general, the data of Fig. 51 indicate that the performance of the VSM system is made even more stable with vigorous motion of the ambient air, as would be created in a large air conditioning installation. Other effects that could be introduced from a powerful air conditioning system, however, such as vibration and large, steady-state thermal gradients, can have their own consequences on muon system performance, and must be properly accounted for in the air conditioning specification and layout.
46
10) Long-Term Drift Needless to say, it is very important for any alignment monitoring system to be stable over very long (i.e. effectively infinite) periods of time. Since the VSM design is mechanically derivative of SLM systems such as the RASNIK at L3, one would expect analogous stability behavior. The RASNIK's have been in operation for over 5 years now, and exhibit little problem with drift38. Although this is encouraging, it is still important to explore the drift of VSM systems, where there is one crucial difference; the stability of the frame grabber. If one drives the imaging array and frame buffer in a pixel-synchronous fashion (i.e. one pixel per memory location), there is very little margin for drift, and fabulous accuracies can be achieved (i.e. better than a few percent of the pixel pitch) 28,29. This is a more expensive solution, in terms of cabling and hardware; the alternative is not to dimension the frame buffer identically to the image sensor matrix, but to employ the synchronization signals on a composite video line to drive phase-locked loops (PLL's) in the frame grabber that drive the A/D converters and load the frame buffer memory. The video signal is thus effectively re-sampled at a rate corresponding to the frame buffer density and PLL frequency. This is how the vast majority of commercial frame grabbers operate. Re-sampling in this fashion can appreciably degrade the pixel resolution in frames taken with such asynchronous grabbers. The net accuracy is still within the GEM margin; i.e. most frame grabbers will deliver within 20% of a pixel width28,29, which keeps this "line jitter" error source under 4 µm for a typical array density. Most grabbers also appear to be very stable after a warm-up period of 90 minutes or so28,29. In order to examine these effects, data was taken with the 8-meter baseline VSM prototype over two 24-hour periods, sampling frames every 15 minutes. Results from the first test are plotted in Fig. 52, where we see considerable drift (i.e. circa 50 µm), although it appears highly structured and correlated with the activation/deactivation of the Draper Lab air conditioning system, which cycles in synchronization with the work day. Looking at our test setup in Fig. 24, one would expect mechanical errors to occur at this level in response to thermal shocks; i.e. the baseline is folded across the 5' x 12' optics table through 4 mirrors; a change/warp in the table or displacement of any mirror mount will inject a significant error into our measurements. This test was repeated during a holiday weekend when the air conditioning was kept off; results are shown in Fig. 53. Here, we see somewhat less effect and no abrupt structure (the gentle decrease in the X displacement happens shortly after sunrise), but a drift of up to 30-40 µm is still present.
47
Horizontal (X) Coordinate
Vertical (Y) Coordinate
6 PM (AC Off)
6 AM (AC On)
6 AM (AC On)
6 PM (AC Off)
Elapsed Time
Elapsed Time
Figure 52: Drift of the 8-meter VSM prototype over a 24-hour interval during the work week Horizontal (X) Coordinate
Vertical (Y) Coordinate
Calibrated Position Measurements
7.165
Calibrated Position Measurements
-2.6
Calculated Sagitta (mm)
Calculated Sagitta (mm)
7.16 7.155 7.15 7.145 7.14
-2.62 -2.63
-2.64
7.135 7.13
-2.61
0 10 PM
5
10 15 Elapsed Time (Hours)
20
25 10 PM
-2.65
0 10 PM
5
10 15 Elapsed Time (Hours)
20
25 10 PM
Figure 53: Drift of the 8-meter VSM prototype over a 24-hour interval during a weekend
Although the latter test observed no thermal "shocks", one would still expect that these drifts are mechanical in nature, since equivalent displacements are seen in both X and Y, whereas line jitter in the frame grabber system exerts its principal effect only on the horizontal (X) coordinate. These results are too incomplete for clean conclusions to be drawn; the mechanical drift must be decoupled from the VSM measurements. This was planned as a part of the GEM R&D; i.e. a long (9 meter) baseline would be set up along a linear path (i.e. without being folded on an optics table), and the component positions would also be simultaneously measured with a stretched wire system12. By comparing the wire and VSM results (plus monitoring temperature), any common mechanical drift can be removed, and its thermal origin ascertained. Unfortunately, the SSC was canceled before this could be realized, thus we're left with the results of Figs. 52 & 53, which suggest mechanical drift on the optics table, but are inconclusive.
48
IP
Proposed Projective Alignment Lines of Sight Figure 54: Schematic showing the proposed layout of the ATS
.
Com
Barcode Mask
ent
pon
Video Camera
mou nt
5
cm
ª1.5 " Lens
Single LED
LED array
Quad Cell, LE photodiode
θ,φ
θ ,φ Hexcell Chamber Surface
Fixture Plate (establish base pointing angles) Bolts into Hexcell surface
Figure 55: Simple mounting concept for prototype fixtures at the ATS
11) Mounting and Calibration of VSM Components Since it was only intended as a proof-of-concept, the VSM prototype that was laid out on the optics table in Fig. 24 paid little attention to the precision mounting of VSM components (mask, lens, camera). This was considered1 , however, and the GEM muon team was prepared to install at least 13 VSM systems on the Alignment Test Stand 31 (ATS; Fig. 54) with all components mounted on calibrated precision fixtures. Although GEM concluded before these designs could come to fruition, the essential mounting concepts that were under development are described here for archival purposes.
49
Outer Fixture
Inner Carrier
Centering Adjustments (i.e. setscrews)
Optical Element (i.e. lens) 3.5 cm
Precision Reference Surface (i.e. fiducial edge)
Spring Plungers
TTR Prototype
Figure 56: Original lens mount for TTR, showing basic concepts
Fig. 55 shows the basic concept for VSM fixturing at GEM; i.e. a component carrier with precise fiducials transferred to mounting holes and/or edges is fixed atop a mounting plate, which holds the component at the required projective angle and provide a precise mechanical reference to the chamber layer on which it is mounted. At the ATS, we had originally planned to investigate and compare several types of wide-range SLM systems, thus we had planned to design universal mounting carriers which could hold and calibrate a variety of components, as shown at right in Fig. 55. Such fixtures have been designed in detail at LLNL39, where many pieces were fabricated and awaited assembly at GEM's conclusion. Precise alignment component mounting fixtures, based on a Draper design 17 fabricated for the Harvard/SDC drift tubes, were adapted for early use in the LSDT40 chambers at MIT, which were an original contender for the GEM muon technology. The lens mount of such a fixture is shown in Fig. 56, and illustrates the basic principle of having an adjustable inner carrier (to which the lens is fixed) supported inside a outer carrier with precise fiducial edges. The lens is centered by tweaking set screws that move the inner carrier while the outer carrier rests against a fiducial surface in the calibration jig. When the reference surface in Fig. 56 is then pushed into a precision hole drilled at a known spot on the detector, the lens center is precisely registered. Since each lens is subtly different, the centers of all lenses must be empirically determined. This is accomplished by rotating each lens in its holder about a center line defined by a truncated source/lens/detector system (see Fig. 57). The offset of the inner carrier is adjusted relative to the holder at multiple angles, until the desired concentricity 50
AUXILIARY LENS
LENS HOLDER (Lens inside with adjustable centering)
or
irr
M
LED SOURCE
Circular trajectories seen at detector when rotating non-centered lens
Dx Dy
LENS'S ADJUSTMENTS IN HOLDER
Reference Surface (in contact during rotation)
Reference Surface (in contact during rotation)
M
irr
or
HOLDER'S REFERENCE DIAMETER
or
ct
e et
D
AUXILIARY LENS
(Compress Optical Path)
Figure 57: Jig for centering lens through rotation, based on actual Draper/SDC prototype
Data from centered fixture 4
Y offset (µm)
2
4 µm .
0
-2
-4
-6 -6
-4
-2
0
2
4
X offset (µm)
Figure 58: Position shifts measured when rotating lens centered via above jig
is seen at the detector (i.e. if the components are all aligned, the detector will measure no position changes with rotation; Fig. 58 shows the rotational offsets measured18,41 as in Fig. 57 with a lens that has been centered to within 4 µm). During this process, a fiducial edge of the holder is maintained against a reference edge of the jig, which has been precisely located with respect to the optical line-of-sight. In this fashion, the center of the lens has been transferred to the mechanical edge of its holder, which can now be attached to the chamber as described above. This procedure can be appreciably streamlined by simplifying the lens mount. The L3 lenses were rapidly centered at NIKHEF 15 on simple aluminum gauge blocks with two precision reference edges, then bonded with glue. The elaborate fixture depicted in Fig. 56, with inner and outer carrier plus set screws, was still a prototype, and too complicated/expensive for actual GEM application. The consensus was to explore a
51
Dx,Dy Adjustments
Displacement Monitor
Video Array
Fixture under calibration
Lens
Reference Pattern Back Illumination
Fiducial Edges
Figure 59: Aligning video cameras and/or barcodes using fixed optical bench
streamlined fixture for GEM, such as the L3 gauge block (it was planned to use the ATS as a laboratory for evaluating different fixturing techniques such as this). The rotation method of Fig. 57 can be readily used to center lenses, but there are better methods for placing imaging arrays and projected masks. A simple interactive system, as depicted in Fig. 59, can be employed to quickly center the arrays. Here, a video camera to be calibrated is mounted on a carrier with fiducial edges against common reference surfaces (a gauge block carrier is shown here, but this concept can be extended to other fixture shapes, such as the cylinders of Fig. 56), to which a reference pattern and lens have been pre-aligned. The imager position is then incrementally adjusted on its carrier until the reference image is at the center of the array . Real-time video can be displayed to greatly speed the procedure, and/or a computer can monitor the data and prompt the alignment technician with intelligent cues (actually, the entire process can be automated fairly easily, requiring little intervention). A similar technique can be employed to center the masks, although we had assumed at the ATS that these would be tacked onto their carriers under a microscope that referenced precise crosshairs generated with the barcode directly in PostScript (see Fig. 21). The original "all-projective" GEM strategy1 was to break the fixturing process into three alignment transfers; i.e. alignment component to carrier edge, carrier edge to projective fixture, then projective fixture directly into the cathode plane of the top or bottom CSC chamber layer. The challenge of doing this quickly, cheaply, and reliably (to within a 10 µm net transfer!) was to have been met in practice at the ATS facility. Fig. 60 shows the concept of an alignment fixture as mounted on the top cathode plane of a GEM superlayer, as was planned during the GEM Technical Design Report1 (many superior drawings were created; this schematic only serves to illustrate the basic idea). The precise reference of the fixture to the top layer would be transferred to the other chamber layers by correlating the hit pattern for muon tracks traversing the 52
DY vs. tube number for layer 3 Density ∝ No. of hits
Density ∝ No. of hits
Results from the TTR, illustrating determination of relative chamber layer offsets from muon data 35
Charged Track
Tube #
Tube #
mm
Strips ..
Hit Position (mm)
Hit Position (mm)
a) Uncorrected wire position
b) After wire position shifted to mean
Figure 60: Transferring the alignment reference into a superlayer using muon tracks
ATS Phase II
t men ars nt B align nme cal Alig nd opti rs a enso
Top View
(with
Dummy panels from Phase I, pre-instrumented with optical VSM alignment
ive
ject
o 5 Pr
VSM
s
S
t LO
men
n Alig
wire
res)
fixtu
z (θ) effective
.
IP
(Effective)
e
iv
ct
5 Projective VSM LOS
ffe
Stretched Wires
y (effective)
x
)e (φ
Figure 61: Plans for demonstrating axial/projective alignment at the Phase II ATS
superlayer, as depicted in the TTR data 42 plotted at left. Sufficient statistics would be collected to determine this interlayer alignment extremely rapidly, even at low luminosity. In addition, all alignment transfers (from alignment components into the superlayers) would also be verified by comparing the alignment monitor data with reconstructed tracks9 . As this requires much fuller statistics, the period of calibration is much longer; i.e. circa a week at full luminosity. Toward the end of GEM, the concept of referencing the alignment components to the top or bottom chamber layer was cast into doubt; in addition to potential mechanical difficulty, there could be significant errors with rotated superlayers when extrapolating the alignment measurements into internal chamber layers43. Accordingly, investigations
53
were examining the possibility of mounting the alignment references near the superlayer midpoints. As mentioned earlier, in its final days, the GEM muon group decided on hybrid axial/projective alignment, as depicted in Fig. 6. This introduces an another pair of alignment transfers (chamber to wire and wire to alignment bar), thus additional fixturing and fiducialization problems must also be confronted. This was to be the thrust of the phase II ATS, depicted in Fig. 61. Here, the all-projective phase I ATS was still used to emulate the muon chambers, but a set of reference bars (with projective monitors) and alignment wires were to be added in order to emulate the axial/projective system. 12) Conclusions This document summarized the technologies explored for wide-range 3-point straightness monitors in the GEM muon system, and archived most R&D measurements, findings, and speculations. Although GEM is now over, these technologies have potential use with other detectors and applications in high energy physics (as well as unrelated fields where precise alignment is desired). The use of LED blocks for extended-range SLM systems exhibited some potential; a commercial display unit with 2.5 mm LED pitch was investigated, and yielded apparent resolutions of around 20 µm RMS, although the light yield was too limited for applications at long baseline, and the LED pitch was a bit too wide. The resolution could be improved by custom-building LED blocks with better components and/or scan-calibrating each block individually before installation. In general, however, the LED block concept was found to be inferior to the Video Straightness Monitors (VSM's) which were developed further. The 2.4 cm square VSM barcode mask was amply illuminated across an 8 meter baseline by a bank of LED's and a condenser lens. The efficiency and size of the prototype illuminators, however, need improvement before they are ready for implementation. Using the prototype illuminator, the alignment measurements were found to be independent of the condenser position until the illumination was attenuated by more than 60% (i.e. a 6 mm range of condenser displacement). The structured appearance of the linear residuals seen in several barcode scans appeared to be dominated by negative curl. Effects of other factors (i.e. lens rotation & pincushion) on the wide-range measurement linearity should be additionally investigated. The rotation between barcode mask and camera could be determined to within 0.03° RMS using the Hough transform, and the longitudinal lens position resolved to
54
within a mm or better by measuring the image magnification. Future investigations should examine applying these measurements to recover from potential error sources. Defocus across the 8 meter baseline should be kept to within 3 cm (referred to the focal plane position), otherwise the images must be appropriately processed before clean features can be detected (this impacts the tolerance on lens focal length). The barcode image was sufficiently well illuminated and resolved across 8 meters with lens diameters down to 3 cm. Using a slit over the lens (as opposed to a circular aperture), the opening could be reduced to 2 x 4 cm; if the slit is closed below 2 cm, however, the resolution in the slit-orthogonal coordinate will rapidly degrade. Any major thermally-induced perturbations occur close to the lens. Thermal sources near the lens running 10°C over ambient temperature will produce alignment shifts of order 5 µm; higher temperatures should be avoided in this region. In an actual installation, effects of anticipated thermal gradients can be simulated with a ray-tracing algorithm; this system is very easy to model. The VSM worked very well in a heavily turbulent isothermal environment, suggesting that airflow improves performance. The long-term tests performed with this system showed drifts of up to 60 µm over a 24-hour period, but these seem to be mainly from thermal expansion on the optical table, and not line jitter in the frame grabber system. This issue should be addressed properly in future tests. The VSM components can be readily calibrated and aligned on an optical bench, as suggested by the GEM ATS activity. 13) Acknowledgments I am indebted to my optics colleagues at Draper Lab for their assistance. In particular the many discussions with Jacques Govignon were very important to this effort, and Dave Goodwin played a major role in setting up and running many of the original tests. The collaboration with Harry Van der Graaf of NIKHEF/Amsterdam has been very productive, and was paramount in launching this effort. The many discussions with Craig Wuest and his colleagues at Livermore have also been very valuable, and their work on implementing the VSM system at the ATS was highly appreciated. Thanks also to Mike Harris at SSC/CERN for arranging the GEM close-out activity that made this document possible. This effort, in particular, developed over GEM's brief life with considerable support and advice from my other muon colleagues, namely Andrey Korytov, Gena Mitselmakher, Andrei Ostapchuk, Frank Taylor, Mike Marx, Vinnie Polychronakos, and Scott Whitaker; had GEM continued, it would have been very exciting to have collaborated with this team in pushing some of these concepts into implementation. 55
14) References
[1]
“GEM Technical Design Report,” Chapter 4, GEM-TN-93-262.
[2]
Letter of Intent (LOI) to the Superconducting Super Collider Laboratory by the L★ Collaboration, Chapter 4, November, 1990.
[3]
Paradiso, J., "Some Alignment Concepts for the GEM Muon Array," GEM-TN-92-124, June, 1992.
[4]
ATLAS Letter of Intent, CERN/LHCC/92-4, October, 1992.
[5]
Mitselmakher, G. and Ostapchuk, A., "New Approach to Muon System Alignment," GEM TN-92-202, October 1992.
[6]
Paradiso, J., "Analysis of an Alignment Scheme for the GEM Muon Barrel," GEM-TN-92-150, October, 1992.
[7]
Paradiso, J., "Synchronous Proximity Detection for Stretched-Wire Alignment Systems" GEM-TN-93-447, August, 1993.
[8]
Mitselmakher, G. and Ostapchuk, A., "Alignment Requirements for the GEM Muon System", GEM TN-93-333, March, 1993.
[9]
Ostapchuk, A., "Background Muons for Alignment of the GEM Muon System", GEM TN-93-334, March, 1993.
[10] Therrien, C.W., Decision Estimation and Classification: an Introduction to Pattern Recognition and Related Topics, John Wiley & Sons, New York, 1989. [11] Korytov, A., "The Axial + Projective Alignment for Muon Chambers," GEM TN-93-302, March, 1993. [12] Korytov, A., Osborne, L., Paradiso, J., Rosenson, L. and Taylor, F., "Multi-Point Wide-Range Precision Alignment Technique for the GEM Detector" Nuclear Instruments and Methods in Physics Research, A343, pp. 428-434, 1994. [13] Paradiso, J. "A Simple Technique for Measuring Axial Displacement in StretchedWire Alignment Systems", GEM-TN-94-607, May, 1994. [14] Toth, W. E., "Muon Detector Program; Prototype Octant Construction and Evaluation with Production Phase Recommendations", Draper Lab Report CSDLR-1885, Oct. 1987. [15] Duinker, P., et. al., "Some Methods for Testing and Optimizing Proportional Wire Chambers", Nuc. Inst. and Methods, A273 (1988), pg. 814-819. [16] Paradiso, J. and Marlow, D., "Electronics for the Precision Alignment of the GEM Muon System", Proc. of the 1994 LeCroy Electronics for Future Colliders Conference, LeCroy Corp., Chestnut Ridge, NY, May 1993 (GEM-TN-94-636).
56
[17] Ayer, F. et. al., "The Engineering Development of an Actively Controlled Precise Muon Chamber for the SDC Detector", Proc. of the SSCIII Conference, New Orleans, LA, March 1992. [18] Govignon, J., "Draper Laboratory Contributions to SDC Detector Development; Termination Report, July 1993 - March 1994", CSDL-R-2598, April 1994. [19] Post, W., "A Homogeneous Lightsource for RASNIK", NIKHEF-H report, July/August, 1992. [20] Conceptual Design Report; Winerack Design of the SDC Barrel and Intermediate Muon Chambers, Section II-F, SDC-92-179, 1992. [21] Govignon, J., Draper Laboratory, personal communication, 1993. [22] Paradiso, J., van der Graaf, H., "Wide Range, Precision, Three Point Alignment System", Patent application submitted, Draper Lab patent disclosure # CSDL 1398, May 1994. [23] Paradiso, J., Goodwin, D., "Wide-Range Precision Alignment For The Gem Muon System", Proc. of the Third International Workshop on Accelerator Alignment, Annecy, France, Sept. 28 - Oct. 1, 1993. [24] Dekker, H., et. al., "The RASNIK/CCD 3-Dimensional Alignment System", Proc. of the Third International Workshop on Accelerator Alignment, Annecy, France, Sept. 28 - Oct. 1, 1993. [25] Becker, U. and Paradiso, J., "An Optical CCD-based System for Precise Drift Chamber Positioning", Nuc. Inst. and Methods, 196, p. 381 (1982). [26] Paradiso, J., "Application of Miniature Cameras in Video Straightness Monitor Systems", GEM-TN-94-608, June 1994. [27] "CMOS Light-Sensor Process Makes Possible Low-Cost Smart Machine-Vision Systems", Electronic Design, Vol. 41, No. 12, June 10, 1993, pp. 29-32. [28] Heckel, W., "Use of CCD Cameras for Digital Image Processing; Synchronization, Precision and Sources of Errors", Optical 3-D Measurement Techniques II, Herbert Wichmann Verlag GmbH, Karlsruhe, Germany, 1993, pp. 125-132. [29] Ge, R., "Linejitter detection of CCD Cameras", Optical 3-D Measurement Techniques II, Herbert Wichmann Verlag GmbH, Karlsruhe, Germany, 1993, pp. 239-246. [30] MATLAB, version 3.5, The Math Works, Inc., Cochituate Place, 24 Prime Parkway, Natick, MA. 01760. [31] Wuest, C.R. et. al., "The GEM Detector Projective Alignment Simulation System", Proc. of the Third International Workshop on Accelerator Alignment, Annecy, France, Sept. 28 - Oct. 1, 1993. [32] Welford, W.T., Useful Optics, The University of Chicago Press, Chicago and London, 1991.
57
[33] Metz, M., "Edge-Lit Holography Strives for Market Acceptance", Laser Focus World, Vol. 30, No. 5, May 1994, pp. 159-163. [34] Gonzalez, R.C. and Woods, R.E., Digital Image Processing, Addison-Wesley, Reading, MA., 1992. [35] Dolan, S., Sasena, E., "Hough in Hardware: Processors get Algorithm-Specific", ESD: The Electronic System Design Magazine, February 1989, pp. 51-57. [36] Adobe Photoshop® 2.0.1, Adobe Systems Inc., Mountain View, CA, 1991. [37] van der Graaf, H., "New RASNIK 3rd Coordinate Result", Internet Communication, April 22, 1994. [38] Fabre, M., "The Dimuon Mass Resolution of the L3 Experiment at LEP and its Dependence on the Muon Spectrometer Alignment", Thesis, ETH Zurich, Institute of High Energy Physics, Diss. ETH Nr. 9696, 1992. [39] Wuest, C.R., Belser, F.C., Holdener, F., "Alignment Test Stand and Experimental Test Program Leading up to Fermilab Beam Test; Project Plan", Sept. 1993. See also documentation and drawings by F. Holdener, LLNL. [40] Sumner, R., et. al., "Limited Streamer Drift Tubes for the GEM Muon System", GEM TN-92-203, October 1992. [41] Govignon, J., Ayer, F., "Implementation of an Optical Fencepost for the Alignment of the SDC Muon System", SDC-92-393, Dec. 14, 1992. [42] Movchan, S., "Status of Dubna PDT Prototype", Muon Meeting - Brookhaven National Laboratory, GEM TN-92-241, Nov., 1992. [43] Gershtein, Y., Mitselmakher, G., Ostapchuk, A., Personal Communication, Summer, 1993.
58