FAST ABSTRACT: Vulnerability Discovery Modeling using Weibull. Distribution.
HyunChul Joh, Jinyoo Kim and Yashwant K. Malaiya. Computer Science ...
19th International Symposium on Software Reliability Engineering
FAST ABSTRACT: Vulnerability Discovery Modeling using Weibull Distribution HyunChul Joh, Jinyoo Kim and Yashwant K. Malaiya Computer Science Department Colorado State University, Fort Collins, CO 80523 [dean2026, jyk6457, malaiya]@cs.colostate.edu
Abstract A vulnerability discovery model describes the variation in the vulnerability discovery rate during the lifetime of a software system and can be used to assess risk and to evaluate possible mitigation approaches. A few vulnerability discovery models have recently been proposed. The AML Logistic model has been found to provide the best fit in several cases. Weibull distribution, which can model an asymmetric pdf, is often used for reliability evaluation in some fields but has not been used for modeling vulnerability discovery. Here we propose a new Weibull distribution based on vulnerability discovery model and compare it with the existing AML Model. The results show that the new model performs well in many cases, and may be considered as an alternative to the AML model.
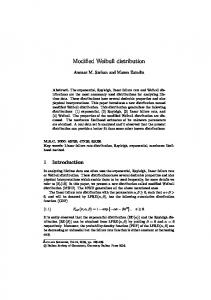
AML Discovery Rate
Weibull
Calendar Time
Figure 1. Weibull and Logistic distributions
Weibull distribution is often used for reliability evaluation for hardware systems. Both logistic and Weibull distributions will result in a cumulative distribution function with an “S” shape for the lifetime of a software product. No VDM using Weibull distribution function has been yet been examined even though it is a popular growth models along with the logistic. In the paper, we examine the use of a Weibull distribution based VDM and compare it with the existing logistic model using goodness of fit using vulnerability discovery rate data for two major commercial Windows operating systems and two major versions of Linux, which are open-source.
1. Introduction Security vulnerabilities, defined as software defects “which enables an attacker to bypass security measures” [1], in software systems represent significant risk to the users and providers of web-based services. Quantifying the risks and evaluation of possible mitigation approaches requires use of analytical models for the related processes. A few vulnerability discovery models (VDMs) have been proposed recently that attempt to model the vulnerability discovery process during the lifecycle of a given software product. Among the available VMDs, Alhazmi-Malaiya Logistic (AML) model has shown the best goodness of fit for the vulnerability discovery rate of major operating systems [2]. A potential limitation of the AML model is that it assumes a logistic vulnerability discovery rate that is symmetric around the peak value. Conceivably, in some situations, the behavior may not be symmetric. A possible alternative is to use the Weibull distribution which can represent asymmetry because of the skewness present in the pdf function [3], as shown in Figure 1.
1071-9458/08 $25.00 © 2008 IEEE DOI 10.1109/ISSRE.2008.32
2. A Weibull distribution based VDM Here we introduce a Weibull distribution based VDM. It assumes that the vulnerability discovery rate ω varies according to the Weibull pdf function as given in Equation 1: (1) is the shape parameter which can determine the shape of the software vulnerability discovery rate. When is approximately 3, the shape is symmetrical [4]. The curve has negative skewness when α > 3 and positive 299
1
(2)
The goodness of fit has been examined using , the coefficient of determination. Note that since both the as a two models use three parameters, the use goodness of fit measure for comparison is appropriate. The data for two major Windows OSs, XP and server 2003 and two major Linux OSs, Red Hat Linux and Red Hat Linux Enterprise have been used for evaluating the Weibull model. Vulnerability data sets for these software systems were obtained from National Vulnerability Database (NVD) maintained by National Institute of Standards and Technology [5].
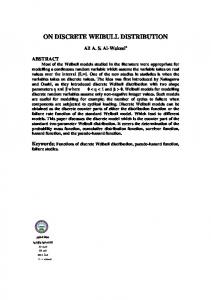
90 80
Red Hat Linux Enterprise Total
70 60 50 40 30
cumulative
20
Weibull
10
AML
0 1996-07 1997-02 1997-09 1998-04 1998-11 1999-06 2000-01 2000-08 2001-03 2001-10 2002-05 2002-12 2003-07 2004-02 2004-09 2005-04 2005-11 2006-06 2007-01 2007-08 2008-03
Ω
Number of Cumulative Vulnerabilities
skewness when α < 3. The parameter is the scale parameter, which can stretch the time duration of software vulnerability discovery modeling. The value is the total number of vulnerabilities that would eventually be encountered. The t value is real calendar time. Equation 1 results in the mean cumulative number of vulnerabilities Ω given by:
Calendar Time
Figure 2. Model fitting for Weibull and AML
OS
Windows XP
Windows Server 2003 Red Hat Linux
3. Results and Discussion
Red Hat Enterprise
Linux
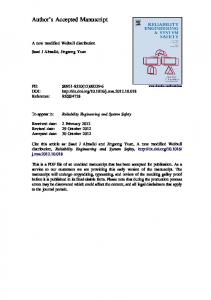
Table I gives the results of the goodness of fit analysis for the Weibull-based model for the four operating systems. For each of them, two major variations are examined separately. The value of the shape parameter is given. For comparison, the values for the AML model are also given. The results show that the proposed model fits the data very well in most cases. For Windows OSs, most of the time, the Weibull model fits slightly better than AML, and for the Red Hat Linux OSs, AML fits a little better in most of the time. A noticeable observation is that the fit is best when is close to 3. For Windows OSs, is in the vicinity of 3; however a negative skewness is observed for Linux. The significance of this needs further investigation. In the plots, the fit for Weibull-based model and AML often appears similar. For example, in Figure 2, the solid line is the observed data for the number of cumulative vulnerabilities, and the other two lines with × and + symbols are the fitted Weibull and AML models respectively. It is hard to tell which model is better with bare eyes. In the figure, until middle of 2006, both appear to fit similarly, but after then AML fits better. Actually, in Table I, tells AML is slightly fitting better. One would expect that when is significantly higher than 3, Weibull-based model would provide a value. That is not observed for the data sets higher used. Further research is needed to investigate the implications of this observation.
Table I. Goodness of fit for the two VDMs Version (total Weibull( ) -para. vulnerabilities) Total (257) 0.9443 3.5740 Prof.(143) 0.9529 3.5022 Home(119) 0.9552 3.4369 Total(177) 0.9705 2.8121 R2(131) 0.9148 2.4066 Standard(72) 0.9251 2.2454 Total(225) 0.9359 3.2386 6.0(54) 0.8016 7.1581 6.2(63) 0.8451 7.7166 Total(83) 0.7432 8.4951 2.1(41) 0.8103 5.0506 3.0(54) 0.6470 5.0230
AML( )
0.9409 0.9496 0.9515 0.9643 0.9146 0.9268 0.9300 0.8057 0.8455 0.7466 0.8252 0.6560
The proposed model fits the data sets examined quite well, and thus can be considered as an alternative to the AML model. Using data for other types of software systems is needed for further evaluation of the new model. Guidelines need to be developed for choosing between the Weibull and logistic models [6].
References [1] E. E. Schultz, Jr., D. S. Brown, and T. A. Longstaff, Responding to Computer Security Incidents. : Lawrence Livermore National Labo-ratory, July 23, 1990. [2] O. H. Alhazmi and Y. K. Malaiya, Application of Vulnerability Discovery Models to Major Operating Systems, IEEE Trans. Reliability, March 2008, pp. 1422. [3] Bonner, F.T., and T.R. Dell, The Weibull function: A new method of comparing seed vior, Journal of Seed Technology, 1976, pp. 96-103. [4] Boost Software. Weibull Distribution. Available: http://www.boost.org/doc/libs/1_35_0/libs/math/doc/sf_ and_dist/html/math_toolkit/dist/dist_ref/dists/weibull.ht ml, August 10, 2008. [5] National Institute of Standards and Technology. National Vulnerability Database. Available:http://nvd. nist.gov/download.cfm, March 31, 2008. [6] Cain, S.R., Distinguishing between lognormal and Weibull distributions, IEEE Trans. Reliability, March 2002, pp. 32-38.
300