Sep 15, 2017 - toxic dinoflagellate blooms have been increasing in coastal seas of ..... ages (days after hatching) Heavy horizontal bars represent darkness ...
MARINE ECOLOGY PROGRESS SERIES Mar. Ecol. Prog. Ser.
Vol. 57: 1-10, 1989
Published September 15
Vulnerability of marine fish larvae to the toxic dinoflagellate Protogonyaulax tamarensis* Serge Gosselinl, Louis or tier', Jacques A. ~ a ~ n e *
'
Departement de biologie, Universite Laval, Quebec, Canada G1K 7P4 Institut Maurice-Lamontagne, Ministere des Peches et des Oceans, 850 Route de la Mer, Mont-Joli, Quebec, Canada GSH 324
ABSTRACT: Fish larvae and early postlarvae proved highly vulnerable to the toxins of the dinoflagellate Protoyonyaulax tamarensis. Capelin Mallotus villosus and Atlantic herring Clupea harengus harengus larvae from the St. Lawrence Estuary, Canada, were exposed to variable concentrations of a toxic strain (treatment) and a non-toxic strain (control) of P. tamarensis. When exposed directly to the dinoflagellate, mortality due to the toxin (treatment minus control) was strongly correlated with the percentage of larvae that ingested cells. At cell concentrations (1500 cells ml-') that compared with local bloom densities, mortality reached 92 and 77 % d-' in capelin and herring, respectively. The mortality of herring postlarvae fed toxic microzooplankton ranged from 17 to 36 % d-' Age- and dosedependent variations in vulnerability were linked to early ontogenetic changes in the feeding efficiency and food selectivity of both species. We conclude that the present proliferation of toxic dinoflagellates in coastal waters could jeopardize the early survival of fish and recruitment to fisher~esby narrowing the spatiotemporal window within which spawning leads to successful reproduction.
INTRODUCTION Since the 1970's, the frequency and spatial extent of toxic dinoflagellate blooms have been increasing in coastal seas of both hemispheres (White 1982a, Blanco et al. 1985, Carreto et al. 1985, Davison & Yentsch 1985, Krogh et al. 1985, Maclean & White 1985, Tamiyavanich et al. 1985, White & White 1985). Concurrent increases in the occurrence of paralytic shellfish poisoning (PSP) have been reported worldwide (Carreto et al. 1985, Dahl & Yndestad 1985, Davison & Yentsch 1985, Krogh at al. 1985, Tamiyavanich et al. 1985, White & White 1985). Why catastrophic proliferations of toxic or non-toxic microalgae are becoming more frequent remains conjectural, but the general eutrophication of the coastal zone by human activity is suspected' (Jingzhong et al. 1985, Prakash 1987, Sukhanova et al. 1988). Shellfish are not the only fisheries resource potentially affected by the proliferation of toxic dinoflagellates. Fish kills related to toxic dinoflagellate blooms have been reported frequently (e.g. Adams et al. 1968, White 1977, 1980, 1981b, 1984, Avaria 1979, Jones et
Contribution to the program of GIROQ (Groupe interuniversitaire de recherches oceanographlques du Quebec) O Inter-ResearchIPrinted in F. R. Germany
al. 1982, Taylor et al. 1985, Yazdandoust 1985, Potts & Edwards 1987). The vector for finfish poisoning is herbivorous zooplankton which have been shown to accumulate the toxin (Adams et al. 1968, White 1981a, b, Boyer et al. 1985, Ives 1985, Watras et al. 1985, McClatchie 1988). Kills of adult fish are sporadic events with a limited impact on fisheries. White (1979, 1980, 1981a, b, 1982b, 1984) suggested, however, that the lama1 and juvenile stages of fish could be vulnerable to dinoflagellate toxins. If this proved correct, the emergence of fish larvae and early postlarvae at a time when the planctonic food web is contaminated by algal toxin could lead to a significant reduction of early survival and threaten recruitment to local stocks. So far, the issue of larval fish vulnerability to dinoflagellate toxins has received limited consideration. During the first days of life, the larvae of the majority of fish species are mixed feeders (herbivorous and carnivorous) that prey primarily on dinoflagellates, tintinnids, and invertebrate eggs (e.g. Last 1980). Thus, fish larvae can be exposed to the neurotoxin either by grazing on toxic dinoflagellates (direct intoxication) or by preying on toxic micrograzers (vectorial intoxication). Significant increases in mortality have been reported for winter flounder Pseudopleuronectes americanus, red sea bream Pagrus major, and Japan-
2
Mar Ecol. Prog. Ser. 57: 1-10, 1989
ese anchovy Engraulis japonica exposed directly to mildly toxic strains of Gonyaulax excavata' (Mills & Klein-MacPhee 1979, White et al. 1989). The potential impact of vectorial intoxication has been shown by White et al. (1989) who reported that 20 to 33 % of red sea bream and Japanese anchovy larvae fed toxic zooplankton died after exhibiting typical PSP symptoms. Given the present proliferation of toxic dinoflagellate blooms in coastal waters, the actual impact on larval fish survival of other, often more toxic species or strains, needs to be quantified. In the Estuary and northwestern Gulf of St. Lawrence, Canada, the dinoflagellate Protogonyaulax tamarensis (= Alexandrium tamarense) is responsible for some of the highest per cell toxicities ever measured (Cembella et al. 1988, Cembella & Therriault 1989). The distribution of P. tamarensis is associated with the Gaspe Current (Therriault et al. 1985) which is also the dispersal area for the larvae of several species of fish, including Atlantic herring Clupea harengus harengus and capelin Mallotus villosus (Jacquaz et al. 1977, de Lafontaine et al. 1981, 1984, Fortier & Leggett 1985). The aim of this study was to measure experimentally the impact of Protogonyaulax tamarensis neurotoxins on the early survival of capelin and Atlantic herring. The response of the larvae to direct exposure or vectorial intoxication was established for a range of cell concentrations bracketing the densities observed during natural proliferations. Ontogenetic variations in vulnerability were determined by repeating the experiments with larvae of different ages.
MATERIALS AND METHODS Dinoflagellate cultures. To isolate the mortality attributable exclusively to the neurotoxins from other sources of mortality, fish larvae were exposed to a nontoxic strain (control) and a toxic strain (treatment) of Protogonyaulax tamarensis. Non-toxic strain PLY173 (NEPCC183) isolated from the Tamar estuary near Plymouth, UK, was supplied by the Northeast Pacific Culture Collection (Department of Oceanography, University of British Columbia, Vancouver, Canada). A toxic strain was developed from cells sampled in the lower St. Lawrence Estuary (isolate Prl7b of the St. Lawrence Algal Culture Collection, Department of Fisheries and Oceans, Institut Maurice-Lamontagne, Mont-Joli, Quebec, Canada). As determined by HPLC analysis, the toxin content of isolate PLY173 is null '
Some authors (Taylor 1979, Cembella et al. 1988) have assimilated Gonyaulax excavata to Protogonya ulax tamarensis
(Cembella et al. 1987) whereas that of isolate Prl7b reaches 10.5 X I O - ~ yg saxitoxin equivalent cell-' (Cembella et al. 1988). Both cultures were grown in f/2 enriched filtered-seawater medium without silicate addition (Guillard 1975). Unialgal cultures were maintained under constant fluorescent light (117 pEm-' s-') in salinity of 22 %O and temperature of 16 0.5"C. For each experiment, cell concentration in the original suspension was determined using a Palmer-Maloney chamber (0.1 m1 capacity). The suspension was then diluted with filtered seawater to obtain the various cell concentrations used in the experiment. Fish larvae. Sediments containing fertilized capelin eggs were collected in the field and incubated in the laboratory following Fortier et al. (1987). Herring eggs and milt were stripped from mature spawners collected in the St. Lawrence Estuary and the fertilized eggs were incubated in the laboratory. Fish larvae were reared in flow-through containers (20 % renewal of water d-l) in salinities of 22 to 23 %O and temperatures of 8.0 2 l.O°C for capelin and 11.0 k l.O°C for herring. Fluorescent lights (daylight type) were automatically turned on from 05:OO to 21:00 h. From hatching to the end of the experiments, the larvae of both species were fed the alga Isochrysis galbana (250 ml-l) and the rotifer Brachionus plicatilis (10 ml-l, adjusted daily). Artemia salina nauplii (5 ml-', adjusted daily) were added to the diet of herring lavae starting 5 d after hatching. Experiments. To evaluate the effect of direct contact with Protogonyaulax tamarensis, the larvae of both fish species were exposed to the non-toxic (controls) and toxic strains (treatments) at concentrations of 250, 500, 1000, and 1500 cells ml-l. The experiment was repeated independently with capelin larvae aged 1, 2, 3, 5, 8 and 11 d and herring larvae aged 1, 3 and 6 d. To evaluate the impact of the dissolved toxin, toxic and non-toxic cells were broken ultrasonically. After filtering out the cell debris, herring larvae (1, 3 and 6 d old) were exposed to the extracted cellular content. To evaluate the effect of vectorial intoxication, herring postlarvae 10 and 15 d old were fed toxic microzooplankton during independent experiments. Various proportions of toxic and non-toxic cells were offered for 12 h to natural assemblages of zooplankton (size range 75 to 500 pm) collected in the St. Lawrence Estuary. A concentration of 1500 cells ml-' was maintained in each treatment by using the following ratios of toxic to non-toxic cells: 0/1500, 250/1250, 500/1000, 1000/500, 1500/0. Ungrazed dinoflagellates were sieved out after 12 h and the microzooplankton were offered to the postlarvae. Controls for these experiments also included starved postlarvae, postlarvae fed Isochrysis galbana, starved microzooplankton, or microzooplankton that grazed on I, galbana.
+
Gosselin et a1 Vulnerab~lityof fish larvae to a toxic d~noflagellate
All experiments were carried out in 3.5 1 fish bowls. The volume of algal culture needed to achieve the desired final cell concentration was transferred into a bowl which was then filled with seawater filtered through a 0.22 ,pm porosity Gelman cartridge. To avoid thermal shocks, temperature in the bowls was adjusted to the rearing temperature of each fish specles (capelin: 8 "C; herring: 10°C) by immersion in a cooling bath. After a 30 min delay, between 30 and 100 larvae were transferred into each bowl. Gentle aeration provided a n equal supply of oxygen to each container and kept the algae in suspension without stressing the larvae. For each treatment the number of dead larvae was determined 1 h after the transfer of the larvae and then every 4 h. Larvae were considered dead when not responding to a gentle poke from a pipette. Dead larvae were removed after each count and frozen immediately for later determination of gut content. For each experiment, the larvae were exposed to filtered seawater and Isochrysis galbana in addition to the nontoxic Protogonyaulax tamarensis controls. These additional controls allowed evaluation of the mortality caused by experimental manipulations.
RESULTS Symptoms following ingestion of toxic Protogonyaulax tarnarensis Gut content analysis using epifluorescence microscopy confirmed that capelin and herring larvae exposed duectly to Protogonyaulax tan~arensis ingested the cells. The presence of chlorophyll was easily detected but the number of cells ingested was difficult to determine because of the variable degree of digestion. Fish larvae fed equally on the toxic and nontoxic strains (Table 1). The slope (b) of the regression between the percentage of larvae feeding on the cells
3
in the toxic treatments and the corresponding non-toxic controls (pooled data for capelin and herring: b = 0.978, F = 43.0, n = 16, p < 0.0001) was not significantly different from 1 (t = 0.145, p = 0.850). The percentage of feeding larvae increased with cell concentration for capelin (regression analysis: F = 27.1, n = 33, p < 0.0001), but not for herring ( F = 0.0009, n = 15, p = 0.976). When exposed directly to the toxic strain, both species presented symptoms of paralysis. Poisoned larvae swam erratically, sank to the bottom of the tank and were soon immobile. In general, immobile larvae did not respond to gentle poking with a pipette but some of them performed one last swimming burst. Microscopic examination of paralyzed larvae showed that the heart beat stopped within ca 20 min of complete immobilization. None of these symptoms were observed in the non-toxic controls.
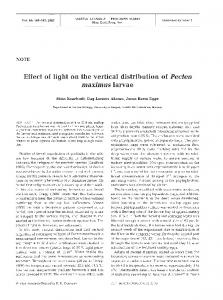
Direct intoxication: capelin Survival of capelin larvae ranged from 70 to 87 % after 24 h of direct exposure to non-toxic Protogonyaulax tamarensis (Fig. 1) and was similar to survival in the filtered water or Isochrysis galbana controls (Table 2). Survival in the toxic treatments ranged from 0 to 72 O/O depending on dose (i.e. toxic cell concentration) and age (Table 2). Percent survival declined linearly with time in the controls and exponentially in the toxic treatments (Fig. 1). The shape of the survival curve in larvae aged 2, 8, and 11 d (not shown) was similar. Instantaneous hourly mortality rates in the non-toxic controls were estimated by fitting a linear regression of time to the percent-sumval date (Fig. 1). For the toxic treatments, the instantaneous hourly mortality rate attributable to the toxin was estimated by fitting a n exponential decay model that included a correction for
Table 1. Mallotus v~llosusand Clupea harengus harengus. Percentage of capelin and Atlantic herring larvae feedlng on the toxic and non-toxic strains of Protogonyaulax tarnarensis by age (days since hatching) and cell concentration. -: Not tested Concentration (cells ml-')
1 -
250 toxic non-toxic
71.1 63.3
500 toxic non-toxlc
Capelin age (d) 3 5
2 P
8
11
1
Herring a g e (d) 3
6 9.6
P
54.5
70.8
41.4
64.2
71.4
-
-
-
-
-
60.7
78.9
19.2
78.3 77.4
71.0
58.6
72.0
19.2
-
89.7 81.0
83.8 74.4
11.7 13.3
-
-
75.7 71.9
-
58.3 56.0
62.5 44.8
45.8
1000 toxlc non-toxic
93.3 70.6
72.2
56.8 60.1
67.9 61.3
1500 toxic non-toxic
87.5 69.4
89.7 86.5
78.6 87.5
77.8 75.8
75.0
-
51.9 69 2
mar. Ecol. Prog
4
Ser. 57: 1-10, 1989
'IEPr '::F;:::::' /:=: '2kpR -
1 DAY OLD
3 DAY OLD
the mortality measured in the corresponding non-toxic control:
5 DAY OLD
where S, = percentage S, = (100 of e-ml) larvae- surviving bt at time(1) t;
60
m = instantaneous hourly mortality rate attributable to the effect of the toxln (i.e. corrected for mortality in the control); and b = slope of the linear regression describing survival in the corresponding non-toxic control (i.e. same or higher cell concentration of non-toxic cells). For comparison with values reported in the literature, hourly rates were transformed into daily rates:
40 20
2% c011m
~"
0
-a@ J
a
1
5
60
40 20
500
0
60
l!Ry'-K 40
20
1000
0
U)
20 1500
o
0
12
24 0
12
24 0
12
24
Z
=
1 - (1 - m)24
(2)
where Z = instantaneous daily mortality rate; m = instantaneous hourly mortality rate. Daily mortality attributable to the effects of the toxins ranged from 17 to 92 O/O in capelin, depending on dose and a g e of the larvae (Table 3). Mortality was proportional to toxic cell concentration (mortality = 21.5 + 0.039 concentrabon, F = 26.5, n 19, p < 0.0001). At low cell concentrations (250 to 500 cells ml-') older larvae tended to be less susceptible than young larvae. No clear trend was visible with a g e at higher cell concentrations (1000 to l500 cells ml-l). The daily mortality rate of capelin in the toxic treatments was strongly and linearly correlated to the percentage of larvae that ingested toxic cells (Fig. 2). For capelin of all ages, low daily mortality rates at low cell concentrations (Table 3) coincided with lower percentages of larvae with positive gut content (Table 1).
-
TIME (h)
Fig. 1 . Mallotus v~llosus.Time course of survival in capelin larvae exposed directly to a non-toxic strain (control, o) and a toxic strain (treatment, 0 ) of Protogonyaulax tamarensls at different cell concentrations and aqes (days after hatchinq). Heavy horizontal bars represent darkness
Direct intoxication: herring
The response of herring larvae to direct exposure to toxic cells was similar but less pronounced than the
Table 2. Mallotus villosus Percent survival of capelin larvae after 24 h In controls (filtered seawater, Isochrysis galbana, non-t0xi.c Protogonyaulax tamarens~s)and expenmental treatments (toxic P. tamarensis). -: Not tested
1
Treatment
Concentration (cells ml-'1
Filtered seawater Isochrysis galbana
1500
Non-toxic P, tamarensis
250 500 1000 1500
Toxic P. tarnarensis
250 500 1000 1500
Capelin a g e (d) 1
2
3
5
8
11
68.1
68.4
87.5
73.8
89.7
76.9
5
Gosselin et al.. \lulnerabil~tyof f ~ s hlarvae to a toxic dinoflagellate
Table 3. M a l l o t ~ ~villosus. s Instantaneous daily mortality (?L d - l , Eqs. [ l ] and [2])at age (days since hatching) in capelin larvae exposed directly to the toxic dinoflagellate Protogonyaulax tamarensis at different cell concentrations. Estimates are corrected for the mortality observed in the non-toxic controls and represent the mortality imputable exclusively to the effects of the toxin. Initial number of larvae in the experimental treatment given in parentheses; yolk sac: percentage of larvae with yolk sac; -: not tested "C,
Concentration (cells ml-')
yolk sac
1
2
100.0
100.0
response of capelin (Fig. 3). Survival in the non-toxic control (1500 cells ml-l) was high and similar to survival in other controls (Table 4). In the toxic treatments, survival after 24 h was usually higher than in capelin of the same age. In herring aged 1, 3 and 6 d, the sunrival curve presented an initial period of latency, mortality starting only after the lights were turned on in the morning (Fig. 3). To estimate instantaneous mortality rates, Eq. (1)was adjusted to the percent survival data starting with the first data point taken after the lights were turned on. Herring mortality following direct exposure to toxic cells decreased with age (Table 5),and was only marginally correlated to cell concentration (mortality = 10.76 + 0.024 concentration, F = 4.19, n = 12, p = 0.068). Lower mortality rates at age 6 d (Table 5) coincided with a lower percentage of larvae with cells in their gut (Table 1). When one outlier point was excluded from the regression, daily mortality rate in the toxic treatments was significantly correlated to the percentage of larvae with toxic cells in their gut (Fig 4). Herring larvae of different ages showed little response to the dissolved toxins or membranes of broken cells (Table 4 ) .
loo-
1 DAY OLD
3 DAY OLD
6 DAY OLD
a0
loo
-39.51 1.34X
intoxication
The survival of herring postlarvae In the different non-toxic controls of these experiments ranged from 65 to 95 % after 36 h (Fig. 5). Survival in the presence of microzooplankton that were fed toxic Protogonyaulax
i
- CAPELIN = 7- 80ap -> 60- P