WAITING FOR THE BUS Daniel Baldwin Hess Jeffrey Brown Donald Shoup Institute of Transportation Studies University of California, Los Angeles 3250 Public Policy Building, Box 951656 Los Angeles, California 90095-1656 Tel 310.825.1690 Fax 310.206.5566
[email protected] Submitted for Presentation to the 2003 Transportation Research Board Annual Meeting DRAFT - FOR REVIEW AND COMMENTS ONLY ABSTRACT How much is time worth? In a natural experiment, bus riders were presented with the opportunity to pay for time savings: they could pay 75¢ to travel right away, or wait for a free ride. Eighty-six percent of riders chose to wait rather than pay. Since they waited an average of 5.3 minutes, their behavior suggests that the disutility of their time spent waiting for the bus is less than $8.50 per hour.
TRB 2003 Annual Meeting CD-ROM
Original paper submittal – not revised by author.
WAITING FOR THE BUS To realize the value of one minute, Ask the person who has missed the train, bus or plane. - Author unknown How much is time worth? Transportation engineers and planners often need to answer this question because many public investments are justified by the value of travel and/or wait time savings. And with so much public money on the line it is important that engineers and planners use an accurate estimate of how much the savings are actually worth. This paper shows how bus riders responded when presented with the opportunity to pay for time savings: they could pay 75¢ to travel right away, or wait an average of 5.3 minutes for a free ride. Eighty-six percent chose to wait rather than pay.
Since they waited 5.3 minutes to
save 75¢, their behavior suggests that the disutility of their time spent waiting for the bus is less than $8.50 per hour. A Natural Experiment UCLA students traveling from a graduate student apartment complex (University Village) to campus can choose to ride either the Santa Monica Municipal Bus Lines (Blue Bus) or the Culver CityBus (Green Bus). Both the Blue Bus Line 12 and Green Bus Line 6 provide direct service to UCLA, and travel time is the same on both routes (see Figure 1). The main difference between the two lines is the fare: students can ride the Blue Bus for free, but must pay 75¢ to ride the Green Bus.1 An innovative fare payment arrangement creates this natural experiment. UCLA students, staff, and faculty can ride any Blue Bus without paying a fare when they swipe their university identification card through an electronic card reader, and UCLA
Blue Bus
Green Bus
No Fare
75¢ Fare
pays the Blue Bus. [FIGURE 1] When the Blue Bus arrives first, riders board it and enjoy the free ride. But when the Green Bus arrives first, riders must choose: pay to board it, or wait for a free ride on the next Blue Bus.2 In this situation bus riders spend additional wait time to save money.
2
TRB 2003 Annual Meeting CD-ROM
Original paper submittal – not revised by author.
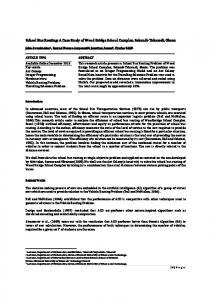
Methodology We selected a bus stop located at the corner of Queensland Street and Sepulveda Boulevard, adjacent to the University Village apartments, as the site for our experiment. We learned from observation and interviews that most riders boarding the bus at this stop are students traveling to UCLA. We excluded those riders who did not appear to be students (elderly, letter carriers, etc.) from our analysis. We collected data during the AM peak (7 am to 10 am, weekdays) when riders were traveling toward UCLA. We counted the number of riders who boarded each bus, and their wait times; in cases where riders let the Green Bus pass and waited for the next Blue Bus, we noted the additional time they waited for a free bus ride.3 We also surveyed a random sample of riders to learn the reasons for their particular travel choices and gauge their perceptions of wait time. We asked these riders whether they usually board the Blue Bus or the Green Bus and why, and how long they normally wait for the bus. We assume that riders only consider the fare when deciding which bus to take, and are indifferent to any differences in the quality of service offered by the two lines.4 Results Because the Blue Bus operates on a 10-minute headway and the Green Bus on a 12minute headway, we expected a Blue Bus to arrive first most of the time. In 64 percent of observed cases (179 out of 281), the Blue Bus arrived first and the rider boarded the bus for a free ride. These riders waited an average of 3.8 minutes, and we do not consider them further.5 The Green Bus arrived first in 36 percent (102 out of 281) of cases. These riders had to decide whether to pay 75¢ to ride the Green Bus or wait to ride free on the next Blue Bus.6 We divided the riders who faced this choice into two groups: (1) those who paid to ride the Green Bus (payers), and (2) those who waited for a free Blue Bus (waiters). The average elapsed time between each departing Green Bus and the next arriving Blue Bus was 5.3 minutes for all waiters; the median elapsed time was 4.5 minutes. We found that 14 percent (14 out of 102) of riders who faced a choice paid 75¢ to board the Green Bus and reduced their wait time, while 86 percent (88 out of 102) waited for the Blue Bus (see Figure 2).7 Riders thus chose between paying a 75¢ fare and waiting an average of 5.3 minutes for a free ride. Paying 75¢ to reduce wait time by 5.3 minutes is equivalent to paying 3
TRB 2003 Annual Meeting CD-ROM
Original paper submittal – not revised by author.
$8.50 per hour (0.75 x 60 minutes ÷ 5.3 minutes), so a traveler whose disutility of wait time was $8.50 per hour should be indifferent to the choice between paying to ride the Green Bus or waiting for a free ride on the Blue Bus. A traveler with a higher value of time should pay to ride the Green Bus and one with a lower value should wait for a free ride on the Blue Bus. [FIGURE 2] Regular commuters should have a rough idea of the additional wait time they would spend if they chose to wait for a free Blue Bus ride. Figure 3 shows the distribution of additional wait time for passengers who waited for the Blue Bus.
Riders who waited gambled that their
additional wait time would be an average of 5.3 minutes, and the standard deviation of additional wait time was 3.3 minutes. The median waiter spent 4.5 minutes of additional wait time to save 75¢, and thus earned $10.00 per hour for time spent waiting. One unlucky waiter spent 18 minutes of additional wait time, and earned $2.50 for time spent waiting. [FIGURE 3] Payers Fourteen percent (14 out of 102) of riders who faced a choice paid the fare to ride the Green Bus, indicating that they value their time spent waiting at more than $8.50 per hour. Their average total wait was 5 minutes (range: 1.5 to 13.8 minutes; standard deviation: 4.1 minutes). Many Green Bus riders told us that paying a fare is not a barrier to riding the Green Bus. They are more concerned with avoiding additional wait time: I always ride whichever bus comes first. I don’t care if I have to pay 75¢ on the Green Bus – I just want to get on the bus quickly without waiting around. I am always in a hurry to get there in the morning, so I take whichever bus comes first. Sometimes I luck out and get a free ride on the Blue Bus, other times I have to pay 75¢ on the Green Bus.
Some Green Bus riders told us that they pay to ride the Green Bus only on days when they are in a hurry: I have to pick up my kids from day care, and I ride the Green Bus when I am running late to avoid standing on the corner waiting for the Blue Bus. 4
TRB 2003 Annual Meeting CD-ROM
Original paper submittal – not revised by author.
When I have something important that I have to be on time for like an exam or a presentation, I ride the Green Bus if it comes first. If I let the Green Bus pass by, I don’t know how long I might end up waiting for the next Blue Bus.
Clearly, for some bus riders on all occasions and other bus riders on some occasions paying to ride the Green Bus is worth the time savings. Waiters Eighty-six percent (88 out of 102) of riders who faced a choice waited for a free ride, which implies that they value their time spent waiting at less than $8.50 per hour. On average, these riders waited a total of 10.4 minutes (range: 2.5 to 17.5 minutes; standard deviation: 3.5 minutes), including 5.3 minutes (range: 1.0 to 14.2 minutes; standard deviation: 3.3 minutes) after the departure of the Green Bus. Many Blue Bus riders told us that cost was their only concern: they waited for a Blue Bus to avoid paying a fare: I ride the Blue Bus because it’s free, even though the Green Bus is more comfortable. The two buses are going to the same place and take the same amount of time to get there, so I wait for the Blue Bus to get a free ride. I can’t afford to ride the Green Bus, so I always wait for the Blue Bus.
We also found that 28 percent (25 out of 88) of waiters allowed two Green Buses to pass before they boarded the Blue Bus. These “diehard waiters” added an average of 7.3 minutes to their wait time for a free bus ride, and their average wait was 13 minutes—more than twice the average 5.8-minute wait for all riders. Two unlucky waiters added an additional 14.2 minutes to their wait time, and let two Green Buses pass before they finally boarded a Blue Bus. They earned $3.17 per hour for time spent waiting.
5
TRB 2003 Annual Meeting CD-ROM
Original paper submittal – not revised by author.
We expect the marginal cost of time spent waiting to increase with the duration of wait time, so some passengers who chose to wait for a free ride might eventually pay to ride the Green Bus after a certain amount of time had passed. On one occasion six riders let a Green Bus pass and chose to wait for a free ride. But when the next bus arrived 7.5 minutes later, it was another Green Bus. Two riders chose to board the Green Bus, while the other four continued to wait. These four riders finally boarded a free Blue Bus after spending 11.5 minutes of additional wait time from when they let the first Green Bus pass. These riders earned $3.91 per hour for their time spent waiting. To pay or to wait? Some riders went to great lengths to make sure they did not pay a fare to board the Green Bus when waiting for a free Blue Bus ride would have delayed them only a short time. These individuals positioned themselves so they would be the last riders to board the Green Bus, thus giving them extra time to see if a Blue Bus was near. They craned their necks to look down Sepulveda Boulevard to see if an approaching Blue Bus came into view, and they stepped onto the Green Bus only when they could no longer delay boarding. These riders were willing to lengthen their wait, but only when they were certain the wait would be a short one. Some riders said they took note of the number of waiting passengers as they arrived at the bus stop when they made their traveling decision. If there were no waiting passengers, they assumed that they might have just missed a Blue Bus and they were more likely to pay the fare to ride the Green Bus. If there were several waiting passengers, they assumed that a Blue Bus would soon arrive and they were more likely to wait for it. Some riders sought explicitly to minimize their wait time. We learned that although the buses operate on short headways, 42 percent of surveyed riders coordinate their arrival at the bus stop with the bus schedules. This finding is surprising because the short headways of the Blue Bus make it unlikely that riders could time their arrivals at the bus stop to appreciably reduce their average wait. How do these findings compare with the literature? UCLA riders who waited for a free ride valued their time spent waiting at less than $8.50 per hour. This value is somewhat lower than the estimates reported in the literature.8 For 6
TRB 2003 Annual Meeting CD-ROM
Original paper submittal – not revised by author.
example, Bein et al (1994) estimate a value of bus wait time of $12 per hour in their Chicago study. In a study similar to ours, Deacon and Sonstelie (1985) report that motorists who waited in line for low-priced gasoline valued their wait time at between $11.95 and $18.31 per hour (2002 dollars).9 Most studies report that people value their wait time at up to half their wage rate. The minimum hourly salary for graduate students employed by UCLA is $13.90, so the riders’ value of wait time in this case is in line with the wage rates for graduate student employees.10 Perception versus Reality of Wait Time We asked a sample of bus riders how long they usually wait to board the bus (Blue Bus or Green Bus) at this stop, and they told us that their average wait time was 11.1 minutes.11 However, the observed average total wait for all riders who boarded either bus was 5.8 minutes. Bus riders therefore perceived their wait time to be almost twice what it actually is.12 We also asked riders who faced the choice of paying to ride the Green Bus how much longer they expected they would have to wait for the next Blue Bus. They reported that they would wait an average of an additional 6.9 minutes for the next free Blue Bus, much closer to the observed additional wait time. We therefore learned that when the wait time is imposed by the transit system, riders overestimate their wait time by a factor of two; but when the riders choose to wait longer for a free ride they more accurately estimate their wait time. Conclusion In a natural experiment, we learned that most student riders valued their time spent waiting for the bus at less than $8.50 per hour. Eighty-six percent of riders who faced a choice between paying to reduce wait time or waiting for a free ride chose to wait for the free ride. We also learned that the clock runs faster when the wait is someone else’s fault.
7
TRB 2003 Annual Meeting CD-ROM
Original paper submittal – not revised by author.
REFERENCES Beesley, M. 1965. The Value of Time Spent in Traveling: Some New Evidence. Economica. vol. 32. pp. 174 - 185. Bein, Peter, Ted Miller, and William G. Waters II. 1994. British Columbia Road User Costs. Proceedings of the Canadian Transportation Research Forum. 29th Annual Meeting. Victoria, British Columbia. pp. 714 - 727. Brown, Jeffery, Daniel Baldwin Hess, and Donald Shoup. 2001. Unlimited Access. Transportation. vol. 28. no. 3. pp. 233 - 267. Brown, Jeffery, Daniel Baldwin Hess, and Donald Shoup. 2002. BruinGO: An Evaluation. Working paper, UCLA Institute of Transportation Studies. Deacon, Robert T. and Jon Sonstelie. 1985. Rationing by Waiting and the Value of Time: Results from a Natural Experiment. Journal of Political Economy, vol. 93. No. 4. Pp. 627-647. Gronau, R. 1980. The Value of Time in Passenger Transportation: The Demand for Air Travel. New York, New York: Columbia University Press. Lam, William, and John Morrall. 1982. "Bus Passenger Walking Distances and Waiting Times : A Summer-Winter Comparison." Transportation Quarterly. vol. 36. no. 3. pp. 407-421. Lisco, T. 1967. The Value of Commuters’ Travel Time: A Study in Urban Transportation. Unpublished doctoral dissertation. Department of Economics, University of Chicago. Local Government Operational Research Unit (LGORU). 1973. Modal Choice and the Value of Time. Report C143. London, UK: Royal Institute of Public Administration. Mohring, Herbert. 1972. Optimization and Scale Economies in Urban Bus Transportation. American Economic Review. vol. 62. no. 4. pp. 591 - 604. Mohring, Herbert, John Schroeter, and Paitoon Wiboonchutikula. 1987. The Values of Waiting Time, Travel Time, and a Seat on a Bus. Rand Journal of Economics. vol. 18, no. 1. pp. 40 56. Mohring, Herbert, John Schroeter, PaitoonWiboonchuitkula. 1987. “The Values of Waiting Time, Travel Time, and a Seat on a Bus” in The Rand Journal of Economics (Vol. 18, Issue 1). Spring, 1987. pp. 40-56. Moreau, Agnès. 1992. “Public Transport Waiting Times as Experienced by Customers : Marketing Research involving the Grenoble System.” Public Transport International. vol. 41 no. 3. pp. 52-68. 8
TRB 2003 Annual Meeting CD-ROM
Original paper submittal – not revised by author.
O’Farrell, P.N. and J. Markham. 1975. The Journey to Work: A Behavioural Analysis. Oxford, UK: Pergamon Press. Quarmby, D.A. 1967. Choice of Travel Mode for the Journey to Work. Journal of Transport Economics and Policy. Vol. 1. Pp. 273-314. Small, Kenneth A. 1992. Urban Transportation Economics. Reading, United Kingdom: Harwood Academic Publishers. Talvitie, Antii. 1972. Comparison of Probabilistic Modal Choice Models: Estimation Methods and Systems Inputs. Highway Research Record. No. 392. Washington, DC: Highway Research Board. Wardman, Mark, Julian Hine, and Stephen Stradling. 2001. Interchange and Travel Choice. Report for the Scottish Executive by the Institute for Transport Studies at the University of Leeds and the Transport Research Institute at Napier University. Edinburgh, Scotland: Scottish Executive Central Research Unit. Available online at:
9
TRB 2003 Annual Meeting CD-ROM
Original paper submittal – not revised by author.
Figure 1 Map of Blue Bus and Green Bus routes to UCLA Campus
Green Bus
UCLA University Village
Blue Bus
4.9 miles to campus Scgeduled travel time (both Blue Bus and Green Bus) = 25 minutes
Westwood Boulevard
UCLA Campus
Queensland Street
N
Sepulveda Boulevard
Bus Stop
10
TRB 2003 Annual Meeting CD-ROM
Original paper submittal – not revised by author.
Figure 2 A natural experiment
All riders
36 %
64 %
Blue Bus Arrives First
Green Bus Arrives First
86 % WAITERS Waited to save money.
14 % PAYERS Paid to save time.
11
TRB 2003 Annual Meeting CD-ROM
Original paper submittal – not revised by author.
Figure 3 How much longer did students wait for a free ride?
20%
Percent of passengers
15%
10%
5%
0%
0
2
4
6
8
10
12
14
16
18
20
Additional wait time (minutes)
12
TRB 2003 Annual Meeting CD-ROM
Original paper submittal – not revised by author.
Notes 1
In September 2000, UCLA and the Blue Bus launched BruinGO. The program allows UCLA students, staff, and faculty to board any Blue Bus without paying a fare when they swipe their UCLA identification card through an electronic card reader, and UCLA pays 45¢ per ride. For more information about BruinGO, see Brown, Hess, and Shoup (2002). For more information about university transit-pass programs in general, see Brown, Hess, and Shoup (2001).
2
When faced with the decision of boarding the Green Bus and paying the fare or waiting for the Blue Bus, riders can look upstream to see whether a Blue Bus is approaching, or downstream to see whether a Blue Bus has just departed, providing the passenger with additional information about the potential length of wait time.
3
Bus route modelers assume that a patron’s average wait is half the scheduled headway between buses, and we use this value in our analysis. See Lam and Morrall (1982) for a detailed discussion.
4
The two lines have the same 25-minute travel time from University Village to campus, although most of our survey respondents don’t perceive this to be the case. Only 39 percent (16 out of 41) thought travel time was the same, while 29 percent (12 out of 41) thought the Green Bus was faster and 22 percent (9 out of 42) thought the Blue Bus was faster. Just under 10 percent (4 out of 41) either did not know or did not answer the question. Some respondents might have thought the Green Bus is faster because they have to pay for their ride, and this gives the it the appearance of a “premium” service. The Green Bus also tends to be less crowded than the Blue Bus and boarding passengers have a greater likelihood of sitting rather than standing for the ride to campus, which further contributes to its appearance as a premium service. But most UCLA riders still chose to wait for the free Blue Bus ride, which suggests that saving money is more important than both wait time and any perceived or actual service quality advantages the Green Bus might possess.
5
The range of wait times was 0.3 minutes to 10.0 minutes, with a standard deviation of 2.1 minutes.
6
We repeated the experiment in late June 2002, when BruinGO was suspended for the summer break. Riders then faced a choice between paying 75¢ to ride the Green Bus or waiting and paying 50¢ (the regular fare) to ride the Blue Bus. Forty-three percent of riders chose to wait for the Blue Bus, and save 25¢. These riders waited an average of 6.6 minutes, so they “earned” $2.27 per hour (25¢ fare savings x 6.6 minutes ÷ 60 minutes) for time spent waiting.
7
Fifty percent of waiters had a total wait of more than 10 minutes, while 50 percent payers had a total wait of less than 3 minutes. We asked a random sample of riders (n=41) how often they are payers and they told us that on average they pay to board the Green Bus 23 percent of the time. However, the boarding data reveal that only 14 percent of riders are payers. It appears that riders don’t like to appear to be penny pinchers, and so they overestimated their willingness to pay for a Green Bus ride.
8
See Beesley (1965), Gronau (1965), LGORU (1973), Lisco (1967), Mohring et al (1987), O’ Farrell and Markham (1975), Quarmby (1967), Small (1992), Talvitie (1972), and Wardman et al (2001) for examples from this large body of literature.
9
The authors surveyed motorists who were faced with the choice of trading wait time and money. Motorists were able to purchase gasoline at a high price without waiting in line, or to wait in a long line to purchase gasoline at a very low price. This experiment was possible because of gasoline price controls in the spring of 1980 that forced Standard Oil of California to charge a lower ceiling price (depending on service and grade) for gasoline. The regulations applied to stations owned and operated by integrated oil companies.
10
The salary is reported in the agreement between UCLA and the Academic Student Employee Unit and is available online at . 13
TRB 2003 Annual Meeting CD-ROM
Original paper submittal – not revised by author.
11
This estimate is based on 41 interviews of riders waiting for the bus.
12
Moreau (1992) reports that seven factors (which are not empirically tested) contribute to the phenomenon of “time drag” in which wait time seems longer than it actually is: (1) the passenger is unoccupied; (2) prior to (rather than during) service; (3) the customer is anxious; (4) the wait duration is unknown or variable; (5) delays are not explained; (6) the customer feels poorly served; and (7) customer is alone. For short wait times, 10 percent of customers experience “time drag” and for longer wait times, 30 percent of customers experience “time drag.”
14
TRB 2003 Annual Meeting CD-ROM
Original paper submittal – not revised by author.