May 20, 2010 - Similarity-sensitive hashing seeks compact representation of vector data as binary ... is usually very high, most existing data-structures for exact sublinear search ..... Lecture notes in computer science, 1327:583â588, 1997.
Technion - Computer Science Department - Tehnical Report CIS-2010-03 - 2010
WaldHash: sequential similarity-preserving hashing Alexander M. Bronstein1 , Michael M. Bronstein2 , Leonidas J. Guibas3 , and Maks Ovsjanikov4 1
Department of Electrical Engineering, Tel-Aviv University 2 Department of Computer Science, Technion 3 Department of Computer Science, Stanford University 4 Institute for Computational and Mathematical Engineering, Stanford University
May 20, 2010 Abstract Similarity-sensitive hashing seeks compact representation of vector data as binary codes, so that the Hamming distance between code words approximates the original similarity. In this paper, we show that using codes of fixed length is inherently inefficient as the similarity can often be approximated well using just a few bits. We formulate a sequential embedding problem and approach similarity computation as a sequential decision strategy. We show the relation of the optimal strategy that minimizes the average decision time to Wald’s sequential probability ratio test. Numerical experiments demonstrate that the proposed approach outperforms embedding into the Hamming space of fixed dimension in terms of the average decision time, while having similar accuracy.
1
Introduction
The need to perform large scale similarity-based search on high-dimensional data arises in a variety of applications. For example, in content-based retrieval of visual data, images are often represented as descriptor vectors in Rd , and retrieval of similar images is phrased as retrieval of similar descriptor vectors from a large database. Since the dimensionality of image descriptors 1
Technion - Computer Science Department - Tehnical Report CIS-2010-03 - 2010
is usually very high, most existing data-structures for exact sublinear search have very limited efficiency. Furthermore, the notion of similarity of the original data is intimately related to the choice of the metric in the descriptor space, which can range dramatically from one application to another. This latter fact not only complicates the modeling of the descriptor data, but also hinders the use of many algorithms for approximate search in high dimensions, which are designed for only a limited choice of metrics. Several approaches have been proposed for reducing the dimensionality of the data, while preserving characteristics such as pairwise distances, including linear and kernel PCA [10], multidimensional scaling (MDS) [3], Laplacian eigenmaps [1], diffusion maps [8], and Isomap [14], just to name a few. Unfortunately, most existing methods do not generalize naturally to previously unseen data, and while out-of-sample extensions to several dimensionality reduction techniques have been proposed [2], these extensions require prior knowledge of a kernel function on the original space. Defining the best metric in the descriptor space can be seen as a problem of metric learning, e.g., [4] which is most commonly solved via supervised or semi-supervised techniques. These methods assume some prior information on the distribution of similar and dissimilar pairs, and attempt to find the metric that best satisfies the constraints. Some parametric form of the metric (e.g. the Mahalanobis distance) is typically used [7]. Although recent techniques naturally extend to unseen data [4], the resulting metrics rarely follow a standard (e.g. Lp ) form, which can be used together with data-structures for fast search and retrieval. An important particular case of similarity-based search is binary classification, when a pair of data points are either similar or dissimilar. Returning to the content-based retrieval example, one is often interested in obtaining all images similar to the query. In this special case, this problem was recently addressed in [11] as similarity-sensitive hashing. In this work, the data are embedded into a space of binary strings (Hamming space) with the weighted hamming metric, given a set of positive and negative pairs in the original space. The mapping of the data into the Hamming space and the weights of the Hamming metric are optimized simultaneously. This combined procedure allows to address both the high dimensionality of the data as well as the choice of the metric in the reduced space that satisfies the similarity constraints. These ideas have been used successfully in computer vision and pattern recognition applications ranging from content-based image retrieval [15] to pose estimation [12]. One of the major limitations of the method proposed in [11] is the necessity to compare all bits of the embedded descriptors to reach a decision between the similarity of a pair of descriptors. Since in many natural applica2
Technion - Computer Science Department - Tehnical Report CIS-2010-03 - 2010
tions most pairs correspond to highly dissimilar data points, this procedure will spend a lot of effort to ultimately reject all but a few pairs. For this reason, using codes of fixed length is inherently inefficient and the similarity between many pairs of vectors can be approximated well from a projection onto a lower-dimension Hamming space. The question of what is the minimum descriptor length required to discern an object from a database containing similar and dissimilar objects, is fundamental in information retrieval. In this paper, we try to approach this challenge by a modification of similarity-preserving hashing that looks at subsets of the bitcodes and allows early acceptance or rejection. We formulate a sequential embedding problem and approach similarity computation as a sequential decision strategy and show the relation of the optimal strategy that minimizes the average decision time to Wald’s sequential probability ratio test.
2
Similarity-preserving hashing
Let X ⊆ Rd be the space of data points, and let s : X × X → {±1} be an unknown binary similarity function between them. The similarity s partitions the set X × X of all pairs of data points into positives {(x, y) : s(x, y) = +1} and negatives {(x, y) : s(x, y) = −1}. The goal of similarity learning is to construct another binary similarity function sˆ that approximates the unknown s as faithfully as possible. To evaluate the quality of such an approximation, it is common to associate with sˆ the expected false positive and negative rates, F P = E{ˆ s(x, y) = +1|s(x, y) = −1} F N = E{ˆ s(x, y) = −1|s(x, y) = +1},
(1)
and the related true positive and negative rates, T P = 1 − F N and T N = 1−F P . Here, the expectations are taken with respect to the joint distribution of pairs (in the context of retrieval, where (x, y) are obtained by pairing a query with all the examples in the database, this means the product of marginal distributions). A popular variant of similarity learning involves embedding of the data points into some metric space (Z, dZ ) by means of a map ξ : X → Z. The distance dZ represents the similarity of the embedded points, in the sense that lower dZ (ξ(x), ξ(y)) corresponds to higher probability that s(x, y) = +1. Alternatively, one can find a range of radii R such that with high probability positive pairs have dZ ◦(ξ ×ξ) < R, while negative pairs have dZ ◦(ξ ×ξ) > R. A map ξ satisfying this property is said to be sensitive to the similarity s, 3
Technion - Computer Science Department - Tehnical Report CIS-2010-03 - 2010
and it naturally defines a binary classifier sˆ(x, y) = sign (R − dZ (ξ(x), ξ(y))) on the space of pairs of data points. In practice this means that, given a query point, retrieval of similar points from a database translates into search of k nearest neighbors or a radius R range query in the embedded space Z. In [11], the weighted n-dimensional Hamming space Hn was proposed as the embedding space Z. Such a mapping encodes each data point as an n-bit binary string. The correlation between positive similarity of a pair of points and small Hamming distance between their corresponding codes implies that positives are likely to be mapped to the same code. This fact allows to interpret the Hamming embedding as similarity-sensitive hashing, under which positive pairs have high collision probability, while negative pairs are unlikely to collide. The n-dimensional Hamming embedding can be thought of as a vector ξ(x) = (ξ1 (x), . . . , ξn (x)) of binary embeddings of the form ½ 0 if fi (x) ≤ 0; (2) ξi (x) = 1 if fi (x) > 0, parametrized by a projection fi : X → R. Each such map ξi defines a weak binary classifier on pairs of data points, ½ +1 if ξi (x) = ξi (y); (3) hi (x, y) = −1 otherwise. Using this terminology, the weighted Hamming metric between the embeddings ξ(x) and ξ(y) of a pair of data points (x, y) can be expressed as a (possibly weighted) superposition of weak classifiers, n
n
1X 1X dHn (ξ(x), ξ(y)) = αi − αi hi (x, y), 2 i=1 2 i=1
(4)
where αi > 0 is the weight of the i-th bit (αi = 1 in the unweighted case). Observing the resemblance with cascaded binary classifiers, the idea of constructing the similarity-sensitive embedding using the standard boosting approach was proposed in [11]. Specifically, the use of AdaBoost [5] was made to find a greedy approximation to the minimizer of the exponential loss function L = E{e−s(x,y)ˆs(x,y) }, where in practice the expectation is replaced by an empirical average on the training set. The exponential loss is a reasonable selection of the objective function, as it constitutes an upper bound on the training error. Furthermore, the minimization of L is equivalent to the minimization of the sum of the error rates F N + F P or, alternatively, to the maximization of the gap T P − F P . The latter is directly related to the sensitivity of the embedding to the similarity function being learned [11]. 4
Technion - Computer Science Department - Tehnical Report CIS-2010-03 - 2010
3
Sequential Hamming embedding
The main disadvantage of the Hamming embedding is the fact that in order to classify a pair of vectors, all n bits of their representations have to be compared, regardless of how the vectors lie in Rd . Yet, a pair of vectors lying close to the boundary between positives and negatives would normally require a large number of bits to be classified correctly, which is usually unnecessary to discriminate between pairs of very similar or very dissimilar vectors. Since in most applications, negative pairs are a lot more common than the positive ones, Hamming embeddings conceal an inherent inefficiency. We propose a remedy to this inefficiency by approaching the embedding problem as a sequential test. Let (x, y) be a pair of descriptors under test, and let {m1 (x, y), m2 (x, y), . . . } be a sequence of measurements. A sequential decision strategy S is the sequence of decision functions S = {S1 , S2 , . . . } where Sk : (m1 , . . . , mk ) → {−1, +1, \}. The sign \ means that the pair (x, y) is undecided from the first k measurements. The strategy is evaluated sequentially starting from k = 1 until a decision of ±1 is made. For a strategy S that terminates in finite time, we denote by F P (S) and F N (S) the false positive and false negative rates associated with S. In this terminology, the embedding can be though of as a measurement. Formally, we consider a filtration of Hamming spaces H1 ⊂ H2 ⊂ · · · and a filtration of embeddings ϕ = {ϕ1 (x), ϕ2 (x), . . . }, where each ϕk (x) = (ξ1 (x), . . . , ξk (x)) is a k-dimensional binary string with the bits ξi (x) defined in (2). Here, we limit our attention to the affine projections of the form fi (x) = aT i x + bi , where ai are d-dimensional vectors, and bi are scalars. Extension to more complex projections is relatively straightforward. In this notation, the sequence of the first k measurements of (x, y) can be expressed as (m1 , . . . , mk ) = (ϕk (x), ϕk (y)). We stress that such a separable structure of the measurements is required in our problem, as it allows to perform the test entirely in the embedding space on the pairs of representations (ϕk (x), ϕk (y)) without the need to use the original data. The sequential decision strategy associated with the embeddings is +1 : dH (ϕk (x), ϕk (y)) ≤ τk+ −1 : dH (ϕk (x), ϕk (y)) > τk− (5) Sk (x, y) = \ : otherwise. The acceptance and rejection thresholds τ = {(τ1+ , τ1− ), (τ2+ , τ2− ), . . . } are selected to achieve the desired trade-off between false acceptance and false rejection rates. We will use S and (ϕ, τ ) interchangeably. We denote by T (x, y) = min{k : Sk (x, y) 6= \} 5
(6)
Technion - Computer Science Department - Tehnical Report CIS-2010-03 - 2010
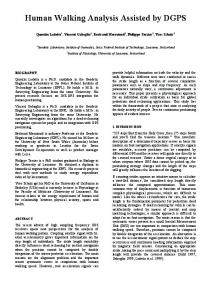
the decision time, i.e., the smallest k for which a decision is made about (x, y). Decision time is a random variable that will usually increase close to the decision boundary as visualized in Fig. 1. T (x, y) can be interpreted as the complexity of the pair (x, y). The expected decision time associated with a sequential decision strategy is T (S) = E(T ) = E(T | + 1)P(+1) + E(T | − 1)P(+1).
(7)
Approximating T using a finite sample of training data is challenging as usually P(−1) is overwhelmingly higher than P(+1). This lack of balance explodes with the dimension due to the curse of dimensionality. We aim at finding the optimal embedding (ϕ, τ ) in the sense of ½ F P (ϕ, τ ) ≤ F P min T (ϕ, τ ) s.t. (8) F N (ϕ, τ ) ≤ F N, ϕ,τ where F P (ϕ, τ ) and F N (ϕ, τ ) are the false positive and false negative rates characterizing the test (ϕ, τ ), and F P and F N are some target rates.
3.1
Wald’s sequential probability ratio test
Wald [16] studied the problem of sequential hypothesis testing, in which and an object z = (x, y) is tested against a pair of hypotheses +1 and −1. The goal is to decide on the hypothesis best describing z from successive measurements m1 , m2 , . . . of z. Assuming that the joint conditional distributions P(m1 , . . . , mk | + 1) and P(m1 , . . . , mk | − 1) of the measurements given the hypothesis are known for all k = 1, 2, . . . , Wald defined the sequential probability ratio test (SPRT) as the decision strategy +1 : Rk ≤ τ∗+ −1 : Rk ≥ τ∗− Sk∗ (z) = (9) \ : τ∗+ < Rk < τ∗− , where Rk is the likelihood ratio Rk =
P(m1 , . . . , mk | − 1) . P(m1 , . . . , mk | + 1)
(10)
Theorem 1 (Wald). There exist such τ∗+ and τ∗− such that SPRT is an optimal test in the sense of ½ F P (S) ≤ F P min T (S) s.t. F N (S) ≤ F N. S 6
Technion - Computer Science Department - Tehnical Report CIS-2010-03 - 2010
Though the optimal thresholds τ∗+ and τ∗− are difficult to compute in practice, the following approximation is available due to Wald: Theorem 2 (Wald). The thresholds τ∗+ and τ∗− in (9) are bounded by FP 1 − FN 1 − FP = . FN
τ∗+ ≥ τ 0+ = τ∗− ≤ τ 0−
(11)
Furthermore, when the bounds τ 0+ and τ 0− are used in (9) instead of the optimal τ∗+ and τ∗− , the error rates of the sequential decision strategy change to F P 0 and F N 0 for which F P 0 + F N 0 ≤ F P + F N .
3.2
WaldBoost
Though in his studies Wald limited his attention to the simplified case of i.i.d. measurements, the SPRT is valid in general cases. However, the practicality of such a test is limited to a very modest k, as the evaluation of the likelihood ratios Rk in (9) involves multi-dimensional density estimation. A remedy to this problem was proposed by Sochman and Matas [13] who used AdaBoost for ordering the measurements and for approximation of the likelihood ratios, dubbing the resulting learning procedure as WaldBoost. Specifically, the authors examined the real AdaBoost, in which a strong classifier Hk (z) =
k X
hi (z)
(12)
i=1
is constructed as a sum of some real-valued weak classifiers hi . The algorithm is a greedy approximation to the minimizer of the exponential loss ¡ ¢ L(H) = E e−l(z)H(z) , (13) where l(z) = +1 if z is positive, and l(z) = −1 otherwise. One of the powerful properties of AdaBoost is the fact that selecting the weak classifier at each iteration k to be even slightly better than a random coin toss leads to the following asymptotic behavior [6]: H∞ (z) = lim Hk (z) = arg min L(H) = k→∞
H
1 P(+1|z) log , 2 P(−1|z)
which using the Bayes theorem can be rewritten as P(z| − 1) 1 P(+1) 1 + log . H∞ (z) = − log 2 P(z| + 1) 2 P(−1) 7
(14)
Technion - Computer Science Department - Tehnical Report CIS-2010-03 - 2010
If we are free in the selection of an arbitrary weak classifier, the fastest convergence is achieved by hk+1 (z) = arg min L(Hk + h) = h
1 P(+1|z, wk (z)) log 2 P(−1|z, wk (z))
where wk (z) = e−l(z)Hk (z) is the (unnormalized) weight of the sample z. Arguing that the asymptotic relation (14) holds approximately for a finite k, one gets 1 P(h1 (z), . . . , hk (z)| − 1) Hk (z) ≈ − log 2 P(h1 (z), . . . , hk (z)| + 1) 1 P(+1) 1 + log = − log Rk (z) + const 2 P(−1) 2 where Rk (z) =
P(h1 (z), . . . , hk (z)|l(z) = −1) P(h1 (z), . . . , hk (z)|l(z) = +1)
(15)
is the likelihood ratio of the k observations h1 (z), . . . , hk (z) of z. This relation between the strong classifier Hk (z) and the log-likelihood ratio is fundamental, as it allows to replace the k-dimensional observation (h1 (z), . . . , hk (z)) of z in Rk (z) by its one-dimensional projection Hk (z) = h1 (z) + · · · + hk (z), resulting in the following one-dimensional approximation of the likelihood ratio ˆ k (z) = P(Hk (z)| − 1) . R P(Hk (z)| + 1) Replacing Rk in the SPRT (9) by decision strategy +1 −1 Sk (z) = \
(16)
−Hk (z) yields the following sequential : Hk (z) ≥ τk+ : Hk (z) ≤ τk− : τk− < Hk (z) < τk+ ,
(17)
which approaches the true SPRT as k grows. The thresholds τk+ and τk− are obtained from the estimated conditional densities of Hk | + 1 and Hk | − 1. ˆ k approximates Rk rather inaccurately, special precaution Since for small k’s R has to be taken to establish the thresholds. Sochman and Matas propose to use a separate validation set (independent of the training set), on which the densities are estimated using oversmoothed Parzen sums. The authors 8
Technion - Computer Science Department - Tehnical Report CIS-2010-03 - 2010
1 2 3 4
Input: set of N examples (xi , yi ) ∈ Rd with known similarity si = s(xi , yi ); desired false negative and false positive rates F N and F P . Initialize weights wi = 1/N . Set τ 0+ = F P/(1 − F N ) and τ 0− = (1 − F P )/F N . for k = 1, 2, . . . do Select ak and bk in ξk (x) = sign(aT k x + bk ) minimizing N X wi e−si ξk (xi )ξk (yi ) (18) i=1
5 6 7 8 9 10
ˆ k according to (16). Estimate R Find threshold τk+ and τk− . Throw samples with Hk (xi , yi ) ≥ τk− or Hk (xi , yi ) ≤ τk+ . Sample in new data into training set. Update weights wi = wi e−si Hk (xi ,yi ) . end Algorithm 1: Wald embedding
remark that such a conservative approach may result in a suboptimal decision strategy, yet it allows to reduce the risks of wrong irreversible decisions. Another advantage of WaldBoost compared to AdaBoost is the fact that samples for which a decision has been made at iteration k are excluded from the training set at subsequent iterations. New samples can be added to the training set replacing the removed ones. This allows WaldBoost to explore a potentially very large set of negative examples while keeping a modestly sized training set at each iteration.
3.3
Wald embedding
In the same manner Shakhnarovich [11] used AdaBoost as a tool for the approximation of the Hamming embedding minimizing F N +F P , we propose to use WaldBoost to approximately solve (8). Treating pairs of vectors (x, y) as objects z to be classified, we also restrict the family of weak classifiers to the separable form h(x, y) = ϕ(x)ϕ(y). This allows to construct a sequential decision strategy of the form (5), which is a separable approximation of the truly optimal SPRT. The entire learning procedure is outlined in Algorithm 1. The minimization in Step 4 by means of which the projection is constructed is crucial to the efficiency of the embedding procedure. As in AdaBoost, minimization of (18) can be replaced by the equivalent maximization 9
Technion - Computer Science Department - Tehnical Report CIS-2010-03 - 2010
of labels with the outputs of the weak classifier, rk =
N X
T wi si sign (aT k xi + ak )sign (ak yi + bk ).
(19)
i=1
Maximizing rk with respect to the projection parameters is difficult because of the sign function. In his AdaBoost-based embedding, Shakhnarovich proposed to search the vector ak among the standard basis vectors in Rd . While being simple, this choice is clearly suboptimal. Here, we propose an alternative similar in its spirit to linear discriminative analysis (LDA), by first observing that the maximizer of r is closely related to the maximizer of a simpler function, rˆk =
N X
T vi (aT k xi )(ak y i ),
(20)
i=1
where xi and y i are xi and yi centered by their weighted means, and vi = wi si . Rewriting the above yields à N ! X rˆk = aT vi xi y T ak = aT (21) k i k Cak , i=1
where C can be thought of as the difference between weighted covariance matrices of positive and negative pairs of the training data points. The unit projection direction ak and qi maximizing rˆk corresponds to the largest eigenvector of C. In practice, since the minimizers of rˆk and rk are not identical, we project xi and yi onto the subspaces spanned by M largest eigenvectors. Selecting M ¿ d allows to greatly reduce the search space complexity. In our experiments, M was empirically set to 10; further increase of M did not bring significant improvement. Once the optimal ak is found and fixed, the scalar bk is searched for to minimize the exponential loss. This can be done e.g. using line search.
4
Results
Synthetic data. We compared a variant of Shakhnarovich’s AdaBoost-based embedding and the proposed WaldHash algorithm on uniformly distributed points on [0, 1]d , with the dimension varying from d = 2 to 8. As the underlying binary metric, we used dX (x, y) = sign(0.2 − kx − yk2 ). The training was performed on a set of 5 × 10⁴ positive and 2 × 10⁵ negative pairs. The test set contained the same amount of data. For the selection of thresholds 10
Technion - Computer Science Department - Tehnical Report CIS-2010-03 - 2010
in WaldBoost, we used a validation set with 5 × 10⁴ positive and 5 × 10⁴ negative pairs. For fairness of comparison, in both algorithms we used the same direction decision strategy outlined in Section 3.3. Fig. 2 (top) shows the misclassification rate achieved by both algorithms as a function of the embedding space size n. Both approaches achieve similar performance, which increases as the dimension grows. Fig. 2 (bottom) compares the average decision time. One can see the clear advantage of the proposed approach. Fig. 1 visualizes the decision time for different data points in a two-dimensional example, showing that starting already from as little as six bits, decision can be made for considerable portions of the space. Image retrieval. Both algorithms were tested on the image dataset from [15]. A set of about 50K images was used described by a 512-dimensional GIST descriptor. 1 × 10⁴ positive pairs and 5 × 10⁴ negative pairs were used for training. Testing was performed on 5×10⁴ pairs. Fig. 3 shows the average decision time as a function of the embedding space dimension n. Until about 8 bits, early decision rate is low and both algorithms have approximately the same decision time. The relative efficiency of Wald embedding grows with n, exceeding a two-fold improvement for n = 60. Shape retrieval. The proposed approach also was tested on shape retrieval applications, using the ShapeGoogle dataset and bag-of-features shape descriptors used in [9]. We computed 48 dimensional descriptor for 1052 shapes in the database, containing over 450 shape classes. Shapes appeared under multiple transformations. The positive set contained all transformations of the same shape (104 pairs); the negative set contained different shapes (5 × 10⁴ pairs). Figure 4 shows an example of shape retrieval using the proposed WaldHash, by subsequently comparing the bits of the query bitcode to the bitcodes of the shapes in the database. The database is represented as a tree using bitcodes of different length. The kth tree level corresponds to the kth bit in the bitcode. Each shape in the tree is represented as a path from the root to a leaf. A query bitcode 101110010... representing the centaur shape (shown as a bold black path in the tree) is looked up in the database by sequentially comparing the bits of the bitcodes. Rejection thresholds allow to early discard significant parts of the database: four bits are sufficient to reject 16 shapes corresponding to branch 0100 marked in red (1.5% of the database); five bits are already sufficient to reject 337 shapes (constituting 32% of the database). Acceptance thresholds allow to early decide using 17 first bits (bitcode 10111001010100110 shown in green). Figure 5 shows another retrieval examples with cat and bird shapes used as queries. In both cases, early decision can be done after 17 first bits using the acceptance threshold. Shown in red are parts of the tree discarded during 11
Technion - Computer Science Department - Tehnical Report CIS-2010-03 - 2010
the decision process based on the rejection thresholds. All the matches are correct except for the last query (bird), where three out of total 18 matches are incorrect.
5
Conclusion
In this paper, we addressed compact similarity-preserving representation of high-dimensional data. We showed that in the Hamming embedding introduced by Shakhnarovich [11], the dimension of the embedding space is driven by the worst-case behavior arising close to the decision boundary, which is infrequent among pairs of classified descriptors. As an alternative, we proposed the sequential embedding, allowing early decision for pairs lying far from the decision boundary. We showed that construction of such a sequential decision strategy can be reduced to separable approximation of the SPRT, and proposed to use the recently introduced WaldBoost algorithm for its practical numerical computation. While the Hamming embedding can be viewed as optimal selection of the projections in locality sensitive hashing, our sequential embedding can be thought of as an optimal decision tree. It should be thus easily mappable to existing database management systems. Finally, to properly position the contribution of this paper and quoting Richard Hamming himself, we believe our work presents an attempt to address a very important problem, and in the future we intend to explore the full potential of this direction.
References [1] M. Belkin and P. Niyogi. Laplacian eigenmaps for dimensionality reduction and data representation. Neural computation, 15(6):1373–1396, 2003. [2] Y. Bengio, J.-F. Paiement, P. Vincent, O. Delalleau, N. Le Roux, and M. Ouimet. Out-of-sample extensions for lle, isomap, mds, eigenmaps, and spectral clustering. In Advances in Neural Information Processing Systems. 2004. [3] T.F. Cox and M.A.A. Cox. Multidimensional scaling. CRC Press, 2000. [4] J. V. Davis, B. Kulis, P. Jain, and S. Sraand I. S. Dhillon. Informationtheoretic metric learning. In Proc. ICML, pages 209–216, 2007. [5] Y. Freund and R. E. Schapire. A decision-theoretic generalization of on-line learning and an application to boosting. In Proc. European Conf. Computational Learning Theory, 1995.
12
Technion - Computer Science Department - Tehnical Report CIS-2010-03 - 2010
[6] J. Friedman, T. Hastie, and R. Tibshirani. Special invited paper. additive logistic regression: A statistical view of boosting. The annals of statistics, 28(2):337–374, 2000. [7] P. Jain, B. Kulis, and K. Grauman. Fast image search for learned metrics. In Proc. CVPR, 2008. [8] S. Lafon and A. B. Lee. Diffusion maps and coarse-graining: A unified framework for dimensionality reduction, graph partitioning, and data set parameterization. Trans. PAMI, 28(9):1393–1403, 2006. [9] M. Ovsjanikov, A. M. Bronstein, M. M. Bronstein, and L. J. Guibas. ShapeGoogle: a computer vision approach for invariant shape retrieval. In Proc. NORDIA, 2009. [10] B. Scholkopf, A.J. Smola, and K.R. Muller. Kernel principal component analysis. Lecture notes in computer science, 1327:583–588, 1997. [11] G. Shakhnarovich. Learning task-specific similarity. PhD thesis, MIT, 2005. [12] G. Shakhnarovich, P. Viola, and T. Darrell. Fast pose estimation with parameter-sensitive hashing. In Proc. ICCV, 2003. [13] J. Sochman and Jiri Matas. Waldboost – learning for time constrained sequential detection. In Proc. CVPR, 2005. [14] J.B. Tenenbaum, V. Silva, and J.C. Langford. A global geometric framework for nonlinear dimensionality reduction. Science, 290(5500), 2000. [15] A. Torralba, R. Fergus, and Y. Weiss. Small codes and large image databases for recognition. In Proc. CVPR, 2008. [16] A. Wald. Sequential analysis. Dover, 1947.
13
Technion - Computer Science Department - Tehnical Report CIS-2010-03 - 2010
accept
1 bit
2 bits
4 bits
6 bits
8 bits
12 bits
16 bits
24 bits
32 bits
0
1
2
3
4
5
6
7
8
9
≥ 10
reject
Figure 1: Sequential test for the two-dimensional uniform distribution obtained using WaldBoost with target F P = F N = 0.5%. Different colors encode metric balls of different radii, and vector for which an accepted/rejection decision is made are indicated by pink/light blue, respectively.
14
Misclassification rate
d=2
10− 2
d=8
10− 3 4
Average decision time
Technion - Computer Science Department - Tehnical Report CIS-2010-03 - 2010
10 −1
32 28 24 20 16 12 8 4 0
2
8
3
12
4
16 Number of bits
5 Dimension
20
24
6
28
7
32
8
Figure 2: Comparison of the proposed WaldHash (dashed line) and Shakhnarovich’s embedding (solid line) on d-dimensional synthetic uniformly distributed data. Top row: misclassification rate of dimensions d = 2 and 8 as a function of the number of bits n. Bottom row: average decision time on uniform data as a function of the dimension d for n = 32. Note that the average decision time decreases as the dimension grows.
15
55 50 45 40 Average decision time
Technion - Computer Science Department - Tehnical Report CIS-2010-03 - 2010
60
35 30 25 20 15 10 5 1
1
5
10
15
20
25
30 35 Number of bits
40
45
50
55
60
Figure 3: Average decision time on GIST data as a function of the embedding dimension n. Shown is the proposed Wald embedding (dashed line) and, for reference, Shakhnarovich’s embedding.
16
Technion - Computer Science Department - Tehnical Report CIS-2010-03 - 2010
Figure 4: Example of rejection and acceptance based on Wald’s sequential probability test.
Figure 5: Examples of shape retrieval using Wald’s sequential probability test. Shown in red are rejected shapes.
17