Aug 20, 2008 - tools intensively used in time series analysis and ...... as Web developer in some other projects and as ... ger-Verlag, Ios Press, Kluwer, etc.
Water flows modelling and forecasting using a RBF neural network Carlos H. Fajardo Toro Daniel González Peña Benedicto Soto González Florentino Fernández _ Riverola
Fecha de recepción: 15-01-2008
Fecha de selección: 17-10-2008
ABSTRACT A hydrologic estimation model based on the utilisation of radial basis function neural networks is presented, in which the aim is to forecast stream flows in an automated fashion. The problem of river flow forecasting is a non-trivial task because (i) the various physical mechanisms governing the river flow dynamics act on a wide range of temporal and spatial scales and (ii) almost all mechanisms involved in the river flow process present some degree of nonlinearity. The proposed neural network was used to forecast daily river discharges in a river basin providing satisfactory results and outperforming previous
Water flows modelling and forecasting using a RBF neural network
Fecha de aceptación: 20-08-2008
successful techniques. The proposed model has been recently used to make hydrologic estimations in the Ulloa river, a river basin located in the north west of the Iberian Peninsula. The results obtained from the experiments are presented and discussed. KEYWORDS Radial Basis Function network, river flow forecasting, hydrologic models, black-box models, auto-regressive models. RESUMEN Aquí se presenta un modelo hidrológico de estimación basado en el uso de una red neuronal de base radial, con
SISTEMAS & TELEMÁTICA
13
el cual se busca desarrollar sistema automática de estimación de flujos de caudal. El problema de la estimación de caudales no es una tarea trivial debido a (i) que los diversos mecanismos que rigen el sistema que determina el flujo de caudales actúan dentro de un rango muy amplio de escalas espacio – temporales y (ii) casi todos los elementos que intervienen y afectan el flujo de caudales presentan cierto grado de no linealidad. La red neuronal propuesta ha sido utilizada para estimar el pronóstico diario de caudal de una cuenca, obteniéndose
14
SISTEMAS & TELEMÁTICA
resultados satisfactorios frente a otras técnicas. El modelo propuesto ha sido utilizado para realizar estimaciones en el río Ulloa, una cuenca ubicada al noroeste de la Península Ibérica. Aquí se presentan y discuten los resultados obtenidos con los experimentos realizados. PALABRAS CLAVE Red Neuronal de base Radial (RBF), Pronóstico de caudal, modelos hidrológicos, modelos de caja negra, modelos autorregresivos. Clasificación Colciencias: Tipo 1
Vol. 6 No. 12 • Julio - Diciembre de 2008
1. INTRODUCTION AND MOTIVATION Forecasting the behavior of a dynamic system is, in general, a difficult task. In situations in which the rules that determine a system are unknown, the prediction of the parameter values that determine the characteristic behavior of the system can be a problematic task. In this context, one of the most complex processes we have to face is the decision-making process. The complexity is due to the uncertainty associated to the occurrence probability of the events belonging to the variable, which affects the decision-making process. In order to reduce this uncertainty, people usually resort to tools that allow predicting or forecasting the value or behavior that are going to have the variable. In this sense, the ability to make an accurate prediction of these events or factors prior to take a decision should permit to reduce the risk and choose the better choice. Accurate forecasting of river flow is needed due to the importance of several tasks: (i) optimal design of water storage and drainage networks, (ii) management of extreme events, such as floods and droughts, (iii) to plan to future expansion or reduction (iv) bringing benefits for efficiency at power generation and (v) the prevention and comprehension of hydrologic hazards like the change of hydro climatic regime, erosion and sediment movement, mud flows or Environmental pollutants.[1, 2] Forecasting of daily discharges has been one of the important problems for hydrologist, reservoir operators and flood protection engineers mainly because of the inherently non-linear relationships
Water flows modelling and forecasting using a RBF neural network
between input and output variables that complicate attempts to forecast stream flow events. The temporal and spatial variability that characterizes a river system makes flow forecasting a very demanding task. During the past decades, the most widely used stochastic models for river flow forecasting belong to the class of ARIMA models.[3, 4, 5, 6, 7] These set of models as well as other time series approaches[8] and multiple regression techniques have directed river flow forecasting studies. However, artificial neural networks (ANNs) have recently come turning one from the tools intensively used in time series analysis and therefore also in hydrologic estimations. ANNs are probably the most successful machine learning technique with flexible mathematical structure, which is capable of identifying complex non-linear relationships between input and output data, without attempting to reach understanding as to the nature of the phenomena.[9] An important aim in the current work is to develop a forecasting mechanism able to deal with little river flow, where a good forecasting system enables an accurate estimation of available water to cultivate or drainage estimation. For this purpose, we study the daily mean flow data belonging to the experimental Ulloa river basin ‘O Abelar’. The river basin is located in Abegondo (A Coruña, Spain) at 8º 21’ 15”N, 43º 9’ 10”W. The experimental river basin has an area of 10.7 ha. and it is situated between 400 and 430 meters’ height. The raw data, which is received and processed daily, has a length of 8 years covering
SISTEMAS & TELEMÁTICA
15
a time between the year 1997 up to including the year 2005. In this study, radial basis function (RBF) neural networks were used to calculate the forecast of the daily water volume. The study is based on the successful results obtained with the hybrid case-based reasoning system reported[10] and used to predict the evolution of the temperature of the water ahead of an ongoing vessel, in real time. RBF networks have demonstrated their utility as universal approximators for closely modelling this continuous process. The approach, which is discussed, is capable of producing satisfactory results in situations in which statistical models have been sufficiently successful. The structure of the paper is as follows: section 2 summarizes previous effort in flow river forecasting; section 3 explains in detail the architecture of the proposed forecasting RBF neural network; section 4 presents and analyzes the results obtained with several techniques; and finally, section 5 concludes the study and establishes future research lines. 2. RIVER FLOW FORECAST River flow forecasting is one of the earliest forecasting problems that have attracted the interest of scientists. The importance of estimating river flows to the livelihoods of the inhabitants around rivers, make necessary the study and record of the levels since earliest history. In fact, the ancient Egyptians established mechanisms to make measurements that can in a future help to estimate the floods, that as it is known, they were very important for their survival.[11]
16
SISTEMAS & TELEMÁTICA
Estimating the flows of rivers can have a significant economic impact. Actually, the forecasting of river flows is important for aspects like floods, control of dams and water supply since they are aspects that normally have great effects in the economy and life of the different societies. 2.1 Classical Forecasting Methods During the past few decades, a great deal of research has been devoted to the modeling and forecasting of river flow dynamics. This fact is explained because, before the development and application of AI tools in this field, the hydrologist and researchers have to recur to some forecast methods or to develop new ones according to the characteristics of the problem. Many of the techniques currently used in modeling hydrological time series and generating synthetic stream flows assume linear relationships amongst the variables. The two main groups of techniques include (i) hydrologic models and (ii) black-box models.[1] Actually exist many ways to define the hydrological models, but essentially can be classifying from three points of view: (i) spatial representation based, (ii) based on the hydrological processes representation (iii) based on the temporal extension in which can be applied the model.[1, 26, 27, 28, 29, 30, 31]
The classification spatial representation based have three kind of models: (i) aggregated models (ii) semi-distributed models and (iii) distributed models. In the first case, the aggregated models, they assume an uniform spatial rain distribution
Vol. 6 No. 12 • Julio - Diciembre de 2008
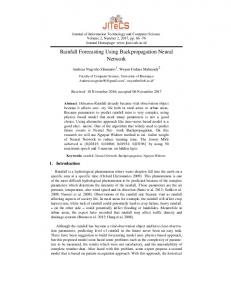
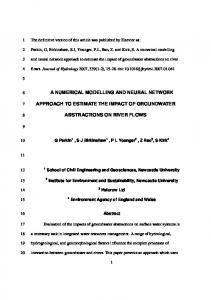
as well as for all the parameters of hydrological variables are considered global for the whole basin and constant all the time. On the other hand are the semi-distributed models, which allow some variability of the rain spatial distribution as well as to the hydrological variables parameters. The third kind of models, the distributed models, permits a variability of the parameters and of the rain spatial distribution, dividing the basin in cells and simulating hydrological processes in each one. In case of classification based on the hydrological processes representation, there is three main categories: (i) physically based models, (ii) conceptual models and (iii) metric models. On one hand, physically based models are specifically designed to mathematically simulate or approximate the general internal subprocesses and physical mechanisms that govern the river flow process. The input is the precipitation values and is partitioned into components that are routed through the sub-processes either to the watershed outlet as stream flow or to the surface and
Top of Atm
A
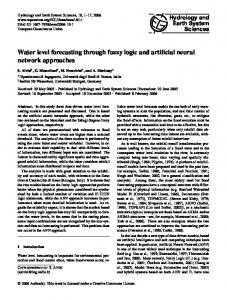
On the other hand (conceptual models), the parameters need to be estimated from model fitting to historical rainfall-runoff data. Figure 2 shows a typical structure of a conceptual watershed hydrology model. Therefore, it is not possible to use a conceptual model in engaged watersheds where there are no historical rainfall-runoff data. The metric models are those that depend on observed data, doing a search on the data to characterize the system response. That characterization is done through an information extraction method from the existing data. These models are built with a minimum or null consideration of the physical processes that occurs on the hydrological system, and use the most simple watershed representation. The principal advantage of these models is that they required a minimum data amount but have a
Incoming Shortwave
Outgoing Longwave Ozone Absorption & Emission
200 hPa
500 hPa
deep storages or to the atmosphere as evaporation.[1] Figure 1 presents a simplified hydrological model that shows five physical variables and their interactions.
Cloud
Latent Heat Fluxes Precipitation ET
Stratosphere
H2O and CO2 Absorption & Emission
Troposphere Sensible Heat Flux
Ground Figure 1. Simplified hydro climate model (physically based model)
Water flows modelling and forecasting using a RBF neural network
SISTEMAS & TELEMÁTICA
17
limited application because the variability of observed data and they are not capable of considering watershed changes.
the daily, monthly and seasonal runoff simulation, in other words, allows In other words, allows simulations for periods more extended than a rain episode.
The classification based on the temporal extension in which can be applied the model have to categories: (i) event-driven model, developed for short time simulations, normally a unique rain episode. The model focuses on the simulation of infiltration processes and surface runoff, because their basic target is the direct runoff. (ii) Continuous model, which allows
The black-box approaches are designed to identify the connection between the inputs and the outputs without going into the analysis of the internal structure of the physical process. In this approach, stochastic models (time series models, Marcov models, random walk models, etc.) are fitted to historical records in
SNOWFALL
To H0
SNOW MELTING
Snowpack
RAINFALL
X0
Y0 PRECIPITATION
X1 EVAPOTRANSPIRATION Y 11 Y
EXCEDENCE
X2 Hu
T1 H1 Static storage
INFILTRATION
X3
T2
Y2
H2
DIRECT RUNOFF
Surface storage PERCOLATION
X4 UNDERGROUND LOSSES
X5
T3
Y3
H3
INTERFLOW
Gravitational storage
T4 H4
Y4 BASE FLOW
Aquifer
T5 H5 Channel
Figure 2. Typical structure of a conceptual watershed hydrology model
18
SISTEMAS & TELEMÁTICA
Vol. 6 No. 12 • Julio - Diciembre de 2008
order to forecast the near term and long term behavior of the hydrologic variables that represents the states of the hydrologic phenomena on specific study. While physically based models are very useful to our understanding of the physical mechanisms involved in the river flow or any other hydrological process, unfortunately, they also possess great application difficulties.[1,12] The main drawbacks are motivated by the fact that they (i) require a large number of parameters for modeling the complexity of river flow dynamics and (ii) the extension of a particular model to even slightly different situations is very difficult. [1] Instead of this, blackbox models may not necessarily lead to a better understanding of the river flow process, but have an advantage in that they are easier to apply for even different conditions since the modelling and forecasting procedure is usually analogous. Furthermore, the analysis of the characteristic parameters of blackbox models can furnish useful information on the dynamics of the phenomenon. At the black-box approach, the AR models are those of more extended use, especially the ARMA and ARIMA models. Some other simple methods could be use like moving average, exponential smoothing or regression models (simple and multiple) depending on the number of available variables and their correlation. Moreover, some hydrological research work suggests the utilization of some techniques according to the characteristics of the series. For stationary single and multiple series, it is suggested to use AR, ARMA and ARIMA
Water flows modelling and forecasting using a RBF neural network
models as well as the GAR (Gamma autoregressive) model.[13] In the case of single and multiple periodic time series, it is appropriate the utilization of PAR, PARMA and periodic GAR models.[13] However, such models do not attempt to correctly represent the nonlinear characteristics in the hydrologic process, specially because the time series analysis depends on the what occurs on the past, supposing ‘no change causes’, which is something that does not happen within the hydrological domain. 2.2 Recent Trends Over the past 15 years there has been an increasing interest in the application of ANNs to the hydrological domain, mainly for simulating, forecasting and predicting the possible behavior that can take the different hydrological variables.[9] As aforementioned, almost all the hydrological variables and processes exhibit high non-linearity and, in many cases, they represent those variables and processes with the conventional physically based. The use of conventional or statistical models is not appropriate because of the poor understanding about the relations and interactions at the processes. There is thus a need for improvement in forecasting techniques. In this sense, artificial neural networks are flexible structures capable of identifying the complex non-linear relationships between input and output data sets. Although a variety of neural network architectures and neuro-fuzzy models are available from river flow studies, only some techniques have sufficiently demonstrated their accuracy.
SISTEMAS & TELEMÁTICA
19
These models include multi-layer perceptrons (MLP), RBF neural networks, Modular Networks, Recurrent Neural Networks and Phase-Space reconstruction techniques as well as the hybrid neural networks. The existent literature always compares their results with the black-box, conceptual or physically based approaches and ARIMA model[1, 9, 2, 14, 15, 16, 17, 21, 22, 23, 24, 25] . In general, can be affirmed that the frequent use of neural networks in hydrology is because of the advantage they have over other techniques to identify non-linear features. As above mentioned, the neural networks are capable to distinguish the relevant features to those who are not, furthermore are non-parametric techniques, which implies is not necessary to define restrictions or to have previous solutions.[26] 3. RBF ANN FORECASTING MODEL Radial basis function networks have been employed in many different problems. In the literature, the number of applications covered by type of neural network is quite high and can be seen that pattern recognition and time-series analysis are the main fields of interest [18, 19, 20]. The main advantages of this type of networks can be summarized as follows: • The RBF network is capable of approximating nonlinear mappings effectively. • The training time of the RBF network is quite low compared to that of other neural network approaches such as the MLP, because training of the two layers of the network is decoupled.
20
SISTEMAS & TELEMÁTICA
• The RBF networks are successful for identifying regions of sample data not in any known class, because it uses a non-monotonic transfer function based on the Gaussian density function. • RBF network is less sensitive to the order in which data is presented to them, because one basis function takes responsibility for one part of the input space. The above characteristics together with their good capability of generalization, fast convergence, smaller extrapolation errors and higher reliability over difficult data, make this type of neural networks a good choice that fulfils the necessities of dealing with similar problems to the exposed one. 3.1 RBF Topology For our forecasting purposes, a typical RBF model consists of an input layer, one or two hidden layers and an output layer that has only one node. Shown in Figure 3 is a typical simple structure, which is most commonly used in forecasting. In this case, the input layer has several nodes, each representing an input variable. The hidden layer also has several nodes and represents the non-linearity of the network system. The output layer has only one node, which represents the forecast value corresponding to each set of input values. The topology of the RBF network depicted in Figure 1 is characterized by the following aspects: (i) the input layer of the RBF is a receptor for the input data, (ii) the hidden layer performs a non-linear transformation of the input space to the space of the
Vol. 6 No. 12 • Julio - Diciembre de 2008
x1
x2 z
xn-1
Función Lineal Continua
xn Función Gaussiana Figure 3. RBF model architecture
intermediate level. The intermediate level neurons are the function base for input vectors and (iii) the output layer estimates the linear combination of the neurons belonging to the intermediate level. In the hidden layer, the basis is normally functions whose means and standard deviations could be calculate considering the vectors of the input space. Therefore, if X is the input vector, and L stands for the number of neurons in the hidden layer, then h(x)=(h1(x),…,hi(x),..,hL(x))T define the output vector of the nodes belonging to the hidden layer, where, hi(x)�e-Li x-gi
2
(1)
where gi represents each Gaussian function center defined by the input space vectors, and ||x-gi||, the Euclidean distance between an input vector x and the i-esim gi center. The activation state of the k-esim neuron of the output layer, yk, has to be calculated whit Equation (2). L
yk�¤wikhi(x)+bk, k=1,2,.....,M
(2)
i=1
where wik (i=1, 2, ..., L) represents the weights of the connections between
Water flows modelling and forecasting using a RBF neural network
the hidden layer and the k-esim neuron of the output layer and bk stand for the output bias. 3.2 RBF Learning Process The mapping function of a RBF neural network, as depicted in Figure 1, is mostly built up of Gaussians rather than sigmoids as in MLP networks. Learning in RBF network is carried out in two phases: fist for the hidden layer and then form the output layer. The parameters that define this approximation process are (i) the weights between centers and output layers neurons (ii) the centers position and (iii) the Gaussian functions of the centers. The hidden layer is self-organizing where its parameters depend on the distribution of the inputs, not on the mapping from the input to the output. The output layer, on the other hand, uses supervised learning (gradient descent or linear regression) to set its parameters. 4. FLOW RIVER FORECAST The information used for this study is represented by the diary record of
SISTEMAS & TELEMÁTICA
21
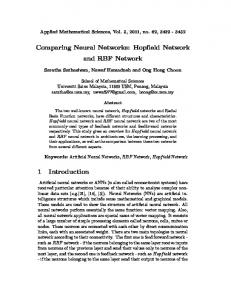
level precipitation of rains, the river flow volume, the temperature and the phreatic level from years 1997 up to and including 2005 obtained at experimental river basin ‘O Abelar’ (see Figure 4 for a detailed description of the land). The river basin this located in Abegondo (Province of A Coruña - Spain). 4.1 Study Area and Data Set In case of the river flow volume and the phreatic level, there was several missed raw data for small periods of time, caused mainly because the instrumental of measurement failed, and therefore, the first problem to solve was to estimate all those missed values. The recovering of the precipitation levels was easily estimated because it was possible to obtain information from near meteorological stations.
Repoblación Eucaliptos Ripisilva Meters
Maiz forrajero
121.48
Figure 4. River basin in Avegondo (Province of A Coruña – Spain)
The first step to check whether the lacking values belonging to every variable were correctly estimated, was to analyze their time series. For this goal, a visual recurrence analysis
22
SISTEMAS & TELEMÁTICA
(VRA) of river flow volume is an adequate tool to obtain reliable results which permit to observe the factors which determine the chaotic behavior on a time series. In VRA, a one-dimensional time series is expanded into a higher-dimensional space, in which the dynamic of the underlying generator takes place. This is done using a technique called ‘delayed coordinate embedding’, which recreates a phase space portrait of the dynamical system under study from a single (scalar) time series. The basic idea to keep in mind when studying a recurrent plot (RP) is simple: if the underlying signal is truly random and has no structure, the distribution of colors over the RP will be uniform, and so there will not be any identifiable patterns. If, on the other hand, there is some determinism in the signal generator, it can be detected by some characteristic, distinct distribution of colors. For example, the length of diagonal line segments of the same color on the RP can give an idea about the variable predictability. Starting from a visual analysis of the recurrence, the time series shows a certain degree of recurrence without presenting any chaotic alterations. A later statistical analysis of the river flow volume showed that, although it clearly presents a big changeability, it demonstrates some seasonal behavior. The variability is due to the difference of levels for one year to another. We stated that although it exists great variability, the time series present a similar trend and a seasonal behavior, allowing us to establish the lacking dates. Having observed the above-mentioned factors, we proceeded to apply the most guessed right model that was
Vol. 6 No. 12 • Julio - Diciembre de 2008
allowing a good approach to the real values in these short periods of time. For both variables, water volume and phreatic level, two methods of approach were used: (i) the mobile simple average when we observe that the most probable behavior was presenting absence of tendency and (ii) the Holt´s model for the cases where the series present some trend. The seasonality was not considered because they were very short periods of time. Once completed the missing values in the time series, we proceeded to apply several statistical forecasting techniques to model the time series behaviour and compare the results obtained with out trained RBF network. 4.2 River and Stream Flow Forecasting The data used for the study was the daily record of the mentioned variables and has a length of 8 years (from November 1, 1997 until December 31, 2005) with 2981 recorded data. Based on other studies, which have used neural networks to do forecasting of river flows, we decided to take approximately 75% (2190 records) of the available data for training the models and 25% (791) remaining to realize the test. The statistical techniques used to forecast stream flow values were: (i) simple moving average, (ii) simple exponential smoothing, (iii) Brown´s linear exponential smoothing, (iv) Holt´s linear exponential smoothing, (v) Brown´s quadratic exponential smoothing, (vi) Winter´s triple exponential smoothing and (vii) the ARIMA model. The first four models
Water flows modelling and forecasting using a RBF neural network
were used because it was stated that the series was presenting some trend and seasonal behaviour. In order to process the data and test the selected techniques, we use the statistical program Statgraphics version 4.0. The data was processed several times with each model under different parameters in order to find the better configuration. For some models, we use the optimize option available in the Statgraphics suite. The best results were selected based on four efficiency indexes: MSE, MAE, ME and RMSE. The reason for which we opted for these indexes was because we considered they represent, in a better way, the necessary aspects to select the best models. In this context, MSE and RMSE give an important weight to large errors, so we can observe what models have a substantial variation. With a different point of view, MAE indicates the difference (in absolute terms) between the real value and the forecasted one. if MAE is high, it possibly indicates there are too many distant forecasts. Finally ME index, which indicates whether the model usually generates predictions for below or over the real value, can give us information about the accuracy of the models. Table 1 shows that the most accurate statistical models were the ARIMA model, the simple exponential smoothing and the Holt´s linear exponential smoothing because they present the best indexes. As we can see from Table 1, the ARIMA model achieves the best MAE index, following by the simple and the Holt´s exponential smoothing. Taking into consideration the MSE values, the
SISTEMAS & TELEMÁTICA
23
Table 1. Forecasting streams flow with statistical techniques. MODEL
MSE
MAE
ME
RMSE
Simple moving average
3,762810
0,679756
0,002215
1,939800
Simple exponential smoothing
2,768120
0,499754
0,001634
1,663770
Brown’s linear exp. Smoothing
3,353780
0,541343
0,000986
1,831330
Holt’s linear exp. Smoothing
2,775680
0,509831
-0,02927
1,666040
Brown’s quadratic exp. smoothing
4,626800
0,622058
0,000802
2,151000
13,4406
1,09275
0,059589
3,666140
2,922110
0,477654
-0,00059
1,709420
Winter’s exp. Smoothing ARIMA
best index was obtained by simple exponential smoothing, following by Holt´s and finally the ARIMA model. This behaviour indicates that ARIMA model presents a high degree of accuracy for those values near the real. However, when the model predicts distant values, simple and Holt’s techniques achieve better results. After we obtained the results reflected at Table 1, we proceeded to carry out several simulations with our RBF neural network to establish a predictive model and comparing the best results with the results obtained with the statistical techniques. For the data set considered for this study, the input and the target variables were first normalized linearly in the range.[-1, 1]. To establish input and output layers, we defined 12 possible cases as forecasting models. Each case defines the number of neurons that determined the input layer and consists of N neurons representing the daily river flow at times t, t-1,…,t-N, where N= 6, 7, 8, 9 days, and M neurons representing rainfall level at time t+1 and t where M= 0, 1, 2. The output layer always represents the river flow forecast at
24
SISTEMAS & TELEMÁTICA
time t+1. The possible models were (i) river flow defined only by the 6, 7, 8 and 9 previous days, (ii) river flow defined by the records of the 6, 7, 8 and 9 previous days plus the rainfall level of the target day and (iii) river flow defined by the records of the 6, 7, 8 and 9 previous days plus the rainfall level of the target day and the previous one. For each model, we performed four simulations with 25, 50, 75 and 100 centres and 500 iterations. For each simulation MAE index was calculated and the two best models were chosen. The results obtained showed that the best models were those working with 6 and 8 days before the target day. The following step in the experimentation was to perform another five simulations in each case (6 and 8 days previous). Each simulation worked with 75, 80, 85, 90, 95 and 100 centres with 2000 iterations, and after observe the results, we easily go over the conclusion: the best model was the RBF network with 6 neurons in its input layer. Figure 5 shows the comparison between these two models. As is depicted in Figure 6, MAE index for the case of six previ-
Vol. 6 No. 12 • Julio - Diciembre de 2008
Figure 5. Different configurations of the RBF network varying the input layer (6 and 8 neurons)
MAE comparison for 6 previuos days 0,80000 0,70000 0,60000
MAE
0,68489
0,69192 0,65024 0,55332 0,52815
0,50000
0,55957 0,50629
0,42556
0,46492 0,41621
0,40000 0,30000 0,20000 0,10000 0,00000 100-2000 95-2000 90-2000
85-2000
80-2000
75-2000 100-500
75-500
50-500
25-500
Center and Iterartions
Figure 6. Different configurations of the RBF network varying the number of centres and iterations
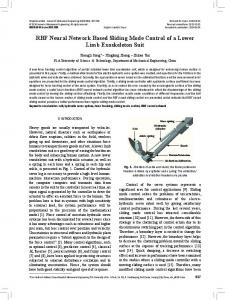
ous days (discontinuous line) usually presents a better behaviour than the other configuration. The next experiment was to compare the best RBF network configuration against the results obtains with the classical methods. In order to do this, we first analyzed the behaviour of our network varying the number of centres and iterations. Figure 6 shows all the indexes obtained at the simulations demonstrating that
Water flows modelling and forecasting using a RBF neural network
the best configuration corresponds to the simulation with 100 centres and 500 iterations. For this configuration, Table 2 shows the better efficiency indexes for RBF neural network. Table 2. Forecasting streams flow with the RBF neural network. MODEL
MSE
MAE
ME
RMSE
RBF Neural 0,832893 0,415789 -0,092801 0,912630 Network
SISTEMAS & TELEMÁTICA
25
When we compare the results showed in Table 2 with those obtained applying the statistical techniques, we can see as the neuronal network presents better accuracy in its forecast. Figure 8 shows the absolute error obtained whit the RBF ANN, where the continuous line represents the real data and the bars represent the absolute error value. At this point, we consider relevant to mention that we observed some special characteristic in the times series. As we can see in Figure 7, the time series present high variability at the first 6 years and after that it shows stability. This stability is possibly explained because there was a great diminution of rains by a long period of time, the climate was very dry and that conditions contribute to generating some stationary data. This situation generates certain disadvantages with the analyses and forecast based on RBF networks, because if the selected training data presents high variability and the selected test
data have stationary, the statistical techniques can get to be better and therefore more accurate. For a better and complete analysis, especially because the situation afore mentioned, we decided to apply a Kruskall-Wallis test to compare the forecast obtained with the different methods. As it is known, this is a non parametric test to determine if exist some statistically significant difference amongst the medians of the results obtained from experiments. The method tests the assumption that the medians of the samples are equal, and at the 95% confidence interval, we obtain a P-Value = 0,00482519. Since the P-value is less than 0,05, we can assume that there is a statistically significant difference amongst the medians. To better confirmation, we apply the U Mann-Withney test to evaluate and establish which models are significantly different from the others and the results are show at Table 3.
Figure 7. Absolute error obtained with the RBF neural network
26
SISTEMAS & TELEMÁTICA
Vol. 6 No. 12 • Julio - Diciembre de 2008
Table 3. Statistical analysis of the models’ behaviour.
Moving
*
Simple
Brown’s
Holt’s li- Brown’s qua- Winter’s
exp. linear exp. near exp. Average Smooth. smooth. smooth.
dratic exp. smooth.
RBF
exp. ARIMA Neural smooth. Network
Moving Average Simple exp. smooth.
=
Brown’s linear exp. smooth.
=
=
Holt’s linear exp. smooth.
=
=
=
Brown’s quadratic exp. smooth.
=
=
=
=
Winter’s exp. smooth.
*
*
*
*
*
ARIMA
=
=
=
=
=
=
RBF neural network
=
=
*
*
*
*
As depicted in Table 3, the results indicate that it exists a statistical difference between the RBF neural network and the others methods except in two cases, with the moving average and the simple exponential smoothing. This situation is possibly explained by the previously mentioned phenomenon, especially when these two methods are very efficient in stationary situations. Nevertheless, the accuracy of the RBF network is better if we compare the results of Tables 1 and 2. 5. CONCLUSIONS AND FUTURE WORK The most important conclusion is the better accuracy that has RBF neural network to predict variable situations comparing with other existing forecasting methods. The neural
Water flows modelling and forecasting using a RBF neural network
*
network approximation is better because the ANN does not suffer from the dependency level that has other models from the historical behaviour. In this sense, the learning capacity of the RBF neural network is the characteristic that permits to obtain a more accurate result. In this context, in which environmental phenomenon’s usually present a higher degree of variability, an accurate forecasting system can help to make good decisions in many aspects like (i) the estimation of the future behaviour of scarce resources, (ii) determining which are the possible causes of that behaviour, (iii) the development of economic plans according the resources that have a specific community or (iv) the economic impact due to changes in the environment, between others. The
SISTEMAS & TELEMÁTICA
27
ANN helps too much to build a good decision support system that helps to obtain and solve the problems afore mentioned. Another relevant question is that if a neural network learns from data with different characteristic at the training and testing phases, the most possible situation is that the ANN lost accuracy especially when its results are compare whit other statistical models. That situation is very normal to occur, especially with small volumes of water as in our river basin. A relevant aspect for us in order to continue our work is how the proposed ANN could help in the definition of a decision support system. In this sense, we believe in the possibility of integrating the RBF neural network with other forecasting methods in order to implement an ensemble forecasting model. The whole model will obtain more accurate results which help to make better decisions by means of reducing the uncertainty and explaining the behaviour of noncontrollable variables. According with the situation aforementioned, the main idea with the proposed ensemble forecasting approach is to select, for each situation, the best model depending on the behaviour of the time series. In this sense, there are several aspects to take into consideration as the utilization of a proportional weighting voting schema or the identification of the best past cases to use for the forecasting. Based on our previous experience in the development of hybrid systems, it could be possible to employ a CBR (Case-Based Reasoning) system as a wrapper methodology for the integration of the selected techniques.
28
SISTEMAS & TELEMÁTICA
REFERENCES [1] B. Sivakumar, A. W. Jayawardena, and T. K. M. G. Fernando. ‘River flow Forecasting: use of phase-space reconstruction and artificial neural networks approaches’, Journal of Hydrology 265, 225-245, (2002). [2] W. Collischon, R. Hass, I. Andreolli and C. E. Morelli. ‘Forecasting river Uruguay Flow using rainfall forecast from a regional weather-prediction model’, Journal of Hydrology 305, 87-98, (2005) [3] J. D. Cryer. ‘Time series analysis’, Duxbury Press, Massachusetts, 1986. [4] J. D. Hamilton. ‘Time series analysis’, Princeton University Press, Princeton, 1994. [5] S. Makridakis and S. C. Wheelwright, V. E. Mcgee. ‘Forecasting: methods and applications’, John Wiley & sons, New York, 2nd. edn, 1983. [6] S. Makridakis and S. C. Wheelwright. ‘Forecasting’, NorthHolland, Amsterdam, 1979. [7] S. A. DeLurgio. ‘Forecasting principles and applications’, McGrawHill, Boston, 1st. edn, 1979. [8] A. Weigend and N. Gershenfeld. ‘Time Series Prediction: Forecasting The future and Understanding the Past’, Perseus Books, Santa Fe, 1995. [9] G.B. Kingston, H. R. Maier, and M. F. Lambert. ‘Calibration and validation of neural networks to ensure physically plausible hydrological modeling’, Journal of Hydrology 314, 158-176, (2005)
Vol. 6 No. 12 • Julio - Diciembre de 2008
[10] J. M. Corchado, B. Lees, and J. Aiken. ‘Hybrid Instance-based System for Predicting Ocean Temperatures’, International Journal of Computational Intelligence and Applications 1(1), 35–52, (2001). [11] A. F. Atiya, S. M. El-Shoura, S. I. Shaheen and M. S. El-Sherif. ‘A comparison between Neural-network forecasting techniques-case stuffy: River Flow Forecasting’, IEEE Transactions on neural networks 10:(2), 402-409, (1999) [12] Gwo-Fong Lin and Guo-Rong Chen. ‘And inproved neural network approach to the determination of aquifer parameters’, Journal of Hydrology 316, 281286, (2006). [13] D. R. Maidment. ‘Handbook of Hydrology’, McGraw-Hill, New York, 1993. [14] P. C. Nayk, K. P. Sudheer, D. M. Rangan and K. S. Ramasastri. ‘A neuro-fuzzy computing technique for modeling hydrological time series’, Journal of Hydrology 291, 52-66, (2004) [15] D. Nagesh Kumar, K. Srinivasa Raju and T. Sathish. River Flow Forecast using Neural Networks’, WaterRresources Management 18, 143-161, (2004). [16] H. Kerem Cigizoglu and O. Kisi. ‘Flow prediction by three back propagation techniques using k-fold partitioning of neural network training data’, Nordic Hydrology 36(1), 49-64, (2005). [17] Y. B. Dibike and D. P. Solomatine. ‘River Flow Forecasting Using Artificial Neural Networks’, Phys. Chem. Earth (b) 26(1), 1-7, (1999).
Water flows modelling and forecasting using a RBF neural network
[18] C. Shin. ‘Radial Basis Function Network Design for Chaotic Time Series Prediction’, Transactions of the Korean Institute of Electrical Engineers 45(4), 602–611, (1996). [19] X. He., and A. Lapedes. ‘Nonlinear Modeling and Prediction by Successive Approximation Using Radial Basis Functions’, Technical Report LA-UR-911375. Los Alamos National Laboratory, Los Alamos, NM, (1991). [20] V. Kadirkamanathan., M. Nirajan, and F. Fallside. ‘Sequential Adaptization of Radial Basis Function Neural Networks’, Advances in Neural Information Processing Systems 3, 721-727, (1991). [21] Wang, W., Van Gelder P. H. A. J. M., Vrijling, J. K., Ma, J. Forecasting daily streamflow using hybrid ANN models. Journal of Hydrology , 324:383-399, (2006). [22] Jain, A. y Kumar A. M. Hybrid neural network models for hydrologic time series forecasting. Applied Soft Computing, 7:585-592, (2007). [23] Corzo, G. y Solomatine, D. Knowledge-based modularization and global optimization of artificial neural network models in hydrological forecasting. Neural networks, 20:528-536, (2007). [24] Coulibaly, P. y Baldwin, C. K. Nonstationary hydrological time series forecasting using nonlinear dynamic methods. Journal of Hydrology 307:164174, (2005).
SISTEMAS & TELEMÁTICA
29
[25] Kumar D. N., Raju, S. K., Sathish, T. River Flow Forecasting using recurrent neural networks. Water resource management, 18: 143-161, (2004). [26] Ponce, V.M. Engineering hydrology. Principles and practices. Englewood Cliffs, New Jersey: Ed. Prentice Hall. (1989). [27] Beck, M.B. Forecasting environmental change. Journal of Forecasting, 10(1-2):3-19, (1991). [28] Sempere, D. Los modelos distribuidos en la modelización hidrológica de crecidas. Métodos para el cálculo hidrológico de crecidas. Centro de Estudios Hidrográficos del CEDEX, MOPTMA, Madrid. (1996). [29] Francés, F. Modelación distribuida frente a modelación agregada. Métodos para el cálculo hidrológico de crecidas. Centro de Estudios Hidrográficos del CEDEX, MOPTMA, Madrid. (1996). [30] Wheater, H.S., Jakeman A.J.y Beven K.J. Progress and directions in rainfall-runoff modelling. Modelling change in environmental systems, (pp. 101-132). New York: Editorial Wiley. (1993). [31] Kokkonen, T.S. y Jakeman A.J.. A comparison of metric and conceptual approaches in rainfallrunoff modeling and its applications. Water Resources Research, 37(9):2345-2352. (2001) CURRÍCULOS Carlos H. Fajardo Toro Ph.D. from the University of Vigo, Spain. He was born in Cali, Colombia, in 1968. He works as an Associate
30
SISTEMAS & TELEMÁTICA
and Full time Professor at the Icesi University in Cali – Colombia from 1994 to 2001 and from 2001 as an Associate Professor for the Computer Science Department of the University of Vigo, collaborating as investigator with the research group SING (Computer Systems of New Generation) belonging to the University of Vigo and group IREHISA belonging the Universidad del Valle in Colombia. Talking about his investigation field, he is cantered in the study of hybrid methods of Artificial Intelligence and their application to real problems, although he has also worked in topics related with software quality and project management focused on software development. (http://sing.ei.uvigo.es/). Daniel González-Peña Ph.D. student in the Computer Science Department at the University of Vigo, Spain. His research work is focused in the study of hybrid methods of Artificial Intelligence such as CBR (Case Based Reasoning), and its application to real problems like spam filtering and bioinformatics. During the last years, he has been working as Web developer in some other projects and as Java developer in some Open Source projects such as GeneCBR (www.genecbr.org), AIBench, (www.aibench.org), and JavaTraceIt! (javatraceit. siteinteresa.org). He collaborates with the research group SING at the Computer Engineering School at University of Vigo. He is joint author of several books and book’s chapters about Web, Java and Java Enterprise development.
Vol. 6 No. 12 • Julio - Diciembre de 2008
Benedicto Soto González Ph.D. from the University of Santiago de Compostela, Spain. He was born in Pontevedra, Spain in 1963. He works as a Titular Professor for the Biology and soil sciences Department of the University of Vigo, collaborating as investigator with the Group of pedology and agricultural chemistry belonging to the University of Vigo. Talking about his investigation field, he is cantered in the study of soils and land management, although he has also worked in topics related with hydrology analysis. He is joint author of several books and book’s chapters, as well as author of different articles published by well-known editorials like Springer-Verlag, Ios Press, Kluwer, etc. (http://webs.uvigo.es/webc02/). Florentino Fernández-Riverola Ph.D. from the University of Vigo, Spain. He was born in Langen-
Water flows modelling and forecasting using a RBF neural network
Hessen, Germany, in 1973. He works as an Associate Professor for the Computer Science Department of the University of Vigo, collaborating as investigator with the Group of Intelligent Computer Systems of the University of Salamanca and the research group SING (Computer Systems of New Generation) belonging to the University of Vigo. Talking about his investigation field, he is cantered in the study of hybrid methods of Artificial Intelligence and their application to real problems, although he has also worked in topics related with the development of communication protocols for wireless networks. He is joint author of several books and book’s chapters, as well as author of different articles published by well-known editorials like Springer-Verlag, Ios Press, Kluwer, etc. (http://sing.ei.uvigo.es/).
SISTEMAS & TELEMÁTICA
31