REVIEW ARTICLES
Water resources and climate change: An Indian perspective R. K. Mall1,3,*, Akhilesh Gupta2, Ranjeet Singh2, R. S. Singh3 and L. S. Rathore2 1
Central Ground Water Board, K. G. Marg, New Delhi 110 001, India National Centre for Medium Range Weather Forecasting, Noida 201 301, India 3 Department of Geophysics, Banaras Hindu University, Varanasi 221 005, India 2
In recent times, several studies around the globe show that climatic change is likely to impact significantly upon freshwater resources availability. In India, demand for water has already increased manifold over the years due to urbanization, agriculture expansion, increasing population, rapid industrialization and economic development. At present, changes in cropping pattern and land-use pattern, over-exploitation of water storage and changes in irrigation and drainage are modifying the hydrological cycle in many climate regions and river basins of India. An assessment of the availability of water resources in the context of future national requirements and expected impacts of climate change and its variability is critical for relevant national and regional long-term development strategies and sustainable development. This article examines the potential for sustainable development of surface water and groundwater resources within the constraints imposed by climate change and future research needs in India. Keywords: Climate change, groundwater recharge, hydrology, run-off, water resource. THERE have been observed changes in surface temperature, rainfall, evaporation and extreme events since the beginning of the 20th century. The atmospheric concentration of carbon dioxide has increased from about 280 parts per million by volume (ppmv) to about 369 ppmv and the global temperature of the earth has increased by about 0.6°C. The global mean sea level has risen by 10 to 20 cm. There has been a 40% decline in Arctic Sea ice thickness in late summer to early autumn in the past 45– 50 years1–5. The frequency of severe floods in large river basins has increased during the 20th century6. Also, synthesis of river-monitoring data reveals7 that the average annual discharge of freshwater from six of the largest Eurasian rivers to the Arctic Ocean has increased by 7% from 1936 to 1999. In India, studies by several authors show that there is increasing trend in surface temperature8–12, no significant trend in rainfall13–15 on all-India basis, but decreasing/increasing trends in rainfall12,16,17 at some locations. *For correspondence. (e-mail:
[email protected]) 1610
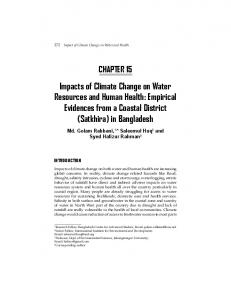
The average global surface temperature is projected to increase by 1.4–3°C from 1990 to 2100 for low-emission scenarios and 2.5–5.8°C for higher emission scenarios of greenhouse gases (under the new SRES ‘Marker’ scenarios) in the atmosphere. Over the same period, associated rise in global mean sea level is projected between 9 and 88 cm2. How climate change can influence moisture content of the atmosphere, and its sources and sinks is shown in Figure 1. A warmer climate will accelerate the hydrologic cycle, altering rainfall, magnitude and timing of run-off. Warm air holds more moisture and increase evaporation of surface moisture. With more moisture in the atmosphere, rainfall and snowfall events tend to be more intense, increasing the potential for floods. However, if there is little or no moisture in the soil to evaporate, the incident solar radiation goes into raising the temperature, which could contribute to longer and more severe droughts18. Therefore, change in climate will affect the soil moisture, groundwater recharge and frequency of flood or drought episodes and finally groundwater level in different areas. A number of studies have been reported in the literature to assess the impact of climate-change scenarios on hydrology of various basins and regions19–27. In a number of studies, it is projected that increasing temperature and decline in rainfall may reduce net recharge and affect groundwater levels28–34. However, little work has been done on hydrological impacts of possible climate change for Indian regions/basins. Groundwater has been the mainstay for meeting the domestic needs of more than 80% of rural and 50% of urban population, besides fulfilling the irrigation needs of around 50% of irrigated agriculture. It has been estimated that 70–80% of the value of irrigated production in India comes from groundwater irrigation. Around two-fifths of India’s agricultural output is contributed from areas irrigated by groundwater. Contribution from groundwater to India’s Gross Domestic Product (GDP) has been estimated35 as about 9%. Water resources will come under increasing pressure in the Indian subcontinent due to the changing climate. Presently, more than 45% of the average annual rainfall, including snowfall in the country, is wasted by natural runoff to the sea. Rainwater-harvesting schemes are now being implemented in the country to minimize this run-off loss based on present rainfall scenarios over the country, CURRENT SCIENCE, VOL. 90, NO. 12, 25 JUNE 2006
REVIEW ARTICLES Increased Greenhouse Gases Increased Radiative Forcing (Global Warming)
Surface Heating Surface Latent Heating Depends on available moisture
Increase in Temperature
Increase in Evaporation Increase in Actual Moisture Content
Increase in Atmospheric Water-holding Capacity
Specific Humidity/Not RH
Saturation Specific Humidity
Clouds Thunderstorms Cold Fronts Warm Fronts Tropical Cyclones Hurricanes Extra tropical Cyclones Snowstorms
Enhanced Precipitation Rates Enhanced Latent Heating Enhanced storm Intensity
• •
Increased Runoff Increased Flooding
All Precipitating Systems Feed on Available Moisture
Precipitation amounts? • Duration and size of systems • Competition among systems • Vertical heat transport stabilizes systems
Figure 1. Conceptual model of the effect of greenhouse gases and global warming on the hydrologic cycle and phenomena associated with many climate extremes (source: Trenberth18).
to increase groundwater levels35. However, for the success of these schemes it is necessary that we focus on how the possible climate change will affect the intensity, spatial and temporal variability of the rainfall, evaporation rates and temperature in different agro-climatic regions and river basins of India. Studying the potential socio-economic impacts of climate change involves comparing two future scenarios, one with and the other without climate change. Uncertainties involved in such an assessment include: (1) the timing, magnitude and nature of climate change; (2) the ability of ecosystems to adopt either naturally or through managed intervention to the change; (3) future increase in population and economic activities and their impacts on natural CURRENT SCIENCE, VOL. 90, NO. 12, 25 JUNE 2006
resources systems; and (4) how society adapts through the normal responses of individuals, businesses and policy changes. The uncertainties, long periods involved and the potential for catastrophic and irreversible impacts on natural resources systems raise questions as to how to evaluate climate impacts and other policies that would affect or be affected by changes in the climate. In view of the above, an attempt has been made here to give a brief resume of the possible impacts of climate change on India’s surface water and groundwater resources. Change in Indian population, India’s water needs, climate of India, river basins of the country, present water resources and future demand and supply, impacts of projected climate change and variability, and associated hydrological 1611
REVIEW ARTICLES
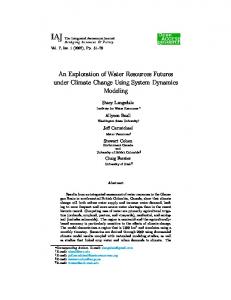
Figure 2.
Normal annual rainfall (cm). Source: IMD.
events and vulnerability of regional water resources to climate change, and identifying research needs, key risks and prioritizing adaptation responses are discussed.
Rainfall, population, food and freshwater needs of India Long-period average annual rainfall over India is about 117 cm; however, this rainfall is highly variable both in time and space. Almost 75% (88 cm ± 10 SD) of the longterm average annual rainfall comes down in four months, June–September (southwest monsoon season). The heaviest rains of the order of 200–400 cm or even more occur over northeast India and along the Western Ghats situated along the west coast of the peninsular India (Figure 2). Largely, the annual average rainfall over the northern Indo-Gangetic plains running parallel to the foothills of the Himalayas varies from about 150 cm in the east to 1612
50 cm in the west. Over central parts of India and northern half of peninsular India, it varies from 150 cm in the eastern half to about 50 cm on the lee side of the Western Ghats. In the southern half of the Indian peninsula, average annual rainfall varies from 100 to 75 cm from east to west. On the other hand, some regions in the extreme western part of the country, such as western Rajasthan, receive average annual rainfall of the order of about 15 cm or even less. There are considerable intra-seasonal and interseasonal variations as well. The year-to-year variability in monsoon rainfall (Figure 3) leads to extreme hydrological events (large-scale droughts and floods) resulting in serious reduction in agricultural output and affecting the vast population and national economy. A normal monsoon with an evenly distributed rainfall throughout the country is a bonanza, while an extreme event of flood or drought over the entire country or a smaller region constitutes a natural hazard. Hence, CURRENT SCIENCE, VOL. 90, NO. 12, 25 JUNE 2006
REVIEW ARTICLES
Figure 3.
All-India summer monsoon rainfall anomalies (1871–2004). Dark line shows 10-year moving average.
variation in seasonal monsoon rainfall may be considered a measure to examine climate variability/change over the Indian monsoon domain in the context of global warming. A major part of India’s population of 1027 million with decadal growth of 21.34% from 1991 to 2001 is rural and agriculturally oriented, for whom the rivers and groundwater are the source of prosperity. The United Nations has estimated that the world population grew at an annual rate of 1.4% during 1990–2000. China registered a much lower annual rate of growth (1.0%) along with USA (0.9%) during 1990–2000, compared to India (1.9% during 1991–2001). It is estimated that if the National Population Policy (NPP) is fully implemented, the population of India36 should be 1107 million by 2010. In India, average food consumption at present is 550 g per capita per day, whereas the corresponding figures in China and USA are 980 and 2850 g respectively. Present annual requirement based on present consumption level (550 g) for the country is about 210 million tonnes (mt), which is almost equal to the current production. While the area under foodgrain, fell from 126.67 million hectare (mha) to 123.06 mha during the period 1980–81 to 1999– 2000, production registered an increase from 129.59 to 209 mt during that period. Food grain production was impressive in 1999–2000, which is more than four times the production of 50.82 mt in 1950–51. However, the country faces major challenges to increase its food production to the tune of 300 mt by 2020 in order to feed its ever-growing population, which is likely to reach 1.30 billion by the year 2020. To meet the demand for food from this increased population37, the country’s farmers need to produce 50% more grain by 2020. It is feared that the fast increasing demand for food in the next two or CURRENT SCIENCE, VOL. 90, NO. 12, 25 JUNE 2006
three decades could be quite grim particularly in view of the serious problem of soil degradation and climate change. The total gross irrigated area has nearly trebled from 22.6 mha in 1950–51 to 99.1 mha in 1998–99. Out of this, 34.3 mha is from major and medium projects, 12.7 mha from minor schemes using surface water and 52.2 mha from groundwater. As against the national average of 38% of the total cropped area being irrigated, Punjab has the distinction of achieving the highest level of irrigation (92%), followed by Haryana (79%) and Uttar Pradesh (66%)38. In a study, Umapathi and Ramashesha39 found that area under water-intensive crops like paddy and sugar cane has increased by 8.0 and 0.7 lakh ha respectively, over a period of 11 years in Tamil Nadu. They recommended that area under water-intensive crops should not exceed the area under non-water intensive crops. Figure 4 shows40,41 the observed and projected decline in per capita average annual freshwater availability and growth of population from 1951 to 2050. This clearly indicates the ‘two-sided’ effect on water resources – the rise in population will increase the demand for water leading to faster withdrawal of water and this in turn would reduce the recharging time of the water-tables. As a result, availability of water is bound to reach critical levels sooner or later.
Water resources Surface water resources Table 1 shows the water resources of the country. India is gifted with many rivers. As many as 12 of them are classi1613
REVIEW ARTICLES fied as major rivers, whose total catchment area is 252.8 mha and average annual potential in rivers is 1570.98 b.cu.m. (85% of the total natural run-off; Table 2). Another 48 rivers are classified as medium rivers38, whose total catchment area is 24.9 mha. The total annual discharge in the rivers that flow in various parts of the country, amounts to 1869 km3. Many of these rivers are perennial, though few are seasonal. This is because precipitation over a large part of India is strongly concentrated in the summer monsoon season during June to September/October and the tropical storm season from May to October42. Rivers do not, however, remain at a high stage throughout the monsoon season. It is only a spell of heavy rains, which may last for a period of several hours to few days, that generates large run-off in the catchments43,44. Average water yield per unit area of the Himalayan rivers is almost double that of the south peninsular river systems, which indicates the importance of snow and glacier melt contribution from high mountains. Average intensity of mountain glaciation varies from 3.4% for Indus to 3.2% for Ganges and 1.3% for Brahmaputra. The tributaries of these river systems show maximum intensity of
Figure 4. Observed and projected decline in per capita average annual freshwater availability and growth of population from 1951 to 2050.
Table 1.
Water resources of India
Annual precipitation Available water resources Utilizable Surface water (storage and diversion) Groundwater (replenishable) Present utilization (Surface water 63%, groundwater 37%) Irrigation Domestic Industry, energy and other uses 1614
4000 b.cu.m. 1869 1122 690 432 605 501 30 74
glaciation (2.5 to 10.8%) for Indus followed by Ganges (0.4 to 10%) and Brahmaputra (0.4 to 4%). It demonstrates that the rainfall contributions are greater in the eastern region, while the snow and glacier melt contributions are more important in the western and central Himalayan region. Apart from monsoon rains, contributions from snow and glacial melt are playing a significant role in water resources development of the country. In recent decades, the hydrological characteristics of the watersheds in the Himalayan region seem to have undergone substantial changes as a result of extensive land use (e.g. deforestation, agricultural practices and urbanization), leading to frequent hydrological disasters, enhanced variability in rainfall and run-off, extensive reservoir sedimentation and pollution of lakes45. Global warming and its impact on the hydrological cycle and nature of hydrological events have posed an additional threat to this mountainous region of the Indian subcontinent. Extreme precipitation events have geomorphologic significance in the Himalayas, where they may cause widespread landslides46. The response of hydrological systems, erosion processes and sedimentation in this region could alter significantly due to climate change. It is estimated that the Himalayan mountains cover a surface area of permanent snow and ice in the region which is about 97,020 km2 with 12,930 km2 volume. In these mountains, 10 to 20% of the total surface area is covered by glaciers, while an area ranging from 30 to 40% has seasonal snow cover47,48. These glaciers provide snow and the glacial melt waters keep the Himalayan rivers perennial. Bahadur48 reported that a conservative estimate gives at least 500 km3/yr as snow and ice melt water contributions to Himalayan streams, while Afford49 reports about 515 km3/yr from the upper Himalayan mountains. The most useful facet of glacial run-off is the fact that glaciers release more water in a drought year and less water in a flood year and thus ensure water supply even during the lean years. The snow line and glacier boundaries are sensitive to changes in climatic conditions. Almost 67% of the glaciers in the Himalayan mountain ranges have retreated in the past decade50,51. Available records suggest that the Gangotri glacier is retreating about 28 m per year. A warming is likely to increase the melting more rapidly than the accumulation. Glacial melt is expected to increase under changed climate conditions, which would lead to increased summer flows in some river systems for a few decades, followed by a reduction in flow as the glaciers disappear52. Figure 5 shows the area affected by floods in the country38 from 1953 to 2000. On an average, the area actually affected by floods every year in India is of the order of less than 10 mha, of which about half is cropland. Rashtriya Barh Ayog (RBA) constituted by the Government of India in 1976, carried out extensive analysis to estimate the flood-affected area in the country38. It has assessed the area liable to floods as 40 mha, which is nearly one-eighth the country’s area. CURRENT SCIENCE, VOL. 90, NO. 12, 25 JUNE 2006
REVIEW ARTICLES Table 2.
Major river basins of the country Catchment area (km2)
Average annual potential in river (b.cu.m./yr)
River
Origin
Indus Ganga Brahmaputra Barak and other rivers flowing into Meghna like Gomti, Muhari, Fenny, etc. Sabarmati Mahi Narmada Tapi Brahmani Mahanadi Godavari Krishna Pennar Cauvery
Mansarovar (Tibet) Gangotri (Uttar Kashi) Kailash Range (Tibet)
321289 + 861452 + 194413 + 41723 +
73.31 525.02 585.60
Aravalli Hills (Rajasthan) Dhar (Madhya Pradesh; MP) Amarkantak (MP) Betul (MP) Ranchi (Bihar) Nazri Town (MP) Nasik (Maharashtra) Mahabaleshwar (Maharashtra) Kolar (Karnataka) Coorg (Karnataka)
21674 34842 98796 65145 39033 141589 312812 258948 55213 81155
3.81 11.02 45.64 14.88 28.48 66.88 110.54 78.12 6.32 21.36
2528084 248505 2776589
1570.98 298.02 1869.00
Total Other river basins of the country Total Source: CWC38.
Table 3.
Drought years with percentage area of the country affected by drought Area affected by drought (as percentage area)
Year
Moderate drought
Severe drought
Total
1877 1891 1899 1901 1904 1905 1907 1911 1913 1915 1918 1920 1925 1939 1941 1951 1965 1966 1968 1972 1974 1979 1982 1985 1987
30.6 22.4 44.1 19.3 17.5 25.2 27.9 13.0 24.5 18.8 44.3 35.7 21.1 17.8 35.5 35.1 38.3 35.4 21.9 36.6 27.1 33.0 29.1 25.6 29.8
28.9 0.3 24.3 10.7 16.9 12.0 1.2 15.4 0.0 3.4 25.7 2.3 0.0 10.7 0.0 0.0 0.0 0.0 0.0 3.8 6.9 1.8 0.0 16.7 17.9
59.5 22.7 68.4 30.0 34.4 37.2 29.1 28.4 24.5 22.2 70.0 38.0 21.1 28.5 35.5 35.1 38.3 35.4 21.9 40.4 34.0 34.8 29.1 42.3 47.7
Source: Sinha Ray and She Wale54.
As many as 99 districts, spread over 14 states, were identified by the Central Water Commission (CWC) as drought-prone in the country38. Most of the drought-prone CURRENT SCIENCE, VOL. 90, NO. 12, 25 JUNE 2006
Figure 5. average.
Flood-affected areas (mha); line shows 10-year moving
areas so identified are concentrated in the states of Rajasthan, Karnataka, Andhra Pradesh, Maharashtra and Gujarat38. Human factors that influence drought include incurred demand of water through population growth and agricultural practices; modification of land use that directly influences storage conditions; and hydrological response of catchments and their vulnerability to drought. As pressures on water resources grow, so does vulnerability to meteorological/hydrological/agricultural drought53. Sinha Ray and She Wale54 used rainfall data from 1875 to 1998 and provided the percentage area of the country affected by moderate and severe drought (Table 3). It may be noted that during the complete 124-year period, there were three occasions, i.e. 1877, 1899 and 1918, when percentage of the country affected by drought was more than 60. 1615
REVIEW ARTICLES Table 4. Subdivision Andaman and Nicobar Islands Arunachal Pradesh Assam and Meghalaya Nagaland, Manipur, Mizoram and Tripura Sub-Himalayan West Bengal Gangetic West Bengal Orissa Bihar Plateau Bihar Plains East Uttar Pradesh Plains of west Uttar Pradesh Hills of west Uttar Pradesh Haryana, Delhi and Chandigarh Punjab Himachal Pradesh Jammu and Kashmir West Rajasthan East Rajasthan West Madhya Pradesh East Madhya Pradesh Gujarat region Saurashtra and Kutch Konkan and Goa Madhya Maharashtra Marathwada Vidarbha Costal Andhra Pradesh Telangana Rayalaseema Tamil Nadu and Pondicherry Costal Karnataka North interior Karnataka South interior Karnataka Kerala Lakshadweep
Probability of occurrence of drought (%)
Probability of occurrence
Probability of occurrence of two consecutive droughts
Probability of occurrence of more than two consecutive droughts
13 8 2 10 6 2 4 4 9 10 8 14 17 16 16 21 25 16 10 6 21 23 7 7 15 12 10 13 18 8 3 6 6 7 10
2 0 0 3 1 0 0 0 0 1 0 1 3 4 3 6 6 2 1 1 2 3 0 1 1 1 1 2 1 0 0 1 0 2 2
0 0 0 0 0 0 0 0 0 0 0 0 0 0 2 2 0 0 0 0 1 1 0 0 0 0 0 0 0 0 0 0 0 0 0
Source: Sinha Ray and She Wale54.
It may be noted that during the last 50 years, there was no occasion55 when the percentage area of the country affected by drought was more than 50. In 124 years, probability of occurrence of drought was found maximum in west Rajasthan (25%), Saurashtra and Kutch (23%), followed by Jammu and Kashmir (21%), and Gujarat (21%), as shown in Table 4.
Groundwater resources India is a vast country having diversified geological, climatological and topographic set-up, giving rise to divergent groundwater situation in different parts of the country. The prevalent rock formations, ranging in age from Archaean to Recent, which control occurrence and movement of groundwater, are widely varied in composition and structure. Similarly, not too insignificant are the variations of landforms from the rugged mountainous terrains of the Himalayas, Eastern and Western Ghats to the flat alluvial 1616
plains of the river valleys and coastal tracts, and the aeolian deserts of Rajasthan. The rainfall patterns too show similar region-wise variations. The topography and rainfall virtually control run-off and groundwater recharge56. The groundwater resources have two components, viz. static and dynamic. The static fresh groundwater reserves (aquifer zones below the zone of groundwater table fluctuation) of the country have been estimated as 10812 b.cu.m. The dynamic component is replenished annually, which has been assessed as 432 b.cu.m. According to the National Water Policy (2002), development of groundwater resources is to be limited to utilization of the dynamic component of groundwater. The available groundwater resources and replenishable resources56 are given in Table 5. The total annual replenishable groundwater resource is about 432 b.cu.m. Groundwater availability and development scenarios: During the past four decades, there has been a phenomenal CURRENT SCIENCE, VOL. 90, NO. 12, 25 JUNE 2006
REVIEW ARTICLES Table 5.
State/Union Territory State Andhra Pradesh Arunachal Pradesh Assam Bihar Chhattisgarh Delhi Goa Gujarat Haryana Himachal Pradesh Jammu and Kashmir Jharkhand Karnataka Kerala Madhya Pradesh Maharashtra Manipur Meghalaya Mizoram* Nagaland Orissa Punjab Rajasthan Sikkim* Tamil Nadu Tripura Uttar Pradesh Uttaranchal West Bengal
Groundwater resource of India (b.cu.m/yr) as on 31 March 2003
Total replenishable groundwater resource
35.29 1.44 24.72 26.99 16.07 0.29 0.22 20.38 8.53 0.37 4.43 6.53 16.19 7.90 34.82 37.87 3.15 0.54 1.40* 0.72 20.00 18.66 12.71 0.07* 26.39 0.66 81.12 2.70 23.09
Total states 433.24* (431.77) Union territories Andaman and Nicobar Islands* 0.326* Chandigarh 0.030 Dadar and Nagar Haveli 0.042 Daman and Diu 0.013 Lakshadweep 0.002 Pondicherry 0.029 Total union territories 0.442* (0.116) Grand total
433.882* (431.886)
Provision for domestic, industrial and other uses
5.29 0.22 3.71 4.05 2.41 0.18 0.03 3.06 1.28 0.07 0.66 0.98 2.43 1.31 5.22 12.40 0.47 0.08 0.21* 0.11 3.00 1.87 1.99 0.01* 3.96 0.10 12.17 0.41 3.46 71.14* (70.92) 0.013*
Available groundwater resources for irrigation
30.00 1.22 21.01 22.94 13.66 – 0.19 17.32 7.25 0.29 3.76 5.55 13.76 6.59 29.60 25.47 2.68 0.46 1.19* 0.62 17.00 16.79 10.71 0.06* 22.43 0.56 68.95 2.29 19.63 361.98* (360.73) 0.313*
Net draft
8.57 – 1.84 10.63 0.81 0.12 0.02 9.55 8.13 0.03 0.03 1.84 4.76 1.46 8.02 9.44 Neg. 0.02 Neg. Neg. 3.61 16.40 9.26 Neg. 14.45 0.19 32.33 0.82 7.50 149.82
0.006 0.002 – 0.004 0.025* (0.012)
0.04 0.01 – 0.02 0.384 (0.071)
Neg. 0.025 0.005 0.008 0.007 0.116 0.160
71.165* (70.932)
362.364* (360.80)
149.97
Balance groundwater resource for future use
21.43 1.22 19.17 12.31 12.85 – 0.17 7.77 0.00 0.26 3.73 3.71 9.00 5.13 21.58 16.04 2.68 0.44 1.19* 0.62 13.39 0.00 1.45 0.06* 7.98 0.38 36.62 1.47 12.13 212.78* (211.53) 0.313*
Level of groundwater development
28.56 Neg. 8.75 46.33 5.93 – 8.30 55.16 112.18 10.72 0.81 33.13 34.60 22.17 27.09 37.04 Neg. 3.97 Neg. Neg. 21.23 97.66 86.42 Neg. 64.43 33.43 46.89 35.78 38.19 41.53 Neg.
0.031 0.003 – 0.000 0.348* (0.035)
12.81 70.00 – –
213.128* (211.56)
41.57
*Total replenishable groundwater resource of the country was estimated to be 433.68 b.cu.m. However, according to the decision taken in 1995, the agreed figure of 432 b.cu.m is retained as the rounded-off figure for 431.88 b.cu.m. The discrepancy has crept in due to inclusion of figures in respect of states like Mizoram, Sikkim and UT of Andaman and Nicobar Islands at a later stage. Neg., negligible. Source: CGWB.
increase in the growth of groundwater abstraction structures due to implementation of technically viable schemes for development of the groundwater resource, backed by liberal funding from institutional finance agencies, improvement in availability of electric power and diesel, good quality seeds, fertilizers, government subsidies, etc. During the period 1951–97, the number of dug wells increased from 3.86 to 10.50 million, shallow tubewells from 3000 to 6.74 million and public bore/tubewells from a negligible number to 90,000. Electric pump-sets have CURRENT SCIENCE, VOL. 90, NO. 12, 25 JUNE 2006
increased from a negligible number to 9.34 million and diesel pumps from 66,000 to about 4.59 million57. There has been a steady increase in area irrigated by groundwater from 6.5 mha in 1951 to 41.99 mha in 1997. During the VIII Plan (1992–97), 1.71 million dug wells, 1.67 million shallow tubewells and 114,000 deep tubewells have been added. Growing demand of water in agriculture, industrial and domestic sectors, has brought problems of over-exploitation of the groundwater resource, continuously declining 1617
REVIEW ARTICLES groundwater levels, sea water ingress in coastal areas, and groundwater pollution in different parts of the country. The falling groundwater levels in various parts of the country have threatened the sustainability of the groundwater resource, as water levels have gone deep beyond the economic lifts of pumping. The Central Groundwater Board has established more than 15,000 network-monitoring stations in the country to monitor groundwater level and its quality. Water levels in major parts of the country generally do not show any significant rise/fall. However, significant decline in the level of groundwater has been observed in certain pockets of 289 districts in Andhra Pradesh, Assam, Bihar, Chhattisgarh, NCT Delhi, Gujarat, Haryana, Jharkhand, Karnataka, Kerala, Madhya Pradesh, Maharashtra, Orissa, Punjab, Rajasthan, Tamil Nadu, Tripura, Uttar Pradesh and West Bengal. Delhi, Haryana, Punjab, Rajasthan, Chandigarh and Diu have recorded high level of groundwater development (more than 85%). In case of Rajasthan, low rainfall conditions have resulted in poor recharge to groundwater, whereas in case of Delhi, Haryana and Punjab, high rate of groundwater withdrawal is the main cause for high stage of groundwater development (Table 5). Gujarat (55%), Tamil Nadu (64%), Daman (70%) and Pondicherry also have significantly high level of groundwater development. With rapid expansion in groundwater extraction, developmentrelated problems have started emerging. There is continuous growth in dark and over-exploited areas in the country. Out of 7928 blocks/watersheds in the country, 673 blocks/watersheds are categorized as over-exploited, where the stage of groundwater development exceeds the annual replenishment and 425 blocks/watersheds are dark or critical, where groundwater development has reached a high level. Substantial decline of groundwater levels occurs even in blocks with sufficient groundwater resources due to climatic vicissitudes and localized development58.
Water development use scenarios Water demand At present, available statistics on water demand shows that the agriculture sector is the largest consumer of water in India. About 83% of the available water is used for agriculture alone. The quantity of water required for agriculture has increased progressively through the years as more and more areas were brought under irrigation. Since 1947, the irrigated area in India rose from 22.60 to 80.76 mha up to June 1997. Contribution of surface water and groundwater resources for irrigation has played a significant role in India attaining self-sufficiency in food production during the past three decades, but it is likely to become more critical in future in the context of national food security. According to available estimates, due to judicious utilization, the demand on water in this 1618
sector is projected to decrease to about 68% by the year 2050, though agriculture will still remain the largest consumer. In order to meet this demand, augmentation of the existing water resources by development of additional sources of water or conservation of the existing resources through impounding more water in the existing water bodies and their conjunctive use will be needed. Figure 6 depicts the driving forces of both water supply and water demand59. In 1999, the National Commission for Integrated Water Resources Development estimated the water requirements for the years 2010, 2025 and 2050 at the national level60 (Table 6).
Long-term water supply prospects In order to fulfil water demands in the future, we will need to rationalize on various means of capturing and storing water. Harvesting of rainwater should contribute in meeting the future water requirements sustainability in India. The rivers and rivulets of the Indian subcontinent are mainly monsoon-fed, with 80 to 90% run-off generated during the monsoon. The principle source for groundwater recharge is also monsoon precipitation. The country receives more than 75% monsoon rainfall from June to September, except in the eastern coast. Annually, the rainy days vary from 12 to 100, and actual total rainfall time in the season varies from a few hours to over 300 h. Incidences of up to 60% annual rainfall within a duration of a few days are not uncommon, which cause excessive run-off, taking a heavy toll of life, agriculture and property. The inter-annual variability of the monsoon is expected to increase in the future due to possible climate change, making the monsoon less reliable as an assured source of water. Therefore, efforts are needed for more efficient groundwater recharge and harvesting of rainwater through identification, adoption and adaptation of technological options. Harnessing of excess monsoon run-off to create additional groundwater storage will not only increase the availability of water to meet the growing demand, but also help in controlling damages from floods. The sub-surface reservoirs can store substantial quantity of water, and are attractive and technically feasible alternatives for storing surplus monsoon run-off. The subsurface reservoirs, located in suitable hydrogeological situations, will be an environment-friendly and economically viable proposition. The sub-surface storages have advantages of being free from adverse effects like inundation of large surface area, loss of cultivable land, displacement of local population and substantial evaporation losses. The underground storage of water would also have beneficial influence on the existing groundwater regime. The deeper groundwater levels in many parts of the country, either of natural occurrence or due to excessive groundwater development, may be substantially raised resulting in reduction on lifting costs and energy. The quality of CURRENT SCIENCE, VOL. 90, NO. 12, 25 JUNE 2006
REVIEW ARTICLES
Uncertain future global, national, regional boundary conditions (technology, law, socio-economic development, politics, value judgments, consumer habits)
Economic restrictions
Climate change
B A L A N C E
Ecological restrictions Future water supply Several sources of point pollution
Climate change
Population growth
Industrial development
Future demand of water
Standard of life
Land-use change
Saving of water
Non-point pollution
Substitution of drinking water
Information Influence
information
influence
information
Policy options (measures to improve the water balance)
Figure 6.
Driving forces of water supply and demand (after Hornbogen and Schultz59). Table 6.
Water requirement for different uses (b.cu.m.)
Year 2010 Use
Low
High
318 17 21 7 – – 36 399
330 23 26 14 7 5 42 447
339 24 26 15 7 5 42 458
Groundwater Irrigation Domestic and municipal Industry Power Total (B)
206 13 9 2 230
213 19 11 4 247
Grand total (A + B)
629
Total water use Irrigation Domestic Industry Power Inland navigation Environment ecology Evaporation loss Total
Surface water Irrigation Domestic Industry Power Inland navigation Environment ecology Evaporation loss Total (A)
Year 1997–98
Year 2025 Percentage
Year 2050
Low
High
Percentage
Low
High
Percentage
48 3 4 2 1 1 6 65
325 30 47 25 10 10 50 497
366 36 47 26 10 10 50 545
43 5 6 3 1 1 6 65
375 48 57 50 15 20 76 641
463 65 57 56 15 20 76 752
39 6 5 5 1 2 6 64
218 19 11 4 252
31 2 1 1 35
236 25 20 6 287
245 26 20 7 298
29 3 2 1 35
253 42 24 13 332
344 46 24 14 428
29 4 2 1 36
694
710
100
784
843
100
973
1128
100
524 30 30 9 0 0 36
543 42 37 18 7 5 42
557 43 37 19 7 5 42
78 6 5 3 1 0 1
561 55 67 31 10 10 50
611 62 67 33 10 10 50
72 7 8 4 1 1 6
628 90 81 63 15 20 76
817 111 81 70 15 20 76
68 9 7 6 1 2 7
629
694
710
100
784
843
100
973
1180
100
Source: Ref. 60. CURRENT SCIENCE, VOL. 90, NO. 12, 25 JUNE 2006
1619
REVIEW ARTICLES natural groundwater would substantially improve in brackish and saline areas. The conduit function of aquifers can further help in natural sub-surface transfer of water to various need centres, thereby reducing the cost-intensive surface-water conveyance system. The effluence resulting from such sub-surface storage of various surface intersection points in the form of spring line or stream emergence, would enhance river flows and improve the degraded ecosystem of river tracts, particularly in the outfall areas. The structures required for recharging groundwater reservoirs are of small dimensions and cost-effective such as check dams, percolation tanks, surface-spreading basins, pits, sub-surface dykes, etc. and these can be constructed with local knowledge. Much of the future demand needs to be met from the groundwater resources. The water potential of the Ganga valley (both surface and groundwater) can irrigate an additional 200 mha of land, which can produce another 80 mt of rice, sustaining another 350–400 million people60. Excess water requirement in the future can, however, be handled through properly planned and precise management. Study carried out for the Ganga basin by Singh61 need to be conducted for all major river basins in the country in order to discover additional potential sources of water, such as deep artesian aquifers.
Projected climate change Table 8 shows selective reports about projected climate changes using Global Climate Models (GCMs) and Regional Climate Models (RCMs) over India during the 21st century73–76. Generally, all reports showed changing patterns in rainfall and an increase in temperature. Utility of precipitation primarily depends upon its spatial as well as temporal distribution. Uniform precipitation over a larger area is more useful than its occurrence over a smaller region. Also, precipitation occurring over a larger time period would be more effectively utilized rather than when it occurs within a short time-span. Therefore, projected changes in precipitation pattern over the Indian subcontinent come as bad news for the water resources sector. First, decrease in winter precipitation would reduce the total seasonal precipitation being received during December– February, implying greater water stress during the lean monsoon period. Secondly, intense rain occurring over fewer days, besides causing increased frequency of floods during the monsoon season, will also mean that much of the monsoon rain would be lost as direct run-off resulting in reduced groundwater recharging potential.
Impact on water resources Climate change Observed climate change and its impact during the past century Temperature and rainfall: Table 7 shows selective studies on observed changes in temperature and rainfall over India during the last century. These reports8,10–14,16,17,62–67 confirm increase in temperature and change in rainfall pattern during the 20th century. Change in river course: This is an environmental problem of serious concern in the Indo-Gangetic Plain Region (IGPR)12. During different times in the past, different rivers changed their course a number of times. During the period 1731–1963, the course of the Kosi River (the sorrow of Bihar) has shifted westward by about 125 km; courses of Ganga, Ghaghara and Son at their confluence have shifted by 35 to 50 km since the epic period68 (~1000 BC) and that of the Indus and its tributaries by 10–30 km in 1200 years in the same direction69. Between 2500 BC and AD 500 the course of the Yamuna river shifted westward to join the Indus and then east to join the Ganga thrice70. Sea-level rise: Das and Radhakrishnan71 reported a rising trend in the sea level at Mumbai (Bombay) during 1940–86 and Chennai (Madras) during 1910–33, based on the annual means of tide-gauge observations. Srivastava and Balakrishnan72 studied the atmospheric tide-gauge data and confirmed a rise in sea level by 8 cm. 1620
Table 9 shows selective reports of impact on water resources during the next century over India. The enhanced surface warming over the Indian subcontinent by the end of the next century would result in an increase in premonsoonal and monsoonal rainfall and no substantial change in winter rainfall over the central plains. This would result in an increase in the monsoonal and annual run-off in the central plains, with no substantial change in winter run-off and increase in evaporation and soil wetness during the monsoon and on an annual basis77. A case study in Orissa and West Bengal78 estimates that in the absence of protection, one metre sea-level rise would inundate 1700 km2 of predominantly prime agricultural land. In another study79, it was found that in the absence of protection, a one metre sea-level rise on the Indian coastline, is likely to affect a total area of 5763 km2 and put 7.1 million people at risk. TERI80 has done a district-level ranking of vulnerability to one metre sea-level rise by constructing a weighted index. From the GCM simulations of climate, it is found that projected increases in potential evaporation were related largely to increases in the vapour pressure deficit resulting from higher temperature81. The effect of climate change using different climatic scenarios on snow-water equivalent, snowmelt run-off, glacier melt run-off and total stream flow and their distribution is examined for Spiti River, which is a highaltitude Himalayan river located in the western Himalayan region. It is found that annual snowmelt run-off, glacier melt run-off and total stream flow increase linearly CURRENT SCIENCE, VOL. 90, NO. 12, 25 JUNE 2006
REVIEW ARTICLES Table 7. Region All-India All-India
Western Himalayas
Indo-Gangetic Plain Region (IGPR)
Observed climate change during the 20th century over India
Temperature Increase in 0.4°C/100 yrs in mean annual temperature Increase in maximum temperature (0.6°C/100 yrs) Minimum temperature trend less General increase in the diurnal range of temperature Winter season – Srinagar, Mussoorie and Mukteswar show increasing trend (0.5°C/100 yrs) Monsoon season – Srinagar, which is beyond the monsoon regime, shows significant increasing trend, whereas Mussoorie and Dehradun, which are at the foothills of the Himalayas, show decreasing trend Annual surface air temperature of the IGPR shows rising trend (0.53°C/100 yrs during 1875–1958). Decreasing trend (–0.93°C/100 yrs during 1958–1997)
All-India NE Peninsula, NE India, NW Peninsula, west coast and central peninsula Western and eastern Himalayas
Rajasthan desert
Rising trend at Barmer, Jodhpur, Ajmer and Pali Decreasing trend at Udaipur and Jwaibandh
10
No increasing or decreasing trend for the last 100 years
11
Summer monsoon rainfall over western IGPR shows increasing trend (170 mm/100 yrs) from 1900, while over central IGPR it shows decreasing trend (5 mm/100 yrs) from 1939 and over eastern IGPR a decreasing trend (50 mm/100 yrs) during 1900–84 and increasing trend (480 mm/100 yrs) during 1984–99 Westward shift in rainfall activities over the IGPR Monsoon rainfall is trendless and is mainly random in nature over a long period NE peninsula, NE India and NW peninsula show decreasing trend in the Indian summer monsoon rainfall (–6 to 8% of normal/100 yrs), while increasing trend was noticed along the west coast and over central peninsula (+10 to 12% of normal/100 yrs)
12
Annual rainfall indicating increasing tendency at 19 stations (around Ajmer in upper part of the Luni basin) Decreasing trend at the remaining nine stations in lower Luni basin, i.e. Barmer
with changes in temperature (1–3°C), but the most prominent effect of increase in temperature has been noticed on glacier melt run-off82. The regional effects of climate change on various components of the hydrological cycle, namely surface run-off, soil moisture and evapotranspiration (ET) for three drainage basins of Central India have been analysed. Results indicated that the basin located in a comparatively drier region is more sensitive to climatic changes. The significant effect of climate change on reservoir storage, especially for drier scenarios, necessitates the need for further critical analysis of these effects83. CURRENT SCIENCE, VOL. 90, NO. 12, 25 JUNE 2006
Reference 8
Western Himalayas gets more snowfall than eastern Himalayas during winter. More rainfall in the eastern Himalayas than in the western Himalayas during monsoon season Decadal departures in summer monsoon rainfall are found above and below the long-time average alternatively for three consecutive decades Slight increases in monsoon rainfall in spite of large inter-annual variations Pockets of significant long-term rainfall changes
All-India
In different locations Luni River Basin (arid west Rajasthan)
Rainfall
13, 14 16
17
65
66 62–64 67
The hydrologic sensitivity of the Kosi Basin to projected land use and potential climate change scenarios has been analysed. It was found that run-off increase was higher than precipitation increase in all the potential climate change scenarios applying cotemporary temperature. The scenario of contemporary precipitation and a rise in temperature by 4°C caused a decrease in run-off by 2– 8%, depending upon the areas considered and the model used84,85. It is also projected that soil moisture increases marginally by 15–20% over parts of southern and Central India. This increase is confined to the monsoon months of June through September. During the rest of the year, 1621
REVIEW ARTICLES Table 8. Region
Projected climate change during the next century over India
Temperature
Rainfall
Reference
All-India
Increase in winter temperature by 1–4°C with increased CO2 concentration
Precipitation increase of approximately 20% Increase in heavy rainfall days during the summer monsoon period and an increased inter-annual variability
73
All-India
Average temperature change is predicted to be in the range of 2.33 to 4.78°C, with a doubling in CO2 concentration
Increase in frequency of heavy rainfall events
74
All-India
Area-averaged annual mean surface temperature rise is projected to range between 3.5 and 5.5°C by the end of the century More warming in winter season
Increase of about 7 to 10% in annual mean precipitation Decline of 5–25% in winter precipitation Increase in monsoon precipitation is 10–15% Monsoon season over northwest India – increase of 30% or more in rainfall by 2050 Western semi-arid regions of India could receive higher than normal rainfall in a warmer atmosphere Decrease in winter precipitation between 10 and 20% over central India by 2050
75
All-India
Over the region south of 25°N (south of cities such as Udaipur, Khajuraho and Varanasi), maximum temperature will increase by 2–4°C during 2050s. In the northern region, increase in maximum temperature may exceed 4°C A general increase in minimum temperature up to 4°C all over the country
Decrease in number of rainy days over a major part of the country. This decrease is more in the western and central parts (by more than 15 days), while near the foothills of the Himalayas (Uttaranchal) and in northeast India, the number of rainy days may increase by 5–10 days. Increase in rainy days intensity by 1–4 mm/day, except for small areas in northwest India, where rainfall intensities may decrease by 1 mm/day
76
Table 9.
Impact on water resources during the next century over India
Region/location
Impact
Reference
Indian subcontinent
Increase in monsoonal and annual run-off in the central plains No substantial change in winter run-off Increase in evaporation and soil wetness during monsoon and on an annual basis
Orissa and West Bengal
One metre sea-level rise would inundate 1700 km2 of prime agricultural land
77
2 2
Indian coastline
One metre sea-level rise on the Indian coastline is likely to affect a total area of 5763 km and put 7.1 million people at risk
All-India
Increases in potential evaporation across India
81
Central India
Basin located in a comparatively drier region is more sensitive to climatic changes
83
Kosi Basin
Decrease in discharge on the Kosi River Decrease in run-off by 2–8%
84 85
Southern and Central India
Soil moisture increases marginally by 15–20% during monsoon months
86
Chenab River
Increase in discharge in the Chenab River
87
River basins of India
General reduction in the quantity of the available run-off, increase in Mahanadi and Brahmini basins
88
Damodar Basin
Decreased river flow
89
Rajasthan
Increase in evapotranspiration
92
there is either no change in soil moisture or a marginal decline, possibly due to increase in temperature leading to enhanced ET86. Arora et al.87 projected an increase in discharge in the Chenab River. However, increase in rainfall is also observed at high altitudes. Gosain and Rao88 projected that the quantity of surface run-off due to climate change would vary across the river basins as well as sub-basins in India. However, there is general reduction in the quantity of the available run-off (Figure 7). An increase in precipitation in the Mahanadi, 1622
79
Brahimani, Ganga, Godavari and Cauvery is projected under climate change scenario; however, the corresponding total run-off for all these basins does not increase. This may be due to increase in ET on account of increased temperature or variation in the distribution of rainfall. In the remaining basins, a decrease in precipitation was noticed. Sabarmati and Luni basins show drastic decrease in precipitation and consequent decrease of total run-off to the tune of two-thirds of the prevailing run-off. This may lead to severe drought conditions in future. The analysis CURRENT SCIENCE, VOL. 90, NO. 12, 25 JUNE 2006
REVIEW ARTICLES
Figure 7.
Changes in rainfall, run-off and AET due to projected climate change.
has revealed that climate change scenario may deteriorate the condition in terms of severity of droughts and intensity of floods in various parts of the country. There have been few more studies on climate change impacts on Indian water resources89–91. Goyal92 studied the sensitivity of ET to global warming for arid regions of Rajasthan and projected an increase of 14.8% in total ET demand with increase in temperature. However, ET is less sensitive to increase in solar radiation, followed by wind speed in comparison to temperature. Increase in water vapour has a negative impact on ET (–4.3%). Goyal concluded that a marginal increase in ET demand due to global warming would have a larger impact on the resource-poor, fragile arid zone ecosystem of Rajasthan. Problems in groundwater management in India have potentially huge implications due to global warming. The most optimistic assumption suggests that an average drop in groundwater level by one metre would increase India’s total carbon emissions by over 1%, because the time of withdrawal of the same amount of water will increase fuel consumption. A more realistic assumption reflecting the area projected to be irrigated by groundwater in 2003, suggests that the increase in carbon emission could be 4.8% for each metre drop in groundwater levels. Chadha90 recommended studying the aquifer geometry, establishing the saline fresh interfaces within 20 km of the coastal area, the effect of glaciers melting on recharge potential of aquifers in the Ganga basin and its effects on the transboundary aquifer systems, particularly in the arid and semi-arid regions. These studies are still at infancy and more data, in terms of field information are to be generated. This will also faCURRENT SCIENCE, VOL. 90, NO. 12, 25 JUNE 2006
cilitate appropriate validation of the simulation for the present scenarios. However, from the above studies, it is clear that the global warming threat is real and the consequences of climate change phenomena are many and alarming. The impact of future climatic change may be felt more severely in developing countries such as India, whose economy is largely dependent on agriculture and is already under stress due to current population increase and associated demands for energy, freshwater and food. In spite of the uncertainties about the precise magnitude of climate change and its possible impacts, particularly on regional scales, measures must be taken to anticipate, prevent or minimize the causes of climate change and mitigate its adverse effects.
Discussion and conclusion As mentioned earlier, the current simulation results from GCMs are still considered uncertain. Ability of present GCMs in predicting the impact of climate change on rainfall is still not promising. In addition, there are uncertainties involved in predicting extreme flood and drought events by these models. While climate models predict an increase in precipitation by –24 to 15% over India79, regional changes may be different81. Studies on inter-annual and long-term variability of monsoon and annual rainfall have indicated that variation in rainfall for the subcontinent is statistically significant9,14. Analysis of observed rainfall data for the 131-yr period (1871–2001) suggests no clear role of global warming in the variability of monsoon rainfall over India93. Therefore, it is difficult, at this juncture, to convince the water planner and development 1623
REVIEW ARTICLES agencies to incorporate the impact of climate change into their projects and water resources systems. However, given the potential adverse impacts on water resources that could be brought about by climate change, it is worthwhile to conduct more in-depth studies and analyses to gauge the extent of problems that the country may face. Man-made climate changes, i.e. changes in cropping pattern and land-use pattern, over-exploitation of water storage and changes in irrigation and drainage in the Gangetic basin show a reduction in the Ganges discharge by 60% over 25 years. This has led to about 50% drop in water availability in surface water resources, drop in groundwater table and generation of new surface features having different thermal properties94. More studies are needed in different basins, aquifers and agro-climatic regions of India to assess the sensitivity of the basin response to climate change83. Considering the inter-annual variability of rainfall in India, assessment of only volume may not be helpful until temporal and spatial variations of climate change and their impacts are assessed. Agricultural demand, particularly for irrigation water, which is a major share of total water demand of the country, is considered more sensitive to climate change. A change in field-level climate may alter the need and timing of irrigation. Increased dryness may lead to increased demand, but demand could be reduced if soil moisture content rises at critical times of the year2. It is projected95 that most irrigated areas in India would require more water around 2025 and global net irrigation requirements would increase relative to the situation without climate change by 3.5–5% by 2025, and 6–8% by 2075. In India, roughly 52% of irrigation consumption across the country is extracted from groundwater; therefore, it can be an alarming situation with decline in groundwater and increase in irrigation requirements due to climate change. To obtain better quantitative assessment of the climate change impact, it is imperative that more accurate ‘damage due to flood’ and ‘damage due to drought’ relationship should be established and updated periodically. This is especially critical in areas where rapid socio-economic development has taken place. During dry spells, supplementing stream water supply from storages solves only part of the problem. Maintaining the water quality is of equal importance to ensure adequate safe water supply not only for anthropogenic consumption, but also for the healthy survival of its habitats and aquatic life. Therefore, serious efforts and commitment are needed to protect the watersheds and their resources, so that water quality deterioration would not become the limiting factor in determining the availability of water supply, thus jeopardizing the progress in social-economic development programmes in future. It is recognized that prudent and integrated water resources development and management for optimum and sustainable water utilization is an important and urgent issue to be taken up seriously, even without the occurrence of climate change impact. 1624
From the above, it can be concluded that the Indian region is highly sensitive to climate change. The elements/sectors currently at risk are likely to be highly vulnerable to climate change and variability. It is urgently required to intensify in-depth research work with the following objectives: • Analyse recent experiences in climate variability and extreme events, and their impacts on regional water resources and groundwater availability. • Study on changing patterns of rainfall, i.e. spatial and temporal variation and its impact on run-off and aquifer recharge pattern. • Study sea-level rise due to increased run-off as projected due to glacial recession and increased rainfall. • Sea-water intrusions into costal aquifers. • Determine vulnerability of regional water resources to climate change and identify key risks and prioritize adaptation responses. • Evaluate the efficacy of various adaptation strategies or coping mechanisms that may reduce vulnerability of the regional water resources. It has been the endeavour of this study to summarize some important vulnerability issues associated with the present and potential future hydrological responses due to climate change and highlight those areas where further research is required. The National Environment Policy96 also advocated that anthropogenic climate changes have severe adverse impacts on India’s precipitation patterns, ecosystems, agricultural potential, forests, water resources, coastal and marine resources. Large-scale planning would be clearly required for adaptation measures for climate change impacts, if catastrophic human misery is to be avoided. 1. Kunkel, K. E., Pielke, R. A. and Changnon, S. A., Bull. Am. Meteorol. Soc., 1999, 80, 1077–1098. 2. Climate Change 2001, Contribution of Working Group I to the Third Assessment Report of the Intergovernmental Panel on Climate Change (eds Houghton, J. T. et al.), Cambridge University Press, Cambridge, UK, 2001, p. 881. 3. Balling Jr, R. C. and Cerveny, R. S., Nat. Hazards, 2003, 29, 103– 112. 4. Fauchereau, N., Trzaska, M., Rouault, M. and Richard, Y., Nat. Hazards, 2003, 29, 139–154. 5. Domonkos, P., Nat. Hazards, 2003, 29, 255–271. 6. Milly, P. C. D., Wetherald, R. T., Dunne, K. A. and Delworth, T. L., Nature, 2002, 415, 514–517. 7. Peterson, B. J. et al., Science, 2002, 298, 2171–2173. 8. Hingane, L. S., Rupa Kumar, K. and Ramana Murthy, Bh. V., J. Climatol., 1985, 5, 521–528. 9. Srivastava, H. N., Dewan, B. N., Dikshit, S. K., Rao, G. S. P., Singh, S. S. and Rao, K. R., Mausam, 1992, 43, 7–20. 10. Rupakumar, K., Krishna Kumar, K. and Pant, G. B., Geophys. Res. Lett., 1994, 21, 677–680. 11. Pant, G. B., Rupakumar, K. and Borgaonkar, H. P., The Himalayan Environment (eds Dash, S. K. and Bahadur, J.), New Age International (P) Ltd, New Delhi, 1999, pp. 172–184.
CURRENT SCIENCE, VOL. 90, NO. 12, 25 JUNE 2006
REVIEW ARTICLES 12. Singh, N. and Sontakke, N. A., Climatic Change, 2002, 52, 287– 313. 13. Mooley, D. A. and Parthasarathy, B., Climatic Change, 1984, 6, 287–301. 14. Thapliyal, V. and Kulshrestha, S. M., Mausam, 1991, 42, 333– 338. 15. Pant, G. B. and Rupakumar, K., Climates of South Asia, John Wiley, UK, 1997, p. 320. 16. Rupakumar, K., Pant, G. B., Parthasarathy, B. and Sontakke, N. A., Int. J. Climatol., 1992, 12, 257–268. 17. Kripalani, R. H., Inamdar, S. R. and Sontakke, N. A., Int. J. Climatol., 1996, 16, 689–703. 18. Trenberth, K. E., Nat. Implications Environ. Change, 1999, 5, 2– 15. 19. Mirza, M. M. Q., Warrick, R. A. and Ericksen, N. J., Climate Change, 2003, 57, 287–318. 20. Mirza, M. M. Q., Warrick, R. A., Ericksen, N. J. and Kenny, G. J., Hydrol. Sci. J., 1998, 43, 845–858. 21. Goubin, F., Chen, S., Liu, C. and Shepard, D., Climatic Change, 2004, 65, 149–178. 22. Gleick, P. H. and Chalecki, E. L., J. Am. Water Resour. Assoc., 1999, 35, 1429–1441. 23. Rosenberg, N. J., Epstein, J., Wang, D., Vail, L., Srinivasan, R. and Arnold, J. G., Climatic Change, 1999, 42, 677–692. 24. Arora, V. K. and Boer, G. J., J. Geophys. Res. D, 2001, 106, 3335–3348. 25. Evans, J. and Schreider, S., Climatic Change, 2002, 55, 361–393. 26. Huntington, T. G., Agric. For. Meteorol., 2003, 117, 193–201. 27. Christensen, N. S., Wood, A. W., Voisin, N., Lettenmaier, D. P. and Palmer, R. N., Climatic Change, 2004, 62, 337–363. 28. Eckhardt, K. and Ulbrich, U., J. Hydrol., 2003, 284, 244–252. 29. Allen, D. M., Mackie, D. C. and Wei, M., Hydrogeol. J., 2004, 12, 270–290. 30. Loaiciga, H. A., Maidment, D. R. and Valdes, J. B., J. Hydrol., 2000, 227, 173–194. 31. Bouraoui, F., Vachaud, G., Li, L. Z. X., LeTreut, H. and Chen, T., Climate Dyn., 1999, 15, 153–161. 32. Amadore, L., et al., Water, Air, Soil Pollut., 1996, 92, 1–12. 33. Brouyere, S., Carabin, G. and Dassargues, A., Hydrogeol. J., 2004, 12, 123–134. 34. Chen, Z., Grasby, S. E. and Osadetz, K. G., J. Hydrol., 2004, 290, 43–62. 35. Burjia, J. S. and Romani, S., Indian J. Public Adm., 2003, XLIX, 301–307. 36. Census of India, Provisional Population Totals: Paper 1 of 2001, Registrar General and Census Commissioner of India, New Delhi, 2001, p. 184. 37. Agricultural Statistics at a glance, Directorate of Economics and Statistics, Govt of India, New Delhi, 2003. 38. Water and Related Statistics, Central Water Commission, New Delhi, 2002, p. 479. 39. Umapathi, B. and Ramashesha, C. S., Bhu-Jal News, 2001, 16, 9– 15. 40. Freshwater Year 2003, Ministry of Water Resources, Govt of India, New Delhi, 2003, p. 53. 41. Vision for Integrated Water Resources Development and Management, Ministry of Water Resources, Govt of India, New Delhi, 2003, p. 20. 42. Kale, V. S., Nat. Hazards, 2003, 28, 65–84. 43. Gupta, A., In American Geophysical Union, Geophysical Monograph (eds Costa, J. E. et al.), 1995, vol. 89, pp. 125–136. 44. Kale, V. S. (ed.), Flood Studies in India, Geological Society of India, Bangalore, Memoir, 1998, 41, pp. 229–256. 45. Ramakrishnan, P. S., The Himalayan Environment (eds Dash, S. K. and Bahadur, J.), New Age International (P) Ltd, New Delhi, 1999, pp. 213–225.
CURRENT SCIENCE, VOL. 90, NO. 12, 25 JUNE 2006
46. Ives, J. D. and Messerli, B., The Himalayan Dilemma: Reconciling Development and Conservation, Routledge, London, 1989. 47. Upadhyay, D. S., Cold Climate Hydrometeorology, New Age International (P) Ltd, New Delhi, 1995, p. 345. 48. Bahadur, J., The Himalayan Environment (eds Dash, S. K. and Bahadur, J.), New Age International (P) Ltd, New Delhi, 1999, pp. 258–267. 49. Afford, D., ICIMOD Occasional Paper No. 18, Kathmandu, 1992, p. 68. 50. Ageta, Y. and Kadota, T., Ann. Glaciol., 1992, 16, 89–94. 51. Fushimi, H., In (eds Domoto, A. et al.), Tsukiji-Shokan Pub Co Ltd., Japan and The World Conservation Union, Gland, Switzerland, 2000, pp. 42–45. 52. IPCC, Special Report of IPCC Working Group II (eds Watson, R. T. et al.), Intergovernmental Panel on Climate Change, Cambridge University Press, Cambridge, UK, 1998, p. 517. 53. World Meteorological Organization, Report, Geneva, Switzerland, 2002, p. 36. 54. Sinha Ray, K. C. and She Wale, M. P., Mausam, 2001, 52, 541– 546. 55. Theme Paper on Management of Floods and Droughts, Indian Water Resources Society, New Delhi, 22 March 2001, p. 53. 56. Master Plan for Artificial Recharge to Groundwater in India, Central Ground Water Board, New Delhi, February 2002, p. 115. 57. Chadha, D. K. and Sharma, S. K., Groundwater management in India issues and options. Workshop on Past Achievements and Future Strategies, Central Groundwater Authority, New Delhi, 14 January 2000. 58. Romani, S., Groundwater Manage., 2004. 59. Hornbogen, M. and Schultz, G. A., Water: A Looming Crisis? UNESCO, Paris, 1998, pp. 357–362. 60. Report, National Commission for Integrated Water Resources Development, Ministry of Water Resources, September 1999, vol. 1, p. 542. 61. Singh, T., Drought Disaster and Agricultural Development in India, Peoples Publishing House, New Delhi, 1995. 62. Koteswaram, P. and Alvi, S. M. A., Curr. Sci., 1969, 38, 229– 231. 63. Jagannathan, P. and Parthasaathy, B., Mon. Weather Rev., 1973, 101, 371–375. 64. Raghavendra, V. K., Indian J. Meteorol. Geophys., 1974, 25, 197– 210. 65. Kothyari, U. C. and Singh, V. P., Hydrol. Process., 1996, 10, 357– 372. 66. Pant, G. B. and Hingane, L. S., J. Climatol., 1998, 8, 391–401. 67. Singh, R. S., Narain, P. and Sharma, K. D., Vayu Mandal, 2001, 31. 68. Singh, R. L., India: A Regional Geography, National Geographical Society of India, Varanasi, 1971, p. 992. 69. Wilhelmy, H., Universitat, 1967, 10, 53–68. 70. Raikes, R. L., Antiquity, 1968, 63, 286–291. 71. Das, P. K. and Radhakrishnan, M., Proc. Indian Acad. Sci. (Earth Planet. Sci.), 1991, 100, 177–194. 72. Srivastava, H. N. and Balakrishnan, Synthesis of meteorological and tide gauge observations on a decadal scale near the Indian coast. TOGA Notes, 1993, pp. 15–17. 73. Bhaskaran, B., Mitchell, J. F. B., Lavery, J. R. and Lal, M., Int. J. Climatol., 1995, 15, 873–892. 74. Lonergan, S., Climate Warming and India (eds Dinar, et al.), World Bank Technical Paper No. 402, Washington DC, 1998. 75. Lal, M. et al., Curr. Sci., 2001, 81, 1196–1207. 76. Rupakumar, K., Kumar, K., Prasanna, V., Kamala, K., Deshpande, N. R., Patwardhan, S. K. and Pant, G. B., Climate Change and India: Vulnerability Assessment and Adaptation (eds Shukla, P. R. et al.), Universities Press (India) Pvt Ltd, Hyderabad, 2003, p. 462. 77. Lal, M. and Chander, S., JEH, 1993, 1, 3–13.
1625
REVIEW ARTICLES 78. IPCC, Global climate change and the rising challenge of the sea. Supporting document for the IPCC, WMO and UNEP, Geneva, 1992. 79. Impacts of greenhouse inducted sea-level rise on the islands and coasts of India. School of Environmental Sciences, Jawaharlal Nehru University, New Delhi, India, 1993. 80. The economic impact of a one metre sea level rise on the Indian coastline: method and case studies. Report submitted to the Ford Foundation, Tata Energy Research Institute, New Delhi, 1996. 81. Chattopadhyary, N. and Hulme, M., Agric. For. Meteorol., 1997, 87, 55–73. 82. Singh and Kumar, J. Hydrol., 1997, 193, 316–350. 83. Mehrotra, R., Climate Change, 1999, 42, 725–757. 84. Sharma, K. P., Moore III, B. and Vorosmarty, C. J., Climate Change, 2000, 47, 141–165. 85. Sharma, K. P., Vorosmarty, C. J. and Moore III, B., Climate Change, 2000, 47, 117–139. 86. Lal and Singh, S., Mausam, 2001, 52, 1. 87. Arora, M., Singh, P. and Goel, N. K., Evaluation of climate change impact on rainfall, discharge and temperature for a Himalayan basin. Proceedings of the International Conference on Water and Environment, Regional Research Laboratory, Bhopal, 15–18 December 2003. 88. Gosain, A. K. and Rao, S., Climate Change and India: Vulnerability Assessment and Adaptation (eds Shukla, P. R. et al.), Universities Press (India) Pvt Ltd, Hyderabad, 2003, p. 462. 89. Roy, P. K., Roy, D., Mazumdar, A. and Bose, B., Vulnerability assessment of the lower Ganga–Brahmaputra–Meghna basins. In
1626
90.
91.
92. 93. 94. 95. 96.
Proceedings of the NATCOM-V&A Workshop on Water Resources, Coastal Zones and Human Health, IIT-Delhi, New Delhi, 27–28 June 2003. Chadha, D. K., Climate change and groundwater resources of Deccan basalt and Ganga basin. In Proceedings of the NATCOMV&A Workshop on Water Resources, Coastal Zones and Human Health, IIT-Delhi, New Delhi, 27–28 June 2003. Tangri, C. D., Impact of climate change on Himalayan glaciers. In Proceedings of the NATCOM–V&A Workshop on Water Resources, Coastal Zones and Human Health, IIT-Delhi, New Delhi, 27–28 June 2003. Goyal, R. K., Agric. Water Manage., 2004, 69, 1–11. Kripalani, R. H., Kulkarni, A., Sabade, S. S. and Khandekar, M. L., Nat. Hazards, 2003, 29, 189–206. Adel, M. M., Int. J. Climatol., 2002, 22, 993–1016. Döll, P. and Siebert, S., Global Modeling of Irrigation Water Requirement, University of Kassel, Kassel, Germany, 2001. National Environment Policy 2004, Ministry of Environment and Forests, Govt of India, 2004, p. 38.
ACKNOWLEDGEMENTS. I thank Dr Saleem Romani, Chairman, Central Ground Water Board (CGWB), New Delhi for the opportunity to participate in this study. I also thank my colleagues Dr Arijit Dey, Y. B. Kaushik and K. J. Anandha Kumar CGWB, for providing valuable information and advice. Received 19 January 2005; revised accepted 2 February 2006
CURRENT SCIENCE, VOL. 90, NO. 12, 25 JUNE 2006


![[PDF] Climate Change and US Water Resources ... - Google Sites](https://m.moam.info/img/260x300/pdf-climate-change-and-us-water-resources-google-s_647758b5097c474d228bf073.jpg)