chun Zhao2, Sirin Gandhi2, Leandro Borba Moreira2, Jennifer Eschbacher2, Peter ... CLE is capable of image display only and lacks an automatic system to aid ..... W. M. Gondal, J. M. Köhler, R. Grzeszick, G. A. Fink, and M. Hirsch, âWeakly- ...
Weakly-Supervised Learning-Based Feature Localization in Confocal Laser Endomicroscopy Glioma Images Mohammadhassan Izadyyazdanabadi1, 2, Evgenii Belykh2,3,4, Claudio Cavallo2, Xiaochun Zhao2, Sirin Gandhi2, Leandro Borba Moreira2, Jennifer Eschbacher2, Peter Nakaji2, Mark C. Preul2 and Yezhou Yang1 1
Active Perception Group, School of Computing, Informatics, and Decision Systems Engineering, Arizona State University, Tempe AZ 85281, USA
2
Neurosurgery Research Laboratory, Department of Neurosurgery and 3Department of neuropathology, Barrow Neurological Institute, St. Joseph’s Hospital and Medical Center, Phoenix, AZ 85013, USA 4
Department of Neurosurgery, Irkutsk State Medical University, Irkutsk, 664003, Russia
Abstract. Confocal Laser Endomicroscope (CLE) is a novel handheld fluorescence imaging device that has shown promise for rapid intraoperative diagnosis of brain tumor tissue. Currently CLE is capable of image display only and lacks an automatic system to aid the surgeon in analyzing the images. The goal of this project was to develop a computer-aided diagnostic approach for CLE imaging of human glioma with feature localization function. Despite the tremendous progress in object detection and image segmentation methods in recent years, most of such methods require large annotated datasets for training. However, manual annotation of thousands of histopathological images by physicians is costly and time consuming. To overcome this problem, we propose a Weakly-Supervised Learning (WSL)-based model for feature localization that trains on image-level annotations, and then localizes incidences of a class-of-interest in the test image. We developed a novel convolutional neural network for diagnostic features localization from CLE images by employing a novel multiscale activation map that is laterally inhibited and collaterally integrated. To validate our method, we compared proposed model’s output to the manual annotation performed by four neurosurgeons on test images. Proposed model achieved 88% mean accuracy and 86% mean intersection over union on intermediate features and 87% mean accuracy and 88% mean intersection over union on restrictive fine features, while outperforming other state of the art methods tested. This system can improve accuracy and efficiency in characterization of CLE images of glioma tissue during surgery, augment intraoperative decision-making process regarding tumor margin and affect resection rates. Keywords: deep learning, convolutional neural networks, weakly-supervised localization, confocal laser endomicroscopy, glioma, brain tumor diagnosis, digital pathology
2
1
Introduction
Rapid intraoperative interpretation of suspected brain tumor tissue is of paramount importance for planning the treatment and guiding the neurosurgeon towards the optimal extent of tumor resection. Handheld, portable Confocal Laser Endomicroscopy (CLE) is being explored as a fluorescence imaging technique for its ability to image histopathological features of tissue at cellular resolution in real time during brain tumor surgery [1]–[5]. CLE systems can acquire up to 20 images per second with areas in the tumor resection bed being interrogated as an “optical biopsy”. Hundreds of images may be acquired showing thousands of cells, but may be affected with artifacts such as red blood cells and motion distortion, making them complicated to analyze. Although images may be interpreted as largely artefactual, detailed inspection often reveals image areas that may be diagnostic. CLE images present a new fluorescent image environment for the pathologist. Augmenting CLE technology with a computer aided system that can rapidly highlight image regions which may reveal malignant or spreading tumor would have great impact on intraoperative diagnosis. This is relevant for tumors such as gliomas where discrimination of margin regions is key to achieve maximal safe resection which has been correlated with increased patient survival duration [1], [2]. Recent studies have shown that off-the-shelf Convolutional Neural Networks (CNNs) can be used effectively for classifying CLE images based on their diagnostic value [3], [4] and tumor type [5]. However, feature localization models have not been previously applied to CLE images. Feature localization models based on fully supervised learning require large number of images for object-level annotation of the features, which is expensive and time consuming. To overcome this limitation, we used a weakly-supervised localization (WSL) approach. A WSL approach allowed the model to learn and localize the class-specific features from image-level labels. A few groups have recently applied WSL approaches to medical images. A residual neural network was proposed by Qi et. al [6] to distinguish four anatomical classes routinely observed in placenta scans. A Class of interest Activation Map (CAM) was produced for each anatomical class using the Global Average Pooling (GAP) approach as proposed by Zhou et. al [7]. Korbar et. al [8] localized the Regions Of Interest (ROI) in whole-slide images from five colorectal cancer types, following the previously proposed method by Selvaraju et. al in [9]. This approach could mark the regions where the cancer is present in the new whole-slide images; however, this system is limited by requiring labeled patches for the training process. Gondal et. al [10] used GAP to form CAMs for location of regions with diabetic retinopathy on retinal fundus images. Although the model could localize large lesions from the input images, it was unable to detect the smaller lesions. Sailem et. al [11] proposed a CNN architecture which utilized Global Maximum Pooling (GMP) to localize multinucleate cell from microscopic images, using a backpropagation approach proposed by Simoniyan et. al [12]. Feng et. al [13] applied GAP at different layers to detect pulmonary nodules from Computed Tomography (CT) scans, by applying the GAP approach [7], followed by coarse and fine segmentation. Despite the high performance in detecting large nodules, this approach produced low performance in segmenting small nodules, indicating that the low resolution issue was not fully managed. 2
3
We present a novel model for detection of histological features of glioma on CLE images. The architecture included end-to-end Multi-Layer Class Activation Map (MLCAM) with Lateral Inhibition (LI) and Collateral Integration (CI) of the glioma feature localizer neurons. The model was able to segment the CLE images semantically by disentangling class-specific discriminative features that can complement interpretation by the physicians. A WSL based feature localization model was applied to a dataset of CLE images acquired from the patient’s brain during surgery. Performance of the model was assessed by comparing its output to CLE image segmentations performed by neurosurgeons and other deep learning models. Additionally, we validated significant impact of the MLCAM, LI and CI architecture components on the overall performance of the model. The model localized known diagnostic CLE features and revealed new CLE features that correlated with the final classification and importantly which were not previously recognized by the expert reviewers. Unlike previous models that require patch labeling [8] or extra step for creating the activation maps during testing [7], our model is solely trained based on the whole image-level labels. Furthermore, we did not limit the network to localize features that are already known phenotypes to the physicians [11] [13]. CLE images are relatively novel to pathology tissue diagnosis workflow. Although the tissue architecture suggestive for a certain tumor type can be identified on CLE images[14]–[17], detailed characteristic brain tumor patterns for CLE images are not yet well described. Therefore, we used a more general concept (glioma diagnostic vs. nondiagnostic) which includes a range of known histological diagnostic elements (i.e., large nucleus, mitotic figures, hypercellularity, etc.) and allows for registration of previously unrecognized features that may correlate with final image classification. Further investigation of detected features may deepen the understanding of glioma histopathological phenotypes in CLE images, consequently improving its theranostic implications. We intend to make our dataset along with the codes publicly available online to facilitate further research in this domain.
2
Approach
We propose a WSL-based model to generate glioma Diagnostic Feature Maps (DFM) from CLE images, which includes three main components (Figure 1): 1) customized CNN architecture with new design of CAM at different CNN layers. 2) Lateral inhibition (LI) mechanism that suppresses the activation of DFM at locations where its competitor, nondiagnostic feature map (NFM), also exhibit high activation. 3) Collateral integration (CI) mechanism that amplifies activation of DFM at locations where its allies at other layers also have high activations. For an input image 𝐼𝑚 supplied to the CNN, the class scores (𝑆D for diagnostic and 𝑆N for nondiagnostic) are defined from three layers via global pooling of discriminative regions estimated in each activation map (DFM, NFM). The class scores achieved from each layer, are then passed to three softmax layers to deliver the probability of 𝐼𝑚 being diagnostic (D) and nondiagnostic (ND). The softmax layers’ outputs along with the image-level annotations are then streamed into three multinomial logistic loss layers and inject the weight update values into the CNN during backpropagation.
4
2.1
New Design of Class Activation Map (CAM)
Formally, the DFM and NFM at location (𝑥, 𝑦) achieved from layer 𝑧 𝑗 , are defined as: 𝑗
𝐷𝐹𝑀(𝑥, 𝑦, 𝑧 𝑗 ) = ∑𝑘 𝑤𝑘𝑧1 𝑓𝑘 (𝑥, 𝑦, 𝑧 𝑗 ) 𝑗
𝑁𝐹𝑀(𝑥, 𝑦, 𝑧 𝑗 ) = ∑𝑘 𝑤𝑘𝑧1 𝑓𝑘 (𝑥, 𝑦, 𝑧 𝑗 )
(1) (2)
where 𝑓𝑘 (𝑥, 𝑦, 𝑧 𝑗 ) is the activation of kth feature plane of layer 𝑧 𝑗 at location (x, y) and 𝑗
𝑗
𝑤𝑘𝑧1 and 𝑤𝑘𝑧0 are the convolutional weights for DFM and NFM, respectively. By applying GAP and then softmax function on DFM and NFM, the classification scores for different classes are calculated at each layer. Therefore, the softmax input for diagnostic (𝑆D ) and nondiagnostic (𝑆N ) class at layer 𝑧 𝑗 can be formulated as: 𝑗
𝑆D = ∑𝑥,𝑦 DFM (x, y, 𝑧 𝑗 ) = ∑𝑥,𝑦 ∑𝑘 𝑤𝑘𝑧 𝑓𝑘 (𝑥, 𝑦, 𝑧 𝑗 ) 𝑗
𝑆N = ∑𝑥,𝑦 NFM (x, y, 𝑧 𝑗 ) = ∑𝑥,𝑦 ∑𝑙 𝑤𝑙𝑧 𝑓𝑙 (𝑥, 𝑦, 𝑧 𝑗 )
(3) (4)
With the novel design of MLCAM, DFM and NFM were produced in every forward pass and were updated through backpropagation. Furthermore, producing DFM from deeper layers empowered the overall predictive power of the model (i.e. labeling the detected region as diagnostic or nondiagnostic), while DFM from shallower layers allowed larger spatial resolution and more precise detection of fine regions.
Fig. 1. Proposed Multi-Layer Class Activation Map with Lateral Inhibition and Collateral Integration (MLCAM-LICI) architecture for weakly supervised localization of glioma diagnostic features. The model generates the probability of input image being diagnostic (D) and nondiagnostic (ND), and the Final DFM (FDFM).
4
5
2.2
Lateral Inhibition and Collateral Integration of Localizer Neurons
During the computation of DFM and NFM, some locations might be activated in both feature maps, which indicates the model’s confusion about the diagnostic value of those regions. The activation of DFM was downregulated in these regions, using NFM activations. This mechanism is known as neuronal lateral inhibition in neurobiology [18]). Furthermore, we upregulated the activation of regions which had higher recurrence of activation by integrating DFMs achieved from different layers. To combine these two neural interactions, we proposed the following equation for producing the Final DFM (FDFM): 𝐹𝐷𝐹𝑀(𝑥, 𝑦) = ∑𝑧 𝑖,𝑧 𝑗 (𝑖≠𝑗)[𝐷𝐹𝑀′(𝑥, 𝑦, 𝑧 𝑖 ) − 𝐷𝐹𝑀′(𝑥, 𝑦, 𝑧 ). 𝑁𝐹𝑀′(𝑥, 𝑦, 𝑧 𝑖 )]. [𝐷𝐹𝑀′(𝑥, 𝑦, 𝑧 𝑗 − 𝐷𝐹𝑀′(𝑥, 𝑦, 𝑧 𝑗 ). 𝑁𝐹𝑀′(𝑥, 𝑦, 𝑧 𝑗 )] (5) 𝑖
where 𝐷𝐹𝑀′(𝑥, 𝑦, 𝑧 𝑖 ) and 𝑁𝐹𝑀′(𝑥, 𝑦, 𝑧 𝑖 ) are the value of normalized diagnostic and nodiagnostic feature maps achieved from layer 𝑧 𝑖 , after upsampling to the original input image size. As shown in (5), the downregulation for layer 𝑧 𝑖 is implemented by subtracting the 𝐷𝐹𝑀(𝑥, 𝑦, 𝑧 𝑖 ). 𝑁𝐹𝑀(𝑥, 𝑦, 𝑧 𝑖 ) term, which represents the confusing regions at this layer, from 𝐷𝐹𝑀(𝑥, 𝑦, 𝑧 𝑖 ). Lastly, 𝐹𝐷𝐹𝑀(𝑥, 𝑦) was also normalized. Figure 1 presents the structure of the proposed network.
3
Experimental Setup and Results
To train our model on image-level annotations, first, a “classification dataset” was created. The classification dataset included 6,287 CLE images (3,126 diagnostic and 3,161 nondiagnostic) from 20 patients with glioma brain tumors. If the CLE image depicted any distinguishable diagnostic features, it was labeled as diagnostic and otherwise as nondiagnostic. Table 1 shows the composition of the classification dataset and the number of images used in each stage. The classification dataset was divided on patient level for model development and test (12 cases for training, 4 cases for validation and 4 cases isolated for testing). Stochastic Gradient Descent (SGD) with an initial learning rate of 0.001 and momentum of 0.9 was used to optimize the model’s parameters. Learning rate decay policy was set to step function with a gamma of 0.9 and step size of 500 iterations. Image cropping and rotation were not used for augmentation because these might harm the validity of images. Since the diagnostic features could be very small, not every crop of a diagnostic image would be diagnostic. Also, there is no guarantee that the acquired CLE images are rotation invariant (e.g. the surgeons’ preference for holding the CLE probe). Training batch size was set to 15 images and it took 22,000 iterations to achieve the model with the minimum loss on classification of validation images. All the experiments were performed in Caffe [20] deep learning framework, using a GeForce GTX 980 Ti GPU (6 GB memory). To validate the efficacy of the proposed theoretical WSL model, we tested the following three hypotheses. First, the model can correctly segment the image regions which have features that are indicative of glioma, confirmed by physicians at different
6
scales (i.e. medium-sized intermediate and small-sized restrictive scales) and without much reliance on previous exposure (i.e. images from training, validation and test stages). Second, the proposed new components (MLCAM, LI, and CI) increase the performance of the model in detecting the features (especially restrictive features) compared to the other state of the art WSL methods that lack them and removing any of these would affect the model performance negatively. Third, the proposed method can detect novel features in CLE images that were not previously recognized by the physicians. The three hypotheses were tested empirically, using image semantic segmentation task with the following evaluation metrics: mean accuracy (mean_acc), mean intersection over union (mean_IU), and frequency-weighted intersection over union (fw_IU). A segmentation dataset including 310 CLE images was acquired from images annotated by four neurosurgery fellows. Each observer highlighted the diagnostic glioma features of each CLE images, independently. For rigorous assessment of the first hypothesis, segmentation dataset included diagnostic regions at different scales. (145 images were annotated for both Intermediate (Set2-I) and Restrictive (Set2-R) features). Also, to study the effect of previous exposure of CLE image to the model, we used images from all three stages: 30 images from training (Set1), 145 images form validation (Set2), and 135 images from test set (Set3 and Set4)). To appraise the second hypothesis, we sequentially altered components of the designed architecture and assessed the resulting model’s performance (“ablation study”). All models were trained and tested on the same data with the same parameters to avoid any bias. Finally, to test the third hypothesis, our dataset included 55 CLE images that were known to be from glioma tumors, but were initially classified as nondiagnostic (Set4). The model’s segmentation output was produced for all the images with one forward pass, followed by thresholding (threshold value of 0.03 for intermediate and 0.2 for restrictive features).
Table 1. Number of Diagnostic (D) and Nondiagnostic (N) images used for training, validation (Val), and test stage is presented.
Train Val Test Total
D
N
All
1714 487 925 3126
1729 511 921 3161
3443 998 1846 6287
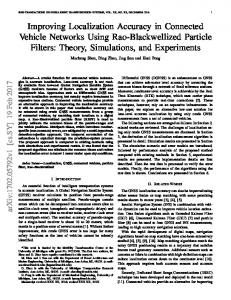
Fig. 2. Network architectures used for the ablation study. Top network shows MLCAM_k architecture (proposed structure without LI and CI components) and bottom network shows the MLGAP [18] structure which combines the three CAMs and then uses a GAP layer for classification.
Table 2 shows experimental results of segmentation performance by ten different models with resepect to human annotators. First hypothesis proved to be true, since our
6
7
proposed model, M2, produced high mean_acc, mean_IU, and fw_IU for all the intermediate features from diagnostic images (Set1, Set2-I, and Set3). Moreover, it could segment the diagnostic regions from Set3 images without significant change in mean_acc, while producing better fw_IU and mean_IU values on images that were previously revealed to it (Set1). Results from Set2-I and Set2-R images showed that all models generated much lower mean_IU and fw_IU on restrictive features compared to intermediate features, except for M1 [13] and M2 models, which are both multi-layer architectures and utilize shallower layers for enhancing the DFM's spatial resolution. In all experiments, M2 made the best performance for three measures (except in mean_acc for Set2-R), supporting the second hypothesis about significant value of all components for the proposed model. Additionally. Analysis of ablated models (M3M9) showed the necessity of proposed components. Additionally, M4-M6 models produced better results compared to other ablated models (M7-M10), highlighting the significance of LI component. In Set4 experiment, the highest performance belonged to M2 (mean_acc and mean_IU of 88% and 89%, respectively), and the next best performance was achieved by M6 (78% and 57%, repectively). These results suggest the proposed architecture could segment diagnostic features not only from the diagnostic images, but also from images that were initially labeled as nondiagnostic, verifying third hypothesis.
fw_IU
mean_IU
mean_acc
Table 2. Segmentation performance achieved from different models on different evaluationmetrics. The following 10 models were tested: M1: similar to [13]; M2: our proposed system; ablated models (M3: M2 without LI component; M4, M5, M6: M2 without CI, using only one DFM; M7, M8, M9: M2 without LI and CI); M10: similar to top architecture of [7]. Set M1 M2* M3 M4 M5 M6 M7 M8 M9 M10 Set1 0.71 0.88 0.71 0.75 0.75 0.77 0.71 0.71 0.71 0.7 Set2-I 0.76 0.85 0.74 0.76 0.76 0.77 0.74 0.74 0.74 0.74 Set3 0.72 0.86 0.72 0.75 0.75 0.76 0.72 0.72 0.72 0.72 Set2-R 0.78 0.87 0.79 0.88 0.88 0.85 0.78 0.79 0.81 0.78 Set4 0.74 0.88 0.74 0.76 0.76 0.78 0.74 0.74 0.74 0.72 Set1 0.65 0.9 0.61 0.69 0.69 0.72 0.61 0.61 0.61 0.63 Set2-I 0.69 0.86 0.67 0.69 0.71 0.73 0.65 0.67 0.67 0.69 Set3 0.57 0.82 0.56 0.59 0.61 0.63 0.56 0.56 0.56 0.59 Set2-R 0.77 0.88 0.29 0.57 0.63 0.59 0.27 0.29 0.31 0.63 Set4 0.48 0.89 0.48 0.52 0.55 0.57 0.48 0.48 0.48 0.5 Set1 0.8 0.99 0.8 0.83 0.85 0.87 0.8 0.8 0.8 0.8 Set2-I 0.88 0.98 0.86 0.88 0.9 0.92 0.86 0.86 0.86 0.86 Set3 0.65 0.88 0.65 0.69 0.71 0.73 0.65 0.65 0.65 0.67 Set2-R 0.9 0.97 0.18 0.5 0.61 0.58 0.14 0.16 0.2 0.67 Set4 0.38 0.79 0.35 0.42 0.44 0.46 0.35 0.35 0.35 0.4
8
4
Conclusions
In this study, a WSL model was proposed to segment the diagnostic features of glioma in CLE images. It utilizes three fundamental components for creating the final glioma DFM: multi-scale DFM, LI for removing confusing regions, and CI to spatially infuse diagnostic areas from DFMs with different spatial resolutions. The proposed model could segment the diagnostic regions with high agreement with neurosurgeons’ annotation, from both diagnostic and nondiagnostic images (i.e. images that were initially designated as lacking diagnostic features) in intermediate and restrictive features, while outperforming other methods. Such an approach should be tested on larger datasets. Initial testing demonstrates that WSL has the potential to identify novel but relevant diagnostic features in CLE images that were not previously recognized and require further investigation. This approach can be augmented with active learning and patch clustering to create a smart atlas of glioma phenotypes in CLE images. Further detailed studies correlating regular histology and CLE images are necessary for better understanding of glioma histopathological features on CLE images.
5 1.
2.
3. 4.
5. 6.
7.
8.
9.
10.
11.
References J. P. Almeida, K. L. Chaichana, J. Rincon-Torroella, and A. Quinones-Hinojosa, “The Value of Extent of Resection of Glioblastomas: Clinical Evidence and Current Approach,” Current Neurology and Neuroscience Reports, vol. 15, no. 2. 2015. N. Sanai, M.-Y. Polley, M. W. McDermott, A. T. Parsa, and M. S. Berger, “An extent of resection threshold for newly diagnosed glioblastomas: clinical article,” J. Neurosurg., vol. 115, no. 1, pp. 3–8, 2011. M. Izadyyazdanabadi et al., “Convolutional Neural Networks: Ensemble Modeling, Fine-Tuning and Unsupervised Semantic Localization,” arXiv Prepr. arXiv1709.03028, 2017. M. Izadyyazdanabadi et al., “Improving utility of brain tumor confocal laser endomicroscopy: Objective value assessment and diagnostic frame detection with convolutional neural networks,” in Progress in Biomedical Optics and Imaging - Proceedings of SPIE, 2017, vol. 10134. V. N. Murthy, V. Singh, S. Sun, S. Bhattacharya, T. Chen, and D. Comaniciu, “Cascaded deep decision networks for classification of endoscopic images,” no. February 2017, p. 101332B, 2017. H. Qi, S. Collins, and A. Noble, “Weakly Supervised Learning of Placental Ultrasound Images with Residual Networks,” in Annual Conference on Medical Image Understanding and Analysis, 2017, pp. 98–108. B. Zhou, A. Khosla, A. Lapedriza, A. Oliva, and A. Torralba, “Learning deep features for discriminative localization,” in Proceedings of the IEEE Conference on Computer Vision and Pattern Recognition, 2016, pp. 2921–2929. B. Korbar et al., “Looking Under the Hood: Deep Neural Network Visualization to Interpret WholeSlide Image Analysis Outcomes for Colorectal Polyps,” in Computer Vision and Pattern Recognition Workshops (CVPRW), 2017 IEEE Conference on, 2017, pp. 821–827. R. R. Selvaraju, M. Cogswell, A. Das, R. Vedantam, D. Parikh, and D. Batra, “Grad-CAM: Visual Explanations from Deep Networks via Gradient-based Localization,” See https//arxiv. org/abs/1610.02391 v3, 2016. W. M. Gondal, J. M. Köhler, R. Grzeszick, G. A. Fink, and M. Hirsch, “Weakly-supervised localization of diabetic retinopathy lesions in retinal fundus images,” arXiv Prepr. arXiv1706.09634, 2017. H. Sailem, M. Arias--Garcia, C. Bakal, A. Zisserman, and J. Rittscher, “Discovery of Rare Phenotypes in Cellular Images Using Weakly Supervised Deep Learning,” in Proceedings of the IEEE Conference on Computer Vision and Pattern Recognition, 2017, pp. 49–55.
8
9
12. 13.
14.
15. 16. 17. 18. 19.
K. Simonyan, A. Vedaldi, and A. Zisserman, “Deep inside convolutional networks: Visualising image classification models and saliency maps,” arXiv Prepr. arXiv1312.6034, 2013. X. Feng, J. Yang, A. F. Laine, and E. D. Angelini, “Discriminative localization in CNNs for weaklysupervised segmentation of pulmonary nodules,” in International Conference on Medical Image Computing and Computer-Assisted Intervention, 2017, pp. 568–576. N. L. Martirosyan et al., “Prospective evaluation of the utility of intraoperative confocal laser endomicroscopy in patients with brain neoplasms using fluorescein sodium: experience with 74 cases,” Neurosurg. Focus, vol. 40, no. 3, p. E11, 2016. S. Foersch et al., “Confocal laser endomicroscopy for diagnosis and histomorphologic imaging of brain tumors in vivo,” PLoS One, vol. 7, no. 7, p. e41760, 2012. E. Belykh et al., “Intraoperative fluorescence imaging for personalized brain tumor resection: Current state and future directions,” Front. Surg., vol. 3, 2016. J. Eschbacher et al., “In vivo intraoperative confocal microscopy for real-time histopathological imaging of brain tumors: Clinical article,” J. Neurosurg., vol. 116, no. 4, pp. 854–860, 2012. B. J. Baars and N. M. Gage, Cognition, Brain and Consciousness. 2010. Y. Jia et al., “Caffe: Convolutional Architecture for Fast Feature Embedding,” arXiv Prepr. arXiv1408.5093, 2014.