International Conference on Computing, Communication and Automation (ICCCA2016)
Web Application’s Performance Testing Using HP LoadRunner and CA Wily Introscope Tools Rijwan Khan
Mohd Amjad
Department of Computer Engineering Jamia Millia Islamia, Jamia Nagar New Delhi, INDIA
[email protected]
Department of Computer Engineering Jamia Millia Isamia, Jamia Nagar New Delhi, INDIA
[email protected]
Abstract—This paper cover the importance of performance testing of the web application. The performance of any web application has been depend on the some different type of the testing process like load testing, soak testing, smoke testing and stress testing etc. In this paper we applied smoke testing on a web application. This web application has been developed for the customer before delivering the software to the customer it is duty of tester to test all the aspects of the software and deliver error free and reliable software to the customer. Reliability has its own most important role in the software industry. In this paper performance testing has been performed using HP LoadRunner and CA Wily Introscope tools.
otherquality attributes of the system, such as scalability, reliability and resource usage.
Keywords—Software Testing; Perforamance Testing; Load Testng; HP LoadRunner; Wily Introscope Tools
• Endurance testing–In Endurance is has been checked that the software can handle the expected load over a long period of time.
I.
INTRODUCTION
Application performance testing is a means for insuring quality of the software i.e. quality assurance (QA). The performance testing will insure that the web application is working well under their expected workload. An application perform under its response time and up to expected load it has been checked. There are not only some concerns of the performance testing like functionality of function etc. The goal of the performance testing not to find the bugs in the application and fixed them but to eliminate the performance bottlenecks. The performance testing is checked a web application under the criteria like speed, scalability and stability. In the speed tester determine whether the software responds quickly or not. In scalability the tester determine that the software application can handle the maximum user load and in stability it has been determined that the application is stable under the varying loads [1,7]. Performance testing is a process to inform the customer regarding their software speed, scalability and stability. Performance testing come in light when some of these unexpected causes are coming such as: the software application running slow when the number of the uses are increase, inconsistencies on the different operating systems. It also checked that the application will meets its speed as we want, its scalability and stability requirements under expected workloads.Performance testing is in general testing performed to determine how a system performs in terms of Responsiveness and stability under a particular workload. It can also serve to investigate measure, validate or verify
ISBN:978-1-5090-1666-2/16/$31.00 ©2016 IEEE
II.
TYPES OF SOFTWARE TESTING
• Load testing–In load testing the application has been checked under anticipated user load. The main aim of this testing is test all the bottlenecks before delivering the software to the customer. • Stress testing– In stress testing the web application checked under extreme workloads to see the breaking point of an application.
• Spike testing–When sudden large spikes in the load generated by users then spike testing is used. • Volume testing–In this type of testing a large number of data has been stored in the database and the overall web applications behaviour is observed. The main objective of this type of testing is to check the correctness of the application under varying database volumes. • Scalability testing–Scalability testing is used to check the load for increasing the number of user for an application. It helps us for increasing the capacity of software system. • Smoke testing - After Test sets/Load profile created, a ‘Smoke or Sanity tests’ on the scripts will be executed to ensure if the scripts and the application configuration are done correctly. This is must for any kind of performance test. This will be planned for a week. Any defects identified in the dryrun will be fixed during this phase. Smoke test or sanity tests are run with 1 user for each script for the first time. If everything looks good, then actual workload is incorporated to see whether the application is stable under pre-defined load. If everything goes fine, then actual load and other performance tests like Soak, Failover, Breakdown testing is performed. III.
INTRODUCTION OF SOFTWARE TESTING TOOLS
In this paper two software tools are used for performance testing. These two tools are HP LoadRunner and CA Wily Introscope.
802
International Conference on Computing, Communication and Automation (ICCCA2016) A. HP LoadRunner HP LoadRunner is a software testing tool from HewlettPackard launched in 2006. HP LoadRunner is tool which used for load performance of application, measuring system behaviour. It is a very powerful tool which simulate thousands of user concurrently using application software, and store the performance of the web application and later analysed the performance of different part of the applications. LoadRunner is a good tool which simulates user activity by generating messages between application components rather than simulating interactions with the user interface such as keypresses or mouse movements. The messages which are generated during load checked is written as test script. LoadRunner can generate the scripts by recording them, such as logging HTTP requests between a client web browser and an application's web server. The key component of HP LoadRunner are:
Load Generator
Virtual User Generator
Controller
Agent Process
Analysis
Errors Rate vs. Load on the system.
Degradation of response times with load on the system.
B. Test Cases and Load Distribution The production support and development persons will provide all the required Test data for scripting and testing the business Scenarios. The detailed list of Test Scenarios & corresponding load distribution is given in table 1 and table 2 respectively. TABLE I Business Function Name Login Logout
Add Payee
B. CA Wily Introscope Nowadays all the industries are going to online so they relies on good web applications for their business. The success or failure of the business depends on the online application of the business how fast it is and how much time it take to complete customer’s tasks. It also depends on the solutions of all the problems to be fix in a minimum time. In web application environment it is more difficult to solve the issues came during the operations of the web application. As business grows the most complex problems came in the limelight so testing need a real time intelligence system to vigilance of the web application performance and should have a quality to find the cause of failure of the web application quickly. CA Wily Introscope is a tool which vigilance 24 hours all the days on the web application in the production environment. With the use of CA wily Introscope tool testers easily resolve all the errors came during access of web application. IV.
Check Balance
Amount Transfer
EXPERIMENTAL SETUP
Once the scripts are ready we need to upload it in Load Generator and create scenarios with appropriate workload that has been decided and then we need to perform the testing. A. Analysis Test Report Once every test is completed, the logs and results are collected from the controller machine. The report is prepared with following:
View Account Statement
LoadRunner Analysis Reports
Transaction Response Time.
Transaction Pass/Failed.
Throughput (Kilobytes/sec).
803
TABLE FOR TEST CASES User Steps(Brief description of the steps a user would follow o perform the business function in chronological order) 1. Launch application with given URL and User data. 2. Login into the Application using the User Data. 3. Logout the application. 1. Launch application with given URL and User data. 2. Login into the Application using the User Data. 3. Click on Payments Tab available on top of the screen. 4. Enter account, Name, IFSC Code and other details. 5. Click on Add Button. 6. Click on Verify. 7. Enter the Verification code and then click on Verify. 8. Click on submit button. 9. Logout the application. 1. Launch application with given URL and User data. 2. Login into the Application using the User Data. 3. Click on Payments Tab available on top of the screen. 4. Click the Check Balance Button. 5. Select the Saving Account. 6. Logout the application. 1. Launch application with given URL and User data. 2. Login into the Application using the User Data. 3. Click on Payments Tab available on top of the screen. 4. Click on Make a Payment. 5. Select the Account from which you want to pay. 6. Select the Account to whom you want to pay. 7 Click on submit button. 8. Enter the Verification code and then click on Verify. 9. Click on submit button. 10. Logout the application. 1. Launch application with given URL and User data. 2. Login into the Application using the User Data. 3. Click on Payments Tab available on top of the screen. 4. Click on View Statement. 5. Select the format and Period in which you
International Conference on Computing, Communication and Automation (ICCCA2016)
Credit Payment
want the statement. 6 Click on submit button. 7. Enter the Verification code and then click on Verify. 1. Launch application with given URL and User data. 2. Login into the Application using the User Data. 3. Click on Billpay and Recharge Tab available on top of the screen. 4. Click on Continue. 5. Select the Biller whose bill you want to pay. 6. Select the Amount option to pay. 7 Click on submit button. 8. Logout the application.
Card
Add Payee
Below Transactions have to be achieved in 1 hour steady state (excluding Users ramp up and rampown) TABLE II
TABLE FOR WORKLOAD DISTRIBUTION
Business functions Login Logout Add Payee Check Balance Amount Transfer View Account Statement Credit Card Payment
Check Balance
Transaction to achieved per hour 400 160 100 400 200 400
Below table depicts the number of user information that would be used for each business functionalities. TABLE III
TABLE FOR VIRTUAL USERS
Business functions Login Logout Add Payee Check Balance Amount Transfer View Account Statement Credit Card Payment TABLE IV
Number of Virtual Users 50 40 20 100 50 100
Amount Transfer
TABLE FOR HARDWARE AND SOFTWARE REQUIRE FOR TESTING
Hardware Processor: Pentium Dual 4.1 GHz. RAM: 8 GB CPU Count: 4
IV
V.
Software Load Agent software should be installed in identified Load Generator Machines
SMOKE RUN
All the tables for the smoke run is given below for a bank based web application. TABLE V Functionality Login Logout
TABLE FOR SMOKE TEST
Transac tion Name Lunch
Avr Resp Time 3.21
Pass
Fail
1306
1
Login Logout UC01_C lickOnP aymentT ab
2.1 1.2 3.2
1305 1305 170
0 0 0
View Account Statement
Failure %age 0.07651 1094 0 0 0
804
UC01_E nterAcco untDetai ls UC01_C lick_Ad dButton UC01_C lick_Ver ify UC01_C lickVerif yOTP UC01_C lick_Sub mit UC02_C lickOnP aymentT ab UC02_C lickChec kBalanc eButton UC02_S electSavi ngAccou nt UC03_C lickOnP aymentT ab UC03_C lickMak eApaym en UC03_S electPay eeAccou nt UC03_S electDep ositAcco unt UC03_C lick_Sub mit UC03_C lickVerif yOTP UC04_C lickOnP aymentT ab UC04_C lickView Stateme nts UC04_S electPeri od UC04_C lickSub mit UC04_C lickVerif y UC05_C lickBillp ay
3.32
168
2
1.17647 0588
1.3
166
2
1.19047 619
1.2
166
0
0
1.5
166
0
0
1.9
166
0
0
2.9
110
0
0
2.4
105
5
4.54545 4545
3.4
105
0
0
2.6
410
0
0
2.8
408
2
0.48780 4878
0.234
408
0
0
0.25
408
0
0
1.2
408
0
0
1.4
407
1
0.24509 8039
1.9
205
0
0
2.1
204
1
0.48780 4878
2.6
202
2
0.98039 2157
3.2
202
0
0
2.5
202
0
0
1.6
410
0
0
International Conference on Computing, Communication and Automation (ICCCA2016)
Credit Card Payment
UC05_C ontinue UC05_S electBill er UC05_S electAm ount UC05_C lickSub mit
0.4
409
1
2.5
408
1
2.2
408
0
0
3.8
406
2
0.49019 6078
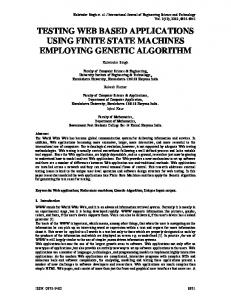
the performance testing. Hits per second, as the name suggests is the hits received by the servers in a second. The amount of hits in a second is highly fluctuating and once all the users completely ramped up then thepattern becomes stable.
0.24390 2439 0.24449 8778
A. Analysis of Smoke Test In the below graph we can see the 360 users ramping up. We ran with 360 users that is the full load so that we can also see if it is achieving the expected load per hour or not. All the users are completely ramped up into the application in 6 hours. The users were able to ramp up without any issues and then it ran for another 2 hours.
Fig 3. Hits Per Second Grarph
B. Smoke Test Wily Report Given below reports are generated by the Wily Introscope tool.
Fig1. Running Vuser Graph Fig 4. Garbage Collection
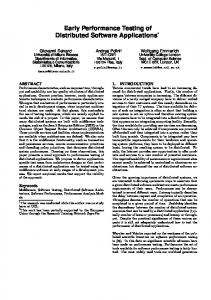
This graph displays the amount of throughput (in megabytes) on the Web server during the load test. Throughput represents the amount of data that the VUsers received from the server at any given second. This graph helps you to evaluate the amount of load VUsers generate, in terms of server throughput. Throughput represents the amount of data that the Vusers received from the server at any given second. This graph helps you to evaluate the amount of load Vusers generate, in terms of server throughput. The below mentioned graph shows how stable the test remained throughout as there were no peaks or spikes during the smoke test period. Below graph highlight the amount of bytes returned by the server during the course of smoke test. It can be seen when the users were getting ramped up into the application, the amount of bytes returned by the server is highly fluctuating and once all the users completely ramped up then the THROUGHPUT becomes stable.
Fig 5. Web Container
Fig 6. Web CPU
VI. Fig 2. Throughput
CONCLUSION
The smoke test went fine and was successfully executes without any issues with respect to average response times or pass/fail percentages. With the use of the HP Loadrunner and Wily Interscope tool the smoke testing performed in proper
The hits per second graph shows the consistency with the throughput graph which is a very good sign when dealing with
805
International Conference on Computing, Communication and Automation (ICCCA2016) way compare to the other tool of performance testing. Actual load test was calculated under the virtual clients. With these virtual clients it has been found that the load testing was running correctly. Other performance testing like soak testing, stress testing can also be done with these software testing tools.
[7]
[8]
[9]
REFERENCES [1]
[2] [3] [4] [5]
[6]
[10]
Zhu, Kunhua, Junhui Fu, and Yancui Li. "Research the performance testing and performance improvement strategy in web application." 2010 2nd International Conference on Education Technology and Computer. Vol. 2. 2010. Beizer, Boris. Black-box testing: techniques for functional testing of software and systems. John Wiley & Sons, Inc., 1995. Beizer, Boris. Software testing techniques. Dreamtech Press, 2003. Hetzel, William C., and Bill Hetzel. The complete guide to software testing. John Wiley & Sons, Inc., 1991. Kuhn, D. Richard, Dolores R. Wallace, and Albert M. Gallo Jr. "Software fault interactions and implications for software testing." Software Engineering, IEEE Transactions on 30.6 (2004): 418421. Verbauwhede, Ingrid, Patrick Schaumont, and Henry Kuo. "Design and performance testing of a 2.29-GB/s Rijndael processor." Solid-State Circuits, IEEE Journal of 38.3 (2003): 569-572.
[11]
[12]
[13]
806
Weyuker, Elaine J., and Filippos I. Vokolos. "Experience with performance testing of software systems: issues, an approach, and case study." IEEE transactions on software engineering 12 (2000): 11471156. Ward, C. L., et al. "Design and performance testing of quantitative real time PCR assays for influenza A and B viral load measurement." Journal of Clinical Virology 29.3 (2004): 179-188. Menascé, Daniel. "Load testing of web sites." Internet Computing, IEEE 6.4 (2002): 70-74. Zhao, Nai Yan, and Mi Wan Shum. "Technical Solution to Automate Smoke Test Using Rational Functional Tester and Virtualization Technology."Computer Software and Applications Conference, 2006. COMPSAC'06. 30th Annual International. Vol. 2. IEEE, 2006. DeMillo, Richard A., et al. "An extended overview of the Mothra software testing environment." Software Testing, Verification, and Analysis, 1988., Proceedings of the Second Workshop on. IEEE, 1988. Khan, Rijwan, and Mohd Amjad. "Automatic Generation of Test Cases for Data Flow Test Paths Using K-Means Clustering and Generic Algorithm.”International Journal of Applied Engineering Research 11.1 (2016): 473-478. Mahajan, Manish, Sumit Kumar, and Rabins Porwal. "Applying genetic algorithm to increase the efficiency of a data flow-based test data generation approach." ACM SIGSOFT Software Engineering Notes 37.5 (2012): 1-5.