Available online at www.isas.org.in/jisas
JOURNAL OF THE INDIAN SOCIETY OF AGRICULTURAL STATISTICS 68(1) 2014 93-100 Web based Fuzzy C-means Clustering Software (wFCM) Alka Arora1, Maedeh Zirak Javanmard1, Rajni Jain2, Sudeep Marwaha1 and Anshu Bharadwaj1 1 Indian Agricultural Statistics Research Institute, New Delhi 2 National Centre for Agricultural Economics and Policy Research, New Delhi Received 22 February 2013; Revised 30 September 2013; Accepted 19 November 2013 SUMMARY Fuzzy c-means is a well-known fuzzy clustering algorithm in literature. It allows objects to belong to several clusters simultaneously with different degrees of membership. Considering the importance of fuzzy clustering, web based software has been developed to implement fuzzy c-means clustering algorithm (wFCM). wFCM is a freely accessible web based software package for clustering datasets based on fuzzy c-means clustering algorithm. This software is completely menu driven and presents user-friendly GUI which is developed to minimize efforts in using the software. User can upload data to wFCM using different formats of Excel and CSV file. Results can be visualized in graphical format and can be downloaded in excel and PDF format. The results obtained from the software were compared with standard Software R and observed to be better in terms of evaluation parameters. This software will be useful for statisticians, researchers, students and teachers for clustering datasets from agricultural research as well as many diverse areas of other sciences. Keywords: Web based software, Fuzzy clustering, Fuzzy c-means algorithm, wFCM.
1. INTRODUCTION Clustering deals with segmentation of data into groups (clusters) such that similar data objects belong to the same cluster and dissimilar data objects to different clusters. The resulting data partition improves data understanding and reveals its internal structure. There are many clustering algorithms available in literature to divide dataset into clusters (Mirkin 2005). Partitional clustering techniques deal with segmenting a dataset into disjoint (crisp) clusters. K-means is a popular partitional algorithm in which each data point in the dataset is assigned to only one cluster. However, at times it is difficult to draw crisp boundaries between clusters, in those situations fuzzy clustering is often better suited for the data. Fuzzy clustering allows objects to have degrees of membership in different
Corresponding author: Alka Arora E-mail address :
[email protected]
clusters as compared to partitional clustering (Ross 2004). Fuzzy c-means is a popular fuzzy clustering algorithm developed by Bezdek (1981). Agriculture sector has many applications of fuzzy c-means algorithm. Some applications are Forecasting risky area in the case of forest fire Iliadis (2010), Automatic segmentation of relevant textures in agricultural images Rahimi (2004), Determination of management zones for a tobacco field based on soil fertility Guijarro (2011), Application of multivariate geo-statistics in delineating management zones within a gravely vineyard using geo-electrical sensors XinZhong (2009), Evaluate survey data from olive grove cultivation Morari (2009), Real-time recognition of sick pig cough sounds Delgado (2009), Delineation of sitespecific management zones Exadaktylos (2008),
94
Alka Arora et al. / Journal of the Indian Society of Agricultural Statistics 68(1) 2014 93-100
Individual leaf extractions from young canopy Li (2007), Detecting crime hot-spots or geographic areas of elevated criminal activity Neto (2006), Delineating productivity zones on clay pan soil fields using apparent soil electrical conductivity Grubesic (2006), Mapping clay content variation using electromagnetic induction techniques Kitchen (2005), and Classifying plant, soil, and residue regions of interest from color images Triantafilis (2005). However availability of software based on Fuzzy c-means algorithm is limited. There are different kinds of software available to carry out clustering. Majority of the software are either proprietary or stand alone and require to be installed and the users need to learn the functionality of the system. Among these are KNIME; developed by the Chair for Bioinformatics and Information Mining at the University of Konstanz, Germany (http://www. knime.org), wCLOTU, developed at University of Minnesota Rasmussen (2003); Clustering using Go Fuzzy C-means Algorithm (CLuFA) Tari (2009). These software are specific to clustering data related to bioinformatics and gene expression data. Another set of packages like WEKA, developed at the University of Waikato in New Zealand Holmes (1994); Fuzzy Logic Toolbox in Matlab Kenesei (2006); R software (http:// cran.r-project.org/); SAS Enterprise Miner http:// www.sas.com/technologies/analytics/datamining/miner/ etc. provide functionality for clustering and fuzzy clustering but these softwares are not web based. User needs to first install and then use these systems which require some technical knowledge for installation and also learning the syntax for using the system. One interactive demo site is available which demonstrates the fuzzy clustering functionality http:// home.deib.polimi.it/matteucc/Clustering/tutorial_html/ AppletFCM.html but user cant upload its own data to perform fuzzy clustering. Another web based attempt has been made for fuzzy clustering using JSP technology Simon (2006) but as claimed by the authors, user needs to type in the input data on screen and save the obtained results in different format is listed in the future scope. Based on this literature survey, we observed that majority of the software lack in providing either of these important features like (i) fuzzy c-means algorithm, (ii) web based availability, (iii) free of cost, (iv) support of different data formats for data input and output and (v) graphical representation of solution.
Keeping these points in mind, a web based software for fuzzy c-means clustering algorithm (wFCM) is developed by the authors. wFCM is a user friendly software for fuzzy c-means clustering algorithm. Users are expected to be statisticians, researchers, students and teachers who are not having much exposure for installation of the software and writing scripts and codes in a program to be used for clustering. Therefore in wFCM users are released from the burden of downloading, installing and dealing with the issues like incompatibility of hardware and writing scripts or macros. It is web based software which can be accessed using the default browser of the user system. This paper makes an attempt to explain the functionality and features of the software and develops interest and insight for fuzzy c-means clustering algorithm using the software. The paper also explains knowhow of the software. The rest of the paper is organised as follows. Section 2 presents the fuzzy c-means clustering approach. Section 3 presents the software design and development methodology. Section 4 presents functionality of wFCM software followed by conclusion. 2. FUZZY C-MEANS CLUSTERING APPROACH (FCM) Fuzzy c-mean algorithm is a well known fuzzy clustering algorithm developed by Bezdek (1981), which allows objects to have degree of membership in multiple clusters. Let X is a sample set of n data objects; where each data object xi are described by m' features. So X can be defined as X = {x1, x2, x3, ..., xn). Ai is defined as set of c -clusters. Each data object such as xi may belong to one or more clusters depend on its degree of membership. Membership value for kth data object in the ith cluster is defined with µik ∈ [0, 1]. Objective function Jm is used to determine the fuzzy cpartition matrix U; which includes membership value of data points in all clusters. n
c
J m (U , v) = ∑∑ (µik ) ~
k =1 i =1
m
(dik )2
Alka Arora et al. / Journal of the Indian Society of Agricultural Statistics 68(1) 2014 93-100
where l
l
l
µik is the membership of the kth data object in the ith cluster. m is called a weighting parameter. This value has a range m∈[1, ∞). This parameter controls the amount of fuzziness in the clustering process.
95
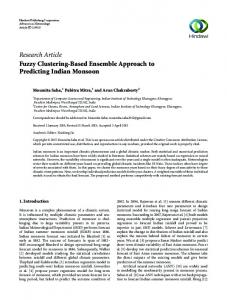
to the functionality and later on integrated. System flow which shows the interaction of user with the system has been presented in the hierarchical structure chart (Fig. 1).
dik is the Euclidean distance between kth data point and ith cluster center.
At the beginning of the process µik is initialized for each data point with some prototype values that gets updated during the process with the following formula c dik 2 /( m−1) µik = ∑ j =1 d jk
−1
Clustering of dataset requires finding the centre of each cluster and deciding to which cluster each point belongs to. In FCM, centre of a cluster is calculated by Fig. 1. Hierarchical Structure of wFCM Design
n
vij =
∑ µikm .xkj k =1 n
∑ µikm
3.2 wFCM Development Methodology
.
k =1
The steps of fuzzy c-means algorithm are as follows. Each iteration in this algorithm is labelled as r (Ross 2004). Step 1: Initialize the partition matrix U(0), number of clusters c and value for fuzzification parameter m.
wFCM has been designed and developed as per standard three-tier architecture of web application development (Arora 2008, Jain 2013). The wFCM application has been developed using Microsoft Visual Studio 2008 integrated development environment (IDE) Randolph (2008) as it provides support for easy application development, debugging and deployment. l
Step 2: Calculate the c cluster centers
vi( r )
for each
This Layer is implemented using combination of HTML (Hyper Text Markup Language), jQuery, JavaScript and CSS (Cascading Style Sheets).
iteration. Step 3: Update the partition matrix U(r). Step 4: If U ( r +1) − U ( r ) ≤ ε , stop; otherwise set r = r + 1 and return to step 2.
l
wFCM is a web based user friendly software. Software engineering practices and design based on waterfall development model are adopted for the development of this software. The coding for wFCM was broken down into different modules/classes related
Layer 2: Application layer ASP.NET 3.5 and .NET framework is used for building dynamic and interactive web pages in application layer. C# language is used for coding the business logic in ASP.NET.
3. WFCM DESIGN AND DEVELOPMENT METHODOLOGY 3.1 System Design
Layer 1: User Interface layer
l
Layer 3: Database layer Database Layer is implemented using SQL Server 2008 to store only user information. Database connectivity has been done with ADO.NET which provides improved support for the disconnected programming model.
96
Alka Arora et al. / Journal of the Indian Society of Agricultural Statistics 68(1) 2014 93-100
4. WFCM FUNCTIONALITY
4.1 Data Input Handling
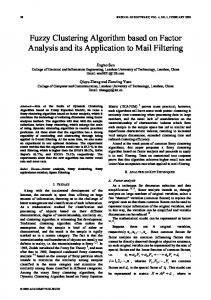
wFCM is a web based software and is hosted at the address http://proj.iasri.res.in/wfcm/. User can access the software through internet. In order to maintain a log of different users, wFCM requires user login or registration. User can only access the system after entering authentic username and password. Login page (Fig. 2) of the software presents a login window to enter username and password. After authentication, user is redirected to clustering page (Fig. 3). Options
The Data upload menu has been designed and developed for reading data for wFCM. User can upload their input data to wFCM using different formats; Excel and CSV file. Separate sub menu is provided for each of these formats. 4.1.1 Upload Excel File Once Excel File sub menu is clicked, a page will open which contain Browse button for browsing the excel file from users local system (Fig. 4). The actual data will be uploaded when the user clicks the Upload button. Data sheet that contains data to be clustered should be selected from the drop down list. Few
Fig. 2. Login Page
Fig. 4. Upload Excel File
verification steps are incorporated in software before performing actual analysis. These steps are: l
l l
l
4.1.2 Fig. 3. Home Page
for Home, Data Upload, Clustering, Visualization, Sample Data, Contact Us and Help are available in the menu bar. User has to first upload the data file and then Clustering, Visualization tab will be activated. With click on any tab, relevant page will be displayed and after completion of a desired task, user can return to the home page for other activities or logout.
l
Selection of particular sheet from total sheet present with data to be analysed Displays basic statistics of dataset Data presentation, as from excel sheet for verification, with paging and pages will increase proportionally with amount of data uploaded Selection of parameter required for actual analysis Upload CSV Filea wFCM supports CSV files with comma delimiters. Steps for uploading CSV file are same as Excel file.
4.2 Clustering Clustering is the core module of wFCM for fuzzy c-means clustering. Once a dataset has been uploaded, user can select Clustering menu on home page and this will redirect the control to the corresponding clustering page (Fig. 5).
Alka Arora et al. / Journal of the Indian Society of Agricultural Statistics 68(1) 2014 93-100
User has to select various parameters which are required for fuzzy c-means clustering. The accuracy of using FCM mainly depends on adapting the input parameter values Ross (2004). These parameters include the Number of clusters, Fuzzy parameter, Maximum Iteration and Precision. Default values for these parameters are set in the system which can be modified by the user. Brief guide on these parameters is also provided to help the user in selecting the configuration data (Fig. 5).
l
l
l
l
l
Fig. 5. Clustering page
User can select the attributes from the list of attributes present in the excel file. wFCM provides this facility through Select Attributes frame box (Fig. 5). Multiple attributes can be selected from the left side and inserted into list boxes in right by clicking corresponding buttons. Small help corresponding to each parameter is given along the box. Validation controls along with appropriate warning message facilitate data entry and selection of various parameters in the software. After selection of attributes and parameters, fuzzy clustering is invoked by a click on Fuzzy C-means Clustering button. Initial step in fuzzy clustering requires assigning partial membership for each data objects in different clusters. Hence membership matrix needs to be initialized. Membership value for each data object should satisfy the following rules: l l
Loop (no. of clusters) will calculate membership value of objects in different cluster. Whatever value will be in numRange variable, that many objects is assigned membership value 1 in the first cluster. For next cluster, value of numRange variable will be multiplied with cluster number and next objects corresponding to that number will be in that particular cluster and so on. The rest of the data objects will have membership value 1 in the last cluster. Once the initial membership values is computed, fuzzy clustering algorithm is applied as given in section 2.
4.3 Data Output Handling l
l
l
l
FCM displays the clustering solution at three levels of abstraction (Fig. 6). A brief summary is displayed which includes, clustering method, distance matrix, name of file and number of cluster. Table-view of number of objects belonging to each cluster. Table-view of the actual dataset that has been clustered including additional columns for cluster index that each particular object belongs to and membership value of each particular object in all the generated clusters.
For users future reference, wFCM provides the facility to download the results in Excel and PDF
Membership can take value in the range of [0,1]. Sum of all membership values for a single data object in all of the clusters has to be 1.
The algorithmic logic for implementing the initial membership value in wFCM is as follows: Create a 2-dimention (c*n) dynamic array. l
l
Divide number of data objects (n) in to number of clusters (c). Divide (n/c) and save the integer portion of the calculated value in numRange variable.
97
Fig. 6. Clustering Results
98
Alka Arora et al. / Journal of the Indian Society of Agricultural Statistics 68(1) 2014 93-100
formats. User can download clustering solution with click on Export to Excel and Export to PDF buttons in its local system. 4.3.1
Visualization
wFCM provides the functionality for visualizations of clustering solution. Dynamic 3D point chart, which is a control supported with ASP.NET is used for graphical representation of results. This functionality is available with the click of button View chart FOR CLUSTER SOLUTION (Fig. 7). Each of the clusters is represented with different colors.
dataset a good example to explain and test fuzzy clustering. In order to verify the results, fuzzy c-means clustering analysis was done in R software which is standard software and widely used for analysis. Results obtained through the wFCM for Iris dataset is compared with the results carried out in R software (Table 1, 2). Table 1. Fuzzy c-means clustering result in R software, Iris dataset Class
Cluster 1
Cluster 2
Cluster 3
Iris Setosa
50
0
0
Iris Versicolor
0
46
4
Iris Virginica
0
13
37
Table 2. Fuzzy c-means clustering result in wFCM, Iris dataset Class
Fig. 7. Visualisation page
Feature of visualization of data points based on available attributes is also present in the system. This gives the flexibility to user to view the data distribution among attributes. This can be displayed by click on View chart FOR DATA POINT (Fig. 7). 4.4 Testing and Debugging After development of different modules, these were integrated and software has been tested and validated. wFCM has been tested using popular Iris dataset from UCI Machine Learning Repository Blake (1998). This dataset contains 150 objects from Iris Setosa, Iris Versicolor and Iris Virginica categories with 50 data objects each. Each data object is described with four features: sepal length, sepal width, petal length and petal width. The class Iris setosa species is linearly separable from the other two classes, while Iris virginica and Iris versicolor and are not linearly separable from each other in their original clusters. This makes Iris
Cluster 1
Cluster 2
Cluster 3
Iris Setosa
50
0
0
Iris Versicolor
0
46
4
Iris Virginica
0
8
42
Class attribute is considered only to check the accuracy of obtained results, however it was not used in clustering. In this example, the values for parameters are selected as given below: l
Number of clusters = 3
l
Fuzzy parameter = 2
l
Maximum Iteration =1000
l
Precision = 0.00001
From the results, it is clear that Iris Setosa is visible as a separate cluster with 100% accuracy in both the softwares. Iris Versicolor category is visible in both softwares in cluster 2 with 92% accuracy. Iris Virginica category is present as cluster 3 with 74% accuracy in R software and 84% accuracy in wFCM software. Thus results of Fuzzy c means clustering algorithms in developed software are comparable and even better to existing methods available in standard software like R. Additionally, the developed software relieves the user from writing codes and scripts.
Alka Arora et al. / Journal of the Indian Society of Agricultural Statistics 68(1) 2014 93-100
5. CONCLUSION wFCM will be beneficial to the users interested in carrying out fuzzy c-means clustering. wFCM is completely menu driven and offers user-friendly screens organized and well arranged for users. System has been developed using ASP.NET technology and C# has been used for writing business logic. User has been given the option for uploading data to wFCM and download results in Excel and PDF format. At the same time, user can graphically visualize the data objects and clustering results. The software has been tested and validated using benchmarking dataset and observed to be having good performance.
99
segmentation of relevant textures in agricultural images. Compu. Elect. Agric., 74(1), 75-84. Grubesic, T.H. (2006). On The Application of Fuzzy Clustering for Crime Hot Spot Detection. J. Quant. Criminology, 22(1). George, E.M., Camargo, J.N., David D.J. and Hindman, T.W. (2004). Intensified fuzzy clusters for classifying plant, soil and residue regions of interest from color images. Compu. Elect. Agric., 42, 161-180. Höppner, F., Klawonn, F., Kruse, R. and Runkler, T. (1999). Fuzzy Cluster Analysis. Wiley, Chichester.
ACKNOWLEDGEMENTS
Holmes, G., Donkin, A. and Witten, I.H. (1994). WEKA: A Machine Learning Workbench. In: Proceedings of the Second Australian and New Zealand Conference on Intelligent Information Systems, 357-361. Software, available at: http://www.cs.waikato.ac.nz/~ml/.
The authors would like to acknowledge the valuable comments and suggestions of the Associate Editor and the referee. These led to a considerable improvement in the paper.
Iliadis, L., Vangeloudha, M. and Spartalisb, S. (2010). An intelligent system employing an enhanced fuzzy c-means clustering model, Application in the case of forest fires. Compu. Elect. Agric., 70, 276-284.
REFERENCES Arora, A., Sharma, S.D., Malhotra, P.K. and Goyal, R.C. (2008). Agricultural Statistician Network (ASN). J. Ind. Soc. Agril. Statist., 62(1), 49-55. A Tutorial on Clustering Algorithms available at (http:// home.deib.polimi.it/matteucc/Clustering/tutorial_html/ AppletFCM.html). Bezdek, J.C. (1981). Pattern Recognition with Fuzzy Objective Function Algorithms. Plenum Press, New York. Berthold, M.R., Cebron, N., and Dill, F. KNIME: The Konstanz Information Miner. available at http:// www.knime.org. Blake, C. and Merz, C. (1998). UCI repository of machine learning databases. University of California, Irvine, Dept. of Information and Computer Sciences, available at http:/ /www.ics.uci.edu/~mlearn/. Delgado, G., Aranda, V., Calero, J., Sánchez-Marañón, M., Serrano, J. M., Sánchez, D. and Vila, M. A. (2009). Using fuzzy data mining to evaluate survey data from olive grove cultivation. Compu. Elect. Agric., 65(1), 99-113. Exadaktylos, V., Silva, M., Aerts, J.M. , Taylor, C.J. and Berckmans D. (2008). Real-time recognition of sick pig cough sounds. Compu. Elect. Agric., 63(2), 207-214. Guijarro, M., Pajares, G., Riomoros, I., Herrera, P.J., BurgosArtizzu, X.P. and Ribeiro, A. (2011). Automatic
Jain, Rajni, Satma, M.C., Arora, Alka, Marwaha, Sudeep and Goyal, R.C. (2013). Online Rule generation software process model. BVICAMs Intern. J. Inform. Tech., 5(1), 505-511. Kitchen, N.R., Sudduth, K.A., Myers, D.B., Drummond, S.T. and Hong, S.Y. (2005). Delineating productivity zones on claypan soil fields using apparent soil electrical conductivity. Compu. Elect. Agric., 46(1-3), 285-308. Kenesei, T., Balasko, B. and Abonyi, J. (2006). A MATLAB Toolbox and its Web based Variant for Fuzzy Cluster Analysis. 7th International Conference of Hungarian Researchers on Computational Intelligence, Budapest. Available at: www.mathworks.com/fileexchange. Li, Y., Shi, Z., Li, F. and Li, Hong-Yi. (2007). Delineation of site-specific management zones using fuzzy clustering analysis in a coastal saline land. Compu. Elect. Agric., 56(2), 174-186. Mirkin, B. (2005). Clustering for Data Mining: Data Recovery Approach. Chapman and Hall, CRC. Morari, F., Castrignanò, A. and Pagliarin,C. (2009). Application of multivariate geostatistics in delineating management zones within a gravelly vineyard using geoelectrical sensors. Compu. Elect. Agric., 68(1), 97-107. Neto, J., Meyer, G. and Jones, D. (2006). Individual leaf extractions from young canopy images using Gustafson Kessel clustering and a genetic algorithm. Compu. Elect. Agric., 51(1-2), 66-85.
100
Alka Arora et al. / Journal of the Indian Society of Agricultural Statistics 68(1) 2014 93-100
Rahimi, S., Zargham, M., Thakre, A. and Chhillar, D. (2004). A Parallel Fuzzy C-Mean Algorithm for Image Segmentation. IEEE Annual Meeting of the Fuzzy Information Processing Society, 2004. NAFIPS 04, 234237. doi; 10.1109/NAFIPS.2004.1336283 ©2004 IEEE. Rasmussen, M., Deshpande M. and Karypis, G. (2003). wCLUTO: A Web-Enabled Clustering Toolkit. Plant Physiology, 133, 510-516.
SAS Enterprise Miner. Available at http://www.sas.com/ technologies/analytics/datamining/miner/.
Randolph, N. and Gardner, D. (2008). Professional Visual Studio. Wrox publisher. ISBN: 978-0-470-22988-0.
Tari, L., Baral, C. and Kim, S. (2009). Fuzzy c-means clustering with prior biological knowledge. J. Biomed Inform., 42(1), 74-81.
Ross, J.T. (2004). Fuzzy Logic with Engineering Applications. John Wiley, USA. Simon, Á.B. and Kancsár, D. (2006). Fuzzy clustering on the web implemented by JSP technology. In: Computational Methods, Springer Netherlands, 1165-1169.
Triantafilis, J. and Lesch, S.M. (2005). Mapping clay content variation using electromagnetic induction techniques, Compu. Elect. Agric., 46(1-3), 203-237. The Comprehensive R Archive Network. available at: http:// cran.r-project.org/.
Xin-Zhong, W., Zhen-Hai, W., Qing-Hua, L. , Xu-Feng, L. , Wei-Hong, H., Yan-Tao, L. and Guo-Shun, L. (2009). Determination of management zones for a tobacco field based on soil fertility. Compu. Elect. Agric., 65(2), 49-59.