mance of RF-based indoor localization algorithms for specific environments .... at a cloud-based platform supporting public remote access for a large number of ...
Web-based Platform for Evaluation of RF-based Indoor Localization Algorithms Filip Lemic∗ , Vlado Handziski∗ , Niklas Wirstr¨om† , Tom Van Haute‡ , Eli De Poorter‡ , Thiemo Voigt† , Adam Wolisz∗ ∗ Telecommunication
Networks Group (TKN), Technical University of Berlin (TUB) † SICS Swedish ICT ‡ Department of Information Technology (INTEC), Ghent University - iMinds {lemic,handziski,wolisz}@tkn.tu-berlin.de
Abstract—The experimental efforts for optimizing the performance of RF-based indoor localization algorithms for specific environments and scenarios is time consuming and costly. In this work, we address this problem by providing a publicly accessible platform for streamlined experimental evaluation of RF-based indoor localization algorithms, without the need of a physical testbed infrastructure. We also offer an extensive set of raw measurements that can be used as input data for indoor localization algorithms. The datasets are collected in multiple testbed environments, with various densities of measurement points, using different measuring devices and in various scenarios with controlled RF interference. The platform encompasses two core services: one focused on storage and management of raw data, and one focused on automated calculation of metrics for performance characterization of localization algorithms. Tools for visualization of the raw data, as well as software libraries for convenient access to the platform from MATLAB and Python, are also offered. By contrasting its fidelity and usability with respect to remote experiments on dedicated physical testbed infrastructure, we show that the virtual platform produces comparative performance results while offering significant reduction in the complexity, time and labor overheads.
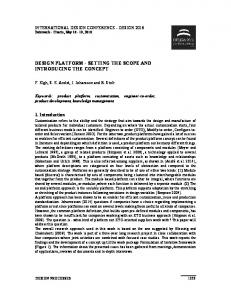
datasets for the purpose of performance evaluation of indoor localization algorithms. The provided platform1 supports evaluation of RF-based indoor localization algorithms without the need for experimentation on dedicated physical experimental infrastructure. As shown in Figure 1, the platform encompasses two core services. The first one is a service for storage and management of raw measurement data that can be used as an input to the localization algorithms that the experimenters want to evaluate. The second service offers automated calculation of a standardized set of indoor localization performance metrics like localization accuracy, response time and power consumption. The platform includes a tool for visualization of the raw data that supports experimenters in the process of reviewing the offered datasets. We also provide a set of Software Development Kits (SDKs) for Python and MATLAB, providing functions for streamlined access to raw data and for calculation of performance metrics, which further simplifies the evaluation process.
I. I NTRODUCTION The high demand for reliable location information in indoor spaces like buildings, tunnels, etc., where global satellitebased navigation systems are typically not usable, has led to an intense focus on alternative approaches. Many of the proposed solutions leverage intrinsic characteristics of the indoor environment in order to provide the users with estimates of their location. Using Radio Frequency (RF) signal features is one of the most popular approaches, as illustrated by the numerous works done in this area, with [1]–[4] being just a few of many examples. Although rapid progress has been achieved in the baseline performance of these algorithms, their practical application still requires extensive experimentation efforts for tuning the performance at the specific conditions of the deployment scenarios and environments, which are associated with high time and cost overheads. In this work we aim at reducing these hindrances by providing: (i) detailed public datasets of raw RF data that can be used as input to indoor localization algorithms, collected in a wide range of conditions (different types of devices, different types of interference, different environments) and (ii) a web-based platform that streamlines the utilization of these
Raw$data$storage$ service$
Metrics$calcula2on$ service$
API$
API$
W r
Raw$data$ visualiza2on$ tool$
get_measurements()$ a
raw$data$input$
“browsing”$of$ the$raw$data$
p p e r$
Algorithm$
W r a calculate_metrics()$ p metrics$input$ p e r$
fineAtuning$and$ parameteriza2on$ of$the$algorithm$
using$the$ evalua2on$ results$
Experimenter$
Figure 1: Main components of the evaluation platform From the experimenter’s perspective, with the help of the raw data visualization tool, the experimenter is able to visualize and “browse” the available datasets. After selecting the desired raw dataset, the experimenter can use it as input to an algorithm to be evaluated. Based on the results of the performance evaluation, the experimenter is able to parametrize or fine-tune the algorithm for improving its performance. 1
A prototype of the platform is available at http://ebp.evarilos.eu.
The currently offered datasets are collected on three testbeds, giving experimenters the possibility to evaluate their algorithms in diverse environments. The raw data that can be used as input to the evaluated algorithms is collected under different scenarios, with different densities of evaluation points, using different hardware and with different sources of controlled RF interference, providing a wide range of experimentation possibilities. This data was collected with the help of an automated testbed infrastructure described in [5]. We envision further additions to the current datasets, both from our side and from the researchers interested in contributing. The rest of this paper is structured as follows. In Section II we provide an overview of the related work. Section III describes the design and implementation of the platform, and the format of the stored raw data. In Section IV we present the currently available datasets and outline how some open research questions in RF-based indoor localization can be addressed using the available raw data. Section V compares the results and overheads of evaluating an example indoor localization algorithm with the help of the virtual platform and its datasets with one using remote experiments on dedicated physical testbed infrastructure. Finally, Section VI concludes the work and gives directions for future improvements. II. R ELATED W ORK Public raw datasets represent an important bedrock of scientific research in disciplines ranging from astronomy to studies of climate change and the humane genome. Dedicated sites, like the Amazon Public Dataset [6], act as central repositories of popular and large datasets, streamlining their use in cloudbased frameworks. These datasets can be leveraged as common benchmarks for assessing the relative performance of different systems. Popular examples are the use of NIST Language Recognition datasets in the domain of language recognition [7] or ImageNet datasets in computer vision [8]. In the domain of RF-based indoor localization, in addition to our work, there have been few previous efforts to virtualize aspects of the experimental evaluation of localization algorithms. One example is the VirTIL testbed [9]. While in the VirTIL testbed authors focus on the evaluation of rangebased indoor localization algorithms, by providing the range measurements at various locations in their testbed, in our work we promote and offer unprocessed low-level data such as Received Signal Strength Indicator (RSSI) and Time of Arrival (ToA) measurements that are used in a wide range of indoor localization approaches. As a result, the number of RF algorithms that can be evaluated is extended, and can include scene analysis (fingerprinting), hybrid and proximity based algorithms. In addition, we offer data from several testbeds with artificial interference patterns, offering users a possibility of evaluating their algorithms in different environments and interference scenarios. III. P LATFORM OVERVIEW This section presents the components of our platform for virtual evaluation of RF-based indoor localization algorithms.
The overview of the platform indicating the relation among individual components is given in Figure 1. The platform consists of a raw data storage service used for storing the raw data that can be inputed into an indoor localization algorithm to be evaluated. The platform further provides a raw data visualization tool, that enables experimenters to easily visualize collected information stored in the provided measurement collections. Furthermore, the experimenter is able to fetch and use a desired raw dataset though a set of software SDKs. Finally, a set of standardized metrics for characterizing the performance of an algorithm can be obtained through one function call to a metrics calculation service. The raw data storage service stores collected measurements that can be used for indoor localization evaluation purposes. A detailed description of the service and its functions is given in [9]. The measurements are stored together with the locations where they are taken, annotated with the locations of transmitting devices, the metadata describing the environment and the hardware used for collection of the raw data. The service provides a publicly available Application Programming Interface (API) for managing the stored data, where the experimenter can “search” the stored datasets and select a desired one. The platform further consists of a set of software SDKs or wrappers developed for Python and MATLAB programming languages, due to their popularity in rapid prototyping of algorithms, including those for indoor localization. The experimenter can use the wrappers to fetch measurements through a single function call. The experimenter is then able to input the fetched data to an algorithm to be evaluated. The SDKs provide interaction with the cloud service for the data storage as shown in Listing 1. Using the get measurements command, the experimenter is able to fetch the data from an experiment or a specific measurement. With the filtering command, it is possible to filter the fetched data based on desired parameters, such as number of measurements, wireless channel or transmitting device. Listing 1: Important Python SDK functions def get measurements ( database , experiment , measurement ) ; d e f f i l t e r i n g ( measurement , num meas , c h a n n e l , s e n d e r ) ; def c a l c u l a t e m e t r i c s ( data ) ;
The output of an algorithm, i.e. estimated locations, and the matching ground-truth coordinates where the measurements were taken, can be passed to a metrics calculation service using the calculate metrics command provided by the wrappers. By doing that the experimenter is able to obtain a standardized set of performance metrics, allowing him to easily evaluate the performance of an algorithm, using the experimentally collected data as the input and receiving a set of standardized metrics as the output of the procedure [10]. A. Design Goals Main requirements for the service are simplicity of usage for the experimenters, extensibility, reliability, fast data flow, remote usage of the service, and language and platform independence.
a) Usability: We provide a set of services for easy scoping and filtering of the raw data, so that experimenters can selectively request a record at a specific location coordinates and for a given technology, and consequently get the desired dataset in an efficient way. The advantage of our approach, in comparison to plain “downloading” alternative, lies in the fact that experimental raw datasets for evaluation of indoor localization algorithms can be very large. Especially for “universal” datasets that can be used for evaluation of different localization algorithms, the aim is to collect data at high spatial sampling densities and using diverse hardware equipment. But any particular algorithm would likely use only a small subset of this data in a given evaluation campaign. The approach of disseminating the whole raw data sets as simple “downloadable” archives is thus very inefficient and leaves to the experimenter the burden of local filtering. The alternative that we offer, an online service for accessing and managing of this data, is much more convenient for the experimenters and reduces the requirements for local computational resources. b) Extensibility: One of the main concerns for the development of the service for management of the raw data is extensibility. We aimed at developing a service where experimenters are able to add or remove parameters to the data records according to their specific needs. Furthermore, the overhead of storing these customized data records into the database should be minimal and should not require complex schema adaptations. c) Fast and reliable remote access: Another core design goal was communication efficiency and scalability. We aimed at a cloud-based platform supporting public remote access for a large number of users, without the need of downloading and running the whole platform on a local machine. d) Language and platform independence: Finally, the design goal is to make the platform available for various programming languages and operating systems. In other words, in order to make the platform usable for a large number of experimenters, with expertise in different software platforms and languages, we aimed in developing it so that it is language and platform independent. B. Platform Implementation As described previously, the main components of the platform are the raw data storage service, service for calculation of the performance metrics, set of SDKs for simple evaluation with Python and MATLAB programming languages and a visualization tool for convenient data browsing. While the other components provide straightforward functions and simplifications for the experimenters, due to its central role, the implementation of the raw data storage service is worth explaining in more detail. It is implemented as a web service developed in Python 2.7 using the Flask module. The Flask module provides a simple way of creating RESTful web services. We leveraged this to develop multiple functions for supporting raw data storage and management. Raw data is stored in a MongoDB database, an open-source document database and the leading Not only SQL (NoSQL) database
written in C++. It can store JavaScript Object Notation (JSON) based messages using Binary JSON (BSON) format of data. Our data messages are defined as Protocol Buffer structures, a way of encoding structured data using an efficient and extensible binary format. The service we developed, together with the MongoDB database, is running on a EC2 instance in AWS. Amazon Elastic Compute Cloud (Amazon EC2) is a web service that provides scalability and platform independence of our services. The experimenter is able to communicate with the services through properly defined HTTP requests. The design goal of extensibility was achieved using Protocol Buffer (version 2) for defining message types and MongoDB for storing those messages. In Protocol Buffers, each data structure that needs to be encoded is encapsulated in the form of a message. The specification of the internal structure of the messages is done in special protocol files that have the .proto extension. The specification is performed using a simple, but powerful, domain specific data specification language that allows easy description of the different message fields, their types, optionality, etc. Using the Protocol Buffer compiler protoc the .proto specification files can be compiled to generate data access classes in number of languages like C++, Java and Python. These classes provide simple accessors for each field (like query() and set query()) as well as methods to serialize/parse the whole structure to/from raw bytes. NoSQL databases employ less constrained consistency models than traditional relational databases. By using a NoSQL or schemaless type of database, i.e. MongoDB, the service enables the storage of any type of defined message, without the need of changing the code and/or the database itself. RESTful web services enable remote access to the data using simple HTTP requests. Protocol Buffers serialize messages into binary streams which support fast communication between the experimenters and the platform. To sum up, RESTful web service as a part of service for management of the raw data provides remote access to the service. High availability is supported by running the service in the Amazon cloud. Finally, the fast data flow from experimenter to database is achieved by using Protocol Buffer serialization and MongoDB schema-less database for storing the binary data. Using the Protocol Buffer compiler message specification files (.proto) can be compiled to generate data access classes in a number of programming languages like C++, Java and Python. Furthermore, due to the fact that communication with the cloud is done using HTTP requests, it is possible to manage data from different users’ platforms, and also using different programming languages (most of the modern programming languages provide libraries enabling HTTP requests). To conclude, by using Protocol Buffers and a RESTful web service it is possible to manage raw data from different platforms and using different programming languages. C. Data Structure NoSQL databases usually provide the following hierarchy. On the top level is a set of databases. Each database consists of a number of collections (the equivalent to tables in rela-
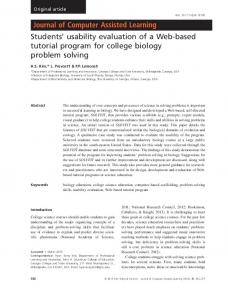
tional databases). Finally, each collection consists of a set of messages which contain data. We follow the same principle in our raw data storage service. The data storage hierarchy of the raw data storage service is given in Figure 2. The database for storing the raw data from the indoor localization experiments consists of a set of collections (called “Experiments” in our case), where a collection stores all raw data from one round of measurements, i.e. from one measurement survey. Each collection consists of messages that are related to physical locations where the measurements are taken, where each location is defined with coordinates (x, y, z) in relation to a predefined zero-point. Besides the database for storing raw data, there is also a database for storing the metadata describing the raw data. The explicit split between the data and metadata is done to reduce the amount of data that has to be fetched from the platform, i.e. in case where a lot of data shares the same metadata, the metadata has to be fetched only once and applied to all the data. Also, the explicit split enables reusage of one metadata message for multiple repetitions of the same measurement survey, which decreases the redundancy in the stored information. This database contains descriptions of different experiments or measurement surveys performed for collecting the raw data. Raw$data$
Experiment*1* …*
Metadata$
Experiment*M*
Measurement* at*loca4on*1*
…*
Experiment*1*
Measurement* at*loca4on*N*
Experiment*K*
Metadata*related* to*experiment*K**
DATABASES*
COLLECTIONS*
MESSAGES*
Figure 2: Hierarchy of the service for managing the raw data A snapshot of the raw data in JSON representation is given in Listing 2. This sample data consists of the RSSI measurements, information about the measurements (timestamp, transmitter ID, run number, etc.) and of the location of the transmitting and receiving devices. Alternatively, instead of storing RSSI values, it is also possible to store ToA, Angle of Arrival (AoA) or Link Quality Indicator (LQI) measurements, or any combination of those measurements. Listing 2: Raw data format 1 2 3 4 5 6 7 8 9 10 11 12 13 14 15 16 17
{ receiver_id: "MacBook Pro", run_nr: 13, timestamp_utc: 1373126790, sender_id: "tplink08", sender_bssid: "64:70:02:3e:aa:11", rssi: -42, channel: "11", receiver_location: { room_label: "FT226", coordinate_z: 9.53, coordinate_y: 1.67, coordinate_x: 23.9}, sender_location: { room_label: "FT226", coordinate_z: 10.9, coordinate_y: 0.7, coordinate_x: 31},}
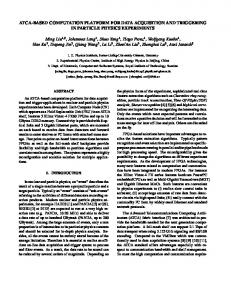
IV. OVERVIEW OF T HE AVAILABLE DATASETS The current datasets consist of IEEE 802.11b/g and IEEE 802.15.4 RSSI measurements, IEEE 802.15.4 ToA and IEEE 802.15.4 LQI measurements, collected using different devices at different locations in various environments and scenarios. A device for collecting the measurements has been carried to each measurement point using an autonomous mobility platform, which is a robotic mobility platform that can carry a system for collecting the raw data. It is capable of self-navigating in indoor office spaces, achieving positioning errors smaller that 15 cm in average [5], which is comparable to the positioning errors achieved by a person carrying a localization device. As has been shown in a large scale evaluation of multiple indoor localization solutions in [11], [12], the average localization errors of current state-of-the-art solutions are mostly higher than 1 m, meaning that the accuracy of the used autonomous mobility platform is sufficient to serve as source of ground-truth information. In addition to the simplification of the experiment process achieved by the automation, the mobility platform has an additional benefit in that it removes the influence that a person’s body can have on a measuring device, i.e. a device is entirely static during the measurement collection, there is no shadowing due to the person’s body, and the height of a device is always the same in respect to the floor. All these features produce raw measurements that are less influenced by the experimenter, which increases the objectiveness in comparability of multiple algorithms and gives more accurate intrinsic performance results of an algorithm. The disadvantage is, however, the fact that removing the influence of the experimenter gives less realistic real-life conditions, because in many real-life localization scenarios a localization device is carried by a person. In the following we overview the publicly available datasets and discuss how they help to solve open questions in RF-based indoor localization. a) Diversity of environments: One open research question in RF-based indoor localization is related to having a solution that provides reasonably accurate and real-time performance in diverse environments [13], [14]. The provided measurements collected in various environments give experimenters a possibility to evaluate the stability of their solution in diverse conditions, with an aim on solving the aforementioned research challenge. Current datasets have been collected in three different testbeds (TWIST [15] and wiLab.t I/II [16]). The footprints of the testbed environments are given in Figure 3, with the locations of measurement points for the densest measurement surveys indicated with red dots. The first two testbeds represent typical office environments. The measurements were performed in static environments, i.e. with no people moving, without introducing additional unaccounted sources of RF interference, etc. The third testbed represents a big open space environment, such as a warehouse or an underground garage. This environment is shielded with no people moving and with effectively no RF interference.
(a) TWIST testbed
(a) Density 1
(b) w-iLab.t I testbed
(b) Density 2
(c) w-iLab.t II testbed
(c) Density 3
Figure 3: Footprints of the testbed environments
Figure 4: Various densities in the TWIST testbed
b) Diversity of densities of measurements points: The measurements have also been collected with different densities of measurement points, which has various advantages. Firstly, some of the indoor localization algorithms, e.g. fingerprintingbased ones, need a training dataset with typically high density. The most dense dataset can in that case be used as the training dataset for the algorithm. Furthermore, it is still unclear how to select the measurement points for the objective evaluation of RF-based indoor localization algorithms [17]. By providing, in terms of realistic possibilities and time constrains, a highly dense set of measurement points, we provide the opportunity of evaluating the influence of the number and locations of measurement points on a large set of algorithms, which could address the mentioned research question. Finally, an open research question than can be addressed with the offered datasets is the trend in spatial distribution of localization errors [12], [18]. For the TWIST testbed environment as an example, the footprints with different densities of measurements points and with measurement points indicated with red dots, are given in Figure 4 (measurement points destinies of 22.5 m2 , 11 m2 and 5 m2 per point, respectively). c) Diversity of interference scenarios: It is shown that RF interference can highly influence the performance of RF-
based indoor localization algorithms [12], [19]. There is, however, no work on improving the interference robustness of indoor localization algorithms, and by providing the measurements collected in the environment with high interference, we hope to provide users the possibility of improving the interference robustness of their algorithms. The generated interference scenarios range from a scenario in which no artificial interference is generated and the uncontrolled interference is minimized, to scenarios with various types of RF interference. In the scenarios with interference the interference was artificially generated and the interference types vary from jamming using IEEE 802.11 or IEEE 802.15.4 devices to IEEE 802.11 traffic as the interference source. d) Diversity of localization devices: While it is known that the device diversity is one of the biggest obstacles in having widely used indoor localization service [20], this problem has not been fully addressed yet. By providing measurements from various devices we hope to provide possibility of improving the performance of RF-based indoor localization in this area. We have collected measurements from two extensively used technologies for RF-based indoor localization, namely IEEE 802.11 and IEEE 802.15.4. The full datasets for different technologies are available for the TWIST testbed environment.
In Figure 5 we show the locations of controllable IEEE 802.11 (blue squares) and IEEE 802.15.4 (red points) nodes that have been used as anchors in TWIST testbed [15]. In our data collections the measurements from these devices are annotated with with the location of the transmitters. In case of the IEEE 802.11 anchor nodes, we have used six TP LINK 4300 wireless routers, set on WiFi channel 11 and with a transmission power of 20 dBm (100 mW). Apart from these devices, we also stored the data from all other visible Access Points (APs) in the environment, but without their locations. For the IEEE 802.15.4 technology we have been using TelosB nodes deployed in our TWIST testbed as anchor nodes. We used various devices as receivers for obtaining the provided datasets. Namely, for the IEEE 802.11 technology we used the MacBook Pro and Lenovo ThinkPad laptops, Google Nexus 7 tablet and Nexus S smartphone. For the IEEE 802.15.4 technology we have been using the TelosB and stm32w nodes as measuring devices.
IEEE#802.11#anchors# IEEE#802.15.4#anchors#
Figure 5: TWIST testbed - transmitting devices V. E VALUATION OF THE V IRTUAL P LATFORM In order to evaluate the usability of the collected raw datasets and the time efforts of using the virtual platform for evaluation of RF-based indoor localization algorithms we have executed a set of experiments described in this section. We used a simple WiFi beacon packets RSSI-based fingerprinting algorithm that uses quantiles of beacon packets RSSI values and Pompeiu-Hausdorff (PH) distance to calculate similarities between training and user-generated fingerprints [14]. Further, we evaluated its performance firstly by using the infrastructure for evaluation of RF-based indoor localization algorithms described in [5] and secondly by leveraging the raw dataset collected under similar conditions by using the virtual platform. The aim of the evaluation is to demonstrate that the achieved performance metrics of the evaluated algorithm, i.e. the accuracy and delay (response time), do not practically differ in a case when the proposed platform is used, in comparison to a case when real testbed infrastructure is used for evaluation. Secondly, while it is clear that, in comparison to using the infrastructure for experimentation, using the proposed platform provides lower-complexity experimentation for the experimenter, we aim on showing that there is also a significant reduction in time-efforts needed for experimentation. Since the impact of the “staleness” of recorded data depends on the specific conditions in the environment, in the comparison of performance of the evaluated fingerprinting
algorithm we have collected a raw dataset and performed an experimental run using the infrastructure on the same day and in a static environment. The presented results are not intended to prove that recorded data can replace many runs with real hardware, due to changes in the conditions that can occur with time. In other words, the same raw datasets collected in different time snapshots will differ, due to an intrinsic randomness in wireless environment, and for capturing this difference different runs with a real hardware are necessary. On the contrary, the presented results capture realistically the specific conditions in a time snapshot and can serve as basis for fair comparison between the results obtained by leveraging the raw dataset as an input to the algorithm and the results obtained by performing an experimental run leveraging the evaluation infrastructure, i.e. requesting the algorithm to provide an estimate at each evaluation point. In the experiments using the infrastructure we evaluated the performance of a given algorithm, which was running on a MacBook Pro laptop, in four interference scenarios in TWIST testbed (in details described in [12]) and in 20 evaluation points for each interference scenario (Figure 4b). In the first interference scenario, i.e. “Reference scenario”, no artificial interference was generated and the influence of uncontrolled interference was minimized by performing the experiment in static environment to ensure consistency and minimize the effects of shadowing and RF interference. In the “Interference scenario 1” the artificial interference was WiFi traffic on one WiFi channel. Finally, in the “Interference scenario 2” and “Interference scenario 3” artificially generated interference was distributed jamming on IEEE 802.15.4 channel and jamming on IEEE 802.11 channel, respectively. Using the platform for virtual evaluation we selected an appropriate dataset in which a MacBook Pro was used as the device for collecting the raw data, the raw data was collected in the same 20 evaluation points, in the same testbed and in the same four interference scenarios. The functions of the Python wrapper were used to fetch the raw data and input it to the algorithm, and to calculate the performance metrics. The delay metric in this case is the sum of the time needed to collect the measurements and the time needed for the processing of the raw data and providing the location estimates. The summarized results for 20 evaluation points in each interference scenario are given in Table I. As indicated in the table, the results of the evaluation using the virtual platform are comparable to the results using the infrastructure specifically designed for evaluation purposes. Small differences in the localization errors and room accuracies are caused by an unavoidable randomness of the wireless environment. From the time perspective, the evaluation using the virtual platform takes only a few (tens of) seconds, once the evaluation chain (fetch the raw data - input the data to an algorithm request metrics - get metrics) is set. In comparison, one run of an experiment with 20 evaluation points using the automated infrastructure for experimentation takes around 1 min per point, or around 20 min all together. From our experience, we can argue that manual experimentation takes even more
TABLE I: Evaluation results obtained using the infrastructure vs. using the platform for evaluation Scenario Metric Mean error [m] Median error [m] 75 perc. error [m] 90 perc. error [m] Min. error [m] Max. error [m] Room acc. [%] Mean delay [s] Median delay [s] 75 perc. delay [s] 90 perc. delay [s] Min. delay [s] Max. delay [s]
Reference scenario Infrastructure Platform 2.82 2.91 2.61 2.45 3.87 3.74 4.19 4.56 0.47 0.22 5.76 6.41 70.0 65.0 20.08 21.02 20.05 21.20 20.11 21.32 20.25 21.51 19.66 20.12 21.02 22.23
Interference scenario 1 Infrastructure Platform 3.84 3.72 3.11 2.87 5.14 4.87 5.87 5.44 1.26 1.17 6.70 6.53 50.0 55.0 19.58 21.05 19.83 21.09 19.95 21.78 20.03 21.95 19.71 19.56 20.11 22.04
time, in comparison to using the automated infrastructure, which again favors using the virtual platform for evaluation. If we take into account also the time necessary for setting up a comparable experimental setup (on the order of days or weeks), the benefit of using the proposed virtual platform is even higher. VI. C ONCLUSION AND F UTURE W ORK This work describes a platform for virtual experimental evaluation of RF-based indoor localization algorithms in a simple and effective way, without the need of a testbed infrastructure. We firstly provide an overview of the design ideas that guided the development of the platform and its high-level architecture, together with the selected implementation frameworks. We further describe the currently available datasets that can be used for evaluation of RF-based indoor localization algorithms, together with the experimentation possibilities that they enable. Finally, we demonstrate the usage of the virtual platform and assess the overhead and obtained performance evaluation metrics by performing the same set of experiments using the platform and a dedicated physical testbed infrastructure. The advantage of having the virtual platform is visible in its simplicity for the experimenters and the reduction of the time needed for experimentation. When using the platform the experimenter is provided with easy to use, low-complexity access to the infrastructure, which does not have the burden for handling the complex components of the infrastructure for evaluation. In comparison to manual evaluation, when using the platform the experimenter does not have to carry a measuring device and does not have to care about finding the exact coordinates for the groundtruth locations, which are both labor and time consuming. By using the platform it is possible to leverage exactly the same dataset for comparing different algorithms or different parameterizations of an algorithm, which removes the previously described randomness in the wireless environment and increases the objectivity of comparison between different algorithms. Our future work will be oriented on increasing the accuracy of ground-truth locations and on collecting additional measurements, with the focus on device diversity, more dense measurements and AoA measurements.
Interference scenario 2 Infrastructure Platform 5.20 4.91 4.81 4.41 6.46 6.22 9.49 8.81 0.88 0.56 11.46 8.31 45.0 50.0 20.58 20.76 20.45 20.55 20.71 20.91 21.64 22.08 19.92 20.03 21.94 22.65
Interference scenario 3 Infrastructure Platform 4.02 4.26 3.56 3.61 5.36 5.45 7.37 7.44 0.79 1.02 10.93 11.65 45.0 45.0 20.02 20.55 20.05 20.63 20.11 20.76 20.16 20.87 19.67 20.12 20.26 21.04
ACKNOWLEDGMENTS This work has been partially funded by the European Commission (FP7-ICT-FIRE) within the project EVARILOS (grant No. 317989). The author Filip Lemic was partially supported by DAAD (German Academic Exchange Service). R EFERENCES [1] [2] [3] [4] [5] [6] [7] [8] [9] [10] [11] [12] [13] [14] [15] [16] [17] [18] [19] [20]
P. Bahl and V. N. Padmanabhan, “Radar: an in-building rf-based user location and tracking system,” in INFOCOM’00, IEEE, 2000. N. B. Priyantha et al., “The cricket location-support system,” in MOBICOM’00, ACM, 2000, pp. 32–43. T. He et al., “Range-free localization schemes for large scale sensor networks,” in MOBICOM’03, ACM, 2003, pp. 81–95. D. Niculescu and B. Nath, “Ad hoc positioning system (aps) using aoa,” in INFOCOM 2003, IEEE, vol. 3, 2003, pp. 1734–1743. F. Lemic et al., “Infrastructure for Benchmarking RF-based Indoor Localization under Controlled Interference,” in UPINLBS’14, 2014. Amazon, Amazon Public Datasets. [Online]. Available: https://aws. amazon.com/datasets. A. F. Martin and M. A. Przybocki, “NIST 2003 Language Recognition Evaluation,” in INTERSPEECH, 2003. O. Russakovsky et al., ImageNet Large Scale Visual Recognition Challenge, 2014. F. Lemic and V. Handziski, “Data Management Services for Evaluation of RF-based Indoor Localization,” Telecommunication Networks Group, Tech. Rep. TKN-14-002, 2014. F. Lemic, “Service for Calculation of Performance Metrics of Indoor Localization Benchmarking Experiments,” Telecommunication Networks Group, Tech. Rep. TKN-14-003, 2014. D. Lymberopoulos et al., “A Realistic Evaluation and Comparison of Indoor Location Technologies: Experiences and Lessons Learned,” 2015. F. Lemic et al., “EVARILOS Open Challenge: Track 3,” Telecommunication Networks Group, Tech. Rep. TKN-14-005, 2014. E. Elnahrawy et al., “The limits of localization using signal strength: a comparative study,” in Sensor and Ad Hoc Communications and Networks (IEEE SECON 2004), IEEE, 2004, pp. 406–414. F. Lemic et al., “Experimental Decomposition of the Performance of Fingerprinting-based Localization Algorithms,” in IPIN’14, 2014. V. Handziski et al., “TWIST: a scalable and reconfigurable testbed for wireless indoor experiments with sensor network,” in RealMAN’06, 2006. S. Bouckaert et al., “The w-ilab. t testbed,” in Testbeds and Research Infrastructures. Development of Networks and Communities, 2011. T. V. Haute et al., “The EVARILOS Benchmarking Handbook: Evaluation of RF-based Indoor Localization Solutions,” in MERMAT’13, 2013. S. Adler et al., “Experimental Evaluation of the Spatial Error Distribution of Indoor Localization Algorithms,” in UPINLBS’14, 2014. A. Behboodi et al., “Interference Effect on Localization Solutions: Signal Feature Perspective,” in VTC2015-Spring, 2015. J.-g. Park et al., “Implications of Device Diversity for Organic Localization,” in INFOCOM, 2011,, 2011, pp. 3182–3190.