Jan 15, 2002 - scoring scheme does not discriminate well between the relative importance of ... To calculate the concept metric, each response word, Ri, entered by a user for a given .... the highest average belief in psi of 4.4 (with at least 10 respondents from each of those ... only 250 would be expected by chance.
Preliminary Analysis of a Suite of Informal Web-Based Psi Experiments Dean I. Radin, Ph.D. Boundary Institute and Institute of Noetic Sciences
In August 2000, the Boundary Institute launched a suite of three Web-based psi experiments; a fourth test was added in September 2001. By December 31, 2001, more than 46,000 individuals from 106 countries had contributed over 7 million trials. This paper summarizes a preliminary analysis of data collected through October 2001.
Introduction A Gallup Poll conducted in June 2001 indicates that 50% of Americans believe in extrasensory perception (ESP). Contrary to some skeptics’ assertions that only unintelligent people believe in psychic phenomena, the poll indicates that belief actually increases with educational level. Also, levels of belief have been remarkably stable for many decades. This means that tens of millions of people in the United States are probably interested in testing their psychic abilities. Online tests for psychic ability appeared almost as soon as computer networks began. In 1976, at the University of Illinois, Champaign, I implemented a widely used online precognition test on the PLATO computer network (Johnson, 1977). In recent years, the Web has become an increasingly popular means of providing tests for psychic ability. I programmed the present tests at the Boundary Institute. The tests have been hosted on commercial Linux servers, kindly donated for this use by Dr. Edwin May of the Laboratories for Fundamental Research. The tests are also linked from the home page of the Institute of Noetic Sciences. The URL www.gotpsi.com redirects the user to the appropriate testing location. The tests are programmed in the Perl language with CGI extensions. Perl/CGI is a popular Web development tool used to create interactive web pages as Perl is a free, activelysupported programming language that runs on virtually all modern computer operating systems. Registration Procedure When a user first visits the psi test site, he or she is asked to provide a UserID or screen name for the test. Then the user is directed to a page that asks a series of general personality and experiential questions. The initial questionnaire asks for the user’s email
Dean Radin © 2002
January 15, 2002
Page 1/23
address, city, state, zip code, and country, and then presents the questions shown in Table 1, on a 5-point scale. The degree to which you believe in "psychic" phenomena have had precognitive experiences practice meditation practice martial arts or yoga consider yourself creative are lucky trust in your intuition trust in a religious faith have a sense of the spiritual are enthusiastic about sports work as a scientist are trained in remote viewing actively use remote viewing have participated in psi experiments view time metaphorically as a
from none none none none none none never none none none none none none none placid pool
to Absolute Extensive Extensive Extensive Extremely Extremely Always Absolute Absolute Extremely Extensive Extensive Extensive extensive raging waterfall
Table 1. Primary questionnaire.
These questions are followed by a series of questions used to form a rudimentary metric of brain laterality, shown in Table 2 (Loye, 2000). Question In grade and high school, you were better in In grade and high school, you were better in You tend to solve problems by Do you follow hunches only if they are supported by logic? Do you follow hunches even if they aren't logical but have the right "feel"? Have you ever known (before being told) if a member of your immediate family or a close friend was in serious trouble, or ill? In drawing pictures and maps, how would you rate your sense of distances and how things relate to one another? When you work on projects you most want them to : In dealing with problems, which gives you the most satisfaction? Do you ever experience hunches about future events that prove to be correct?
Binary choice Math vs. art Languages vs. crafts Analyzing them step by step, or getting a feel for the solution Yes / no No / yes No / yes
Pretty good / no so good Be well planned, contribute something new Solving them by thinking them through, experimenting with fascinating ideas Yes/ no
Table 2. Loye Brain Laterality questionnaire.
After the questionnaire is filled in and submitted to the Web server, if users indicate that they think they are especially creative, then a second questionnaire appears that asks questions about how creativity manifests in their lives. If users also indicate that they had had remote viewing training, then a special remote viewing questionnaire appears. At the user’s discretion, one or more of the questionnaire items could be left blank.
Dean Radin © 2002
January 15, 2002
Page 2/23
Remote Viewing Test Design The remote viewing test asks users to imagine a color photo that they will see after filling out a form. The form asks the user to think about the future image and then to select 0 to 7 of the “shape” check boxes corresponding to that image, as shown in Figure 1.
Figure 1. Remote Viewing Test check boxes.
Second, as shown in Figure 2, the user selects one radio button for each of the nine scales shown below. The user is asked to, “Select the button based on the degree to which you think the property is present in your image. If you do not fill in one of these scales, its value defaults to low confidence.”
Figure 2. Remote Viewing Test radio buttons.
Dean Radin © 2002
January 15, 2002
Page 3/23
Third, the user is asked to fill in a textbox with words describing his or her impression (Figure 3).
Figure 3. Remote Viewing Test text box for words.
After hitting the submit button, the computer selects one of 99 possible images uniformly at random, and displays it as shown in Figure 4.
Figure 4. Remote Viewing Test feedback.
Feedback Score Along with the target photo, a score ranging from 0 to 100 is provided as feedback, as shown at the top of Figure 4. This score is calculated in two steps: First, a difference value is calculated based on how the user filled out the 16 descriptors for the target image vs. how independent judges who had previously examined the same picture filled out the same 16 descriptors. Second, this difference value is recalculated for every other possible picture in the target pool. The final score reflects how well the difference-value calculated for the actual photo compares to all possible values that the user could have obtained if he or she had obtained one of the other targets. A high score indicates that the user’s impressions
Dean Radin © 2002
January 15, 2002
Page 4/23
provide a better description of the actual target photo as compared to the other possible targets, and vice versa for a low score. While this score provides a fast and easily calculated indicator of performance, in practice many users noted that it is sometimes wildly inaccurate. This is because this simple scoring scheme does not discriminate well between the relative importance of individual descriptors. I.e., when judges examined a given photo, they may have disagreed about the presence of say, angular versus linear shapes in the image. The judges’ disagreements suggests that these descriptors should have been given lower weight (to indicate lower inter-judge confidence), as compared to say, whether the image specifically showed that food were present or absent, which most judges might have agreed upon. More refined descriptor-based scoring schemes might have been employed (e.g., Jahn & Dunne, 1987; May et al, 1990), but a new technique was explored in this test. Concept Metric The new method involved the formation of a concept metric. The procedure was as follows. First, users who wished to participate as online judges were allowed to view one target photo at a time, selected at random. While viewing a photo, the judge was asked to fill out the same form used in the experiment, and also to enter words. As of October 7, 2001, 1,138 judging trials had been collected, containing a total of 6,322 words. A low of 24 to a high of 123 words were provided per photo image. For each target, the four words reported with the highest frequency were used to capture the concepts depicted by that target image. Now the words entered by a user on a given trial are compared to the words identified by the judges for that same target. This comparison provides a measure of how close in “concept space” the user’s entered words are to the judges’ prior collective assessment of the same photo. To automate this comparison process, a computer-based associative thesaurus known as the Edinburgh Associate Thesaurus (EAT) was employed (Kiss, Armstrong, Milroy & Piper, 1973). The nucleus set of words for the EAT was derived from the 1,000 most frequent words of the Thorndike and Lorge (1944) word frequency count plus several other sources. Then each stimulus word was presented to 100 different students, each of whom was asked to provide a one-word association to each word. The word apple might have resulted in say, 30 students providing the associated word pie; 17 students providing the word pear, 13 students providing orange, and so on. The EAT provides a highly interconnected network of words that captures the basic associative structure of the English language. To calculate the concept metric, each response word, Ri, entered by a user for a given remote viewing target (where i could range from 1 to N words), is compared to each of the judged or “target” words, Tj, by seeing whether there is a direct (i.e., one-step) word association from Ri → Jj or from Ri → Jj.1 For all response words, the strength of the resulting associations, if any, are summed. Exact matches between Ri and Jj are assigned the maximum associative strength of 100. The final score for a given set of concepts is thus
1
Word associations are not commutative. associative strength for pear → apple.
Dean Radin © 2002
I.e., the associative strength for apple → pear
January 15, 2002
≠
Page 5/23
a value between 0, indicating no associations found between user responses and target words, to an unlimited upper limit.2 After the associative strength is determined for a given trial, the same process is used to find the associative strengths that could have resulted if the other possible remote viewing targets had been obtained. Because there were a total of 99 possible targets, the statistical result of a given trial is expressed in terms of the number of trials, say n, with associative strength greater than that observed with the actual target. Thus, the probability associated with a given trial is p = (n - .5)/99. Finally, this probability is converted into a z score using an inverse normal transform. Location Test Design The Location Test asked participants to guess where, within a square area, a target will appear after clicking in the square. Figure 5 shows the square area (left) and feedback page (right). The square in Figure 5 (right) indicates where the user clicked, and the circle shows the resulting random target location.
Figure 5. Location Test initial and feedback pages.
A score for each trial is determined by transforming the user’s x,y positions in the target area, which is 300 × 300 pixels in size, into the equivalent location in a 100 × 100 matrix. Then the linear distance is determined between the user’s x,y selection and the computer’s target x,y selection, and this distance is compared against all 10,000 possible distances that could have resulted had the target been located somewhere other than the actual location. The result of this process is a number from 1 (meaning the actual distance was larger than any other distance, except for itself) to 10,000 (the actual distance was smaller than all other distances). This value, say n, was turned into a p value as p = n/10000, and this was turned into a z score using an inverse normal transform.
2
Because of the rich conceptual interconnections in the EAT, many concepts that would otherwise be viewed as dissimilar can usually be linked in two or three associative jumps. I.e., apple is associated with say, fire, via the associative connections apple → red → fire.
Dean Radin © 2002
January 15, 2002
Page 6/23
Card Test Design The Card Test asks participants to guess which one of five cards the computer will randomly select after they selected one. The task is described as “click on the one card that has a picture on the other side” (obviously there is no “other side” in a screen display, but the general idea is assumed to be clear). Figure 6 shows the initial page with the “backs” of the cards (left) and the feedback page after the user selects a card(right). In this example the user selected the 2nd card from the left (indicated by the card with “your choice”) and the computer randomly selected the 1st card.
Figure 6. Card Test initial and feedback pages.
Sequential Card Test This test was initiated in September 2001; it is based on an idea by Jiri Wackermann (Wackermann, Benthin & Pütz (2001). The test initially appears to be similar to the Card Test, as shown in Figure 7, but the operation differs.
Figure 7. Screen display at beginning of the Sequential Card Test trial.
After selecting one of the cards, if that card is the target, then the trial ends. Otherwise, the selected card turns white, as though it had been turned over, and the user selects one of the remaining cards. Eventually, the user will find the target, as shown in Figure 8 after making three selections.
Dean Radin © 2002
January 15, 2002
Page 7/23
Figure 8. Screen display after three incorrect responses and a correct response, with “simple” feedback.
Halls of Fame The Remote Viewing, Location, Card, and Sequential Card Tests each provide a Daily Hall of Fame. These are special Web pages listing the latest performance rankings of each participant who tried the test each day, recalculated on demand. To encourage users to contribute trials, the Location Test Hall of Fame only displays participants who provide at least 20 trials, and the Card Test and Sequential Card Test Halls of Fame each display participants providing at least 25 trials. The Remote Viewing Test displays all users. Figure 10 is an example of the Card Test Daily Hall of Fame.
Figure 10. Card Test Daily Hall of Fame.
Results General Statistics From August 2000 through October 2001, just over 38,000 users had registered for these tests; together they contributed nearly 6 million trials. Based on the country information entered, people participated from at least 106 countries. Six countries accounted for 90% of
Dean Radin © 2002
January 15, 2002
Page 8/23
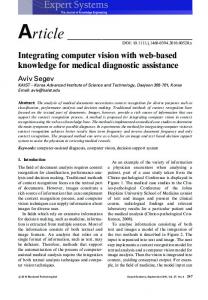
the data; these were the USA, UK, Canada, Greece, Australia, and Ireland. In many cases, claimed country locations could be partially confirmed through examination of the user’s entered email address, which could be traced to the appropriate country of origin. Of the 38,000 users, 90% answered at least 24 of the 25 items asked in the questionnaire, and 96% of all the entries were unique.3 This suggests that the large majority of users participated seriously in the tests. A small percentage of the UserID information was considered suspicious and was discarded for later use in the personality correlate analyses. This included duplicate entries, 1.6% of the entries which were entered with non-readable UserIDs, 0.5% which had suspiciously low variance across the answers (e.g., an answer of “3” for each question), and 6.8% which did not respond to any of the questions. Of persons who filled out the general questionnaire, 27,626 also filled out the creativity questionnaire and 3,482 also filled out the remote viewing questionnaire. (Results associated with these two special questionnaires are beyond the scope of this report.) Some simple cross-cultural questions could be explored using the questionnaire entries. For example, according to the 5-point scale where 1 is the most skeptical and 5 is the most accepting, the average level of belief for all respondents was 4.1. The five countries with the highest average belief in psi of 4.4 (with at least 10 respondents from each of those countries) were the United Arab Emirates, New Zealand, Malaysia, Israel, and the Philippines. The five lowest belief countries, with an overall average belief of 3.7, were Scotland, Spain, Greece, Finland, and India. Because the two highest country response rates were from the USA and UK, accounting for 77% of all users, a comparison can be made for the average respondent from these two countries. Figure 11 shows that the average respondent from the USA had significantly higher levels of belief in psi, more personal experiences of precognition, more meditative experience, felt more creative, was more religious and spiritual, and was about the same in interest on sports and in scientific training. It is conceivable that respondents from the UK simply respond differently to questionnaires than USA respondents, and that the apparent differences in belief, etc., are actually due to cultural response biases rather than to genuine differences in average cultural beliefs. But countering this argument is the observation that the average responses for the sports and scientist questions are statistically indistinguishable. It is possible to conduct more detailed cultural comparisons with this data, but such analyses are beyond the scope of this preliminary analysis.
3
A total of 1,393 were duplicate UserIDs, indicating either that those individuals had re-registered for the test, or were new users masquerading as a previous user.
Dean Radin © 2002
January 15, 2002
Page 9/23
average response
4.5 4.0 3.5 USA
3.0
UK
2.5 2.0 scientist
sports
spiritual
religious
creative
meditation
precog_exp
belief
1.5
Figure 11. Questionnaire responses for average USA and UK respondent, with one standard error bars.
Remote Viewing Results From September 2000 through October 2001, a total of 18,412 users contributed 143,702 remote viewing trials. The daily counts of trials are shown in Figure 12. Of those, half of the trials (49.6%) had words entered, and of those, about half (51.9%) or 37,055 trials contained at least one direct association to a word in the associative thesaurus. These trials were contributed by 10,837 people. The concept metric permutation results of each of those trials were transformed into z scores, as described above. Those trials were then consolidated into one Stouffer Z score per person and then matched against the questionnaire entries. Through this process, some 9,924 people could be matched to their questionnaire entries. They contributed a low of 1 trial per person to a high of 1023 trials. Collectively they entered a total of 209,589 words. 3000 2500
trials
2000 1500 1000 500
923
824
725
625
526
426
327
225
126
1227
1127
1028
928
0
date
Figure 12. Trials contributed in the Remote Viewing Test, September 2000 to October 2001 .
Dean Radin © 2002
January 15, 2002
Page 10/23
Out of 170 users who contributed 20 or more trials, 36 had overall results significant at p < 0.05. Only 8.5 people are expected to be significant at this level by chance; this excess is associated with an exact binomial p~10–13, suggesting that some individuals may have exhibited talent at this task.4 A similar analysis of trials contributed by 5,004 people, each of whom provided a single trial, showed that 333 had results significant at p < .05, whereas only 250 would be expected by chance. Of these individuals, 4,841 included belief information in their questionnaire. Figure 13 shows their average z scores by level of belief. Schmeidler’s (1943) Sheep-Goat effect predicts a positive correlation. As shown, the results are significantly positive. More personality correlates are examined later. 0.10 R2 = 0.96 average z score
0.05 0.00 -0.05 -0.10 -0.15 -0.20 none
some
moderate
much
certain
belief in psi
Figure 13. Average level of belief (and one standard error bars) for 4,841 users who provided a single response in the remote viewing test. Pearson correlation r = 0.98, p = 0.003.
Card Test Results From August 2000 through October 2001, this test recorded 2,799,434 trials contributed by 27,031 users. Some participants contributed a single trial; most contributed a few runs of 25 trials and one participant provided a total of 123,199 trials. Figure 14 shows the number of trials contributed per day. The spikes in this figure correspond to days when the online tests were mentioned in popular radio shows or appeared in newspaper articles.
Dean Radin © 2002
January 15, 2002
Page 11/23
45000 40000 35000 trials
30000 25000 20000 15000 10000 5000 923
824
725
625
526
426
327
225
126
1227
1127
1028
928
829
0
date
Figure 14. Trials contributed daily in the Card Test
With chance expectation at 20.0% in this test, the overall hit rate was 19.98%, associated with a nonsignificant z = -0.71. Participants who contributed fewer than the predefined run-length of 25 trials produced 9,991 hits in 58,233 trials, for an overall hit rate of 17%, associated with z = –17.2. This provides unambiguous evidence for optional stopping, i.e., people who were performing poorly opted out before finishing a single run of 25 trials. Optional stopping is also evident at the run-level. For all participants who provided 25 or more trials, the relationship between the log number of contributed trials per person, versus their hit rates, was r = 0.19, t = 31.0, N = 27,031. Out of 422 participants who contributed at least 500 trials in Card Test Version 1 (described in more detail below), 39 achieved odds against chance of 20 to 1 or better due to strong hitting or missing. We would expect 42 people to achieve such odds by chance, thus there is no evidence of special talent in this version of the test. Out of 107 participants who had contributed at least 500 trials in Card Test Version 2, 10 achieved odds against chance of 20 to 1 or better. We would expect 11 by chance and thus again there is no evidence of special talent. Sheep-Goat Effect Figure 20 shows the number of individuals who contributed a single run of 25 trials, and Figure 21 shows the resulting average hit rates at these five levels of belief. As predicted by the Sheep-Goat effect, the difference between the hit rates for highest vs. lowest levels of belief is significant at z = 2.29, p = 0.01. A Spearman rho correlation for belief vs. hit rate is small in magnitude, but also significant in the predicted direction, ρ = .031, t (8000) = 2.77, p = .006.5
5
The program used to calculate the Spearman rho was limited to 8,000 cases.
Dean Radin © 2002
January 15, 2002
Page 12/23
4500 4000
participants
3500 3000 2500 2000 1500 1000 500 0 1
2
3
4
5
belief
Figure 20. Number of respondents providing a single run of 25 trials who indicating their belief in psi. The scale ranges from no belief (1) to certain belief (5). 0.205 0.200
hit rate
0.195 0.190 0.185 0.180 0.175 1
2
3
4
5
belief
Figure 21. Hit rates vs. level of reported belief in psi, with one standard error bars.
Location Test Results A total of 15,813 users participated in this test as of October 2001. This group contributed 1,769,004 trials in 33,128 daily person-sessions, ranging from a low of 1 trial to a cumulative high of 39,793 trials per person. Figure 22 shows the daily counts recorded in this test. 25000
trials
20000 15000 10000 5000
923
824
725
625
526
426
327
225
126
1227
1127
1028
928
0
date
Figure 22. Daily counts in the Location Test.
Dean Radin © 2002
January 15, 2002
Page 13/23
Out of all users, 5,530 people contributed a single run of 20 trials, for a total of 110,600 trials. Within this subset, the overall (Stouffer) z score = -0.0005, providing no overall evidence for precognition. However, across all users and all contributed trials, the combined z = 5.4. This prompted a closer investigation of the more frequent users, and that analysis revealed two users who had achieved astronomical odds against chance. Table 3 shows the results of the two users, labeled here as “M” and “V.” Analysis indicated that M and V were probably two different individuals, and their results were probably not due to exploiting programming loopholes or having hacked into the computer database.6 UserID M V
N 15,893 18,340
Stouffer z score 7.62 7.18
Table 3. Results for two exceptional performers on the Location Test.
Before accepting these results as necessarily being due to psi, a more prosaic possibility was explored: Was the target generation process adequately random? To study this question, on May 18, 2001 the method of seeding the Perl pseudorandom number generator was changed. Figure 23 shows how “M’s” performance changed as a result, in terms of cumulative z scores.
Figure 23. Results of “M” performance in the Location Test before (labeled “pre,” the top line) and after (“post,” the bottom line) the method of seeding the pseudorandom number generator was changed.
Figure 23 indicates that the original pseudorandom seeding process was inadequate. After the new seeding process was established, M was no longer able to learn the task. To see whether other participants may have been able to learn the task, I examined all trials contributed by all participants from the beginning of the test to May 17, 2001 (the day before the new randomization process was implemented). Excluding the two exceptional subjects, a total of 1,245,020 trials had been recorded. The overall result was z = 6.851. By
6
While every effort was made to prevent these possibilities, in any Internet-based application it is imprudent to claim with certainty that hacking was impossible. E.g., even extensively tested Microsoft applications, and supposedly secure government computers, are regularly hacked into.
Dean Radin © 2002
January 15, 2002
Page 14/23
contrast, from May 18, 2001 through the end of September 2001, a total of 524,004 new trials were recorded, resulting in z = -0.557. This confirms that something about the original randomization procedure was inadequate. To understand more about what aspect of the randomization was deficient, autocorrelations in “M’s” targets and responses were examined in detail. As expected, M had a strong negative autocorrelation in responses at lag 1 (because like most people, M tended not to repeat the same target twice in a row). Unfortunately, the target sequence also exhibited a small negative but statistically significant autocorrelation at lag 1, especially for the y-axis position. The coincidence between a natural response bias and a negative autocorrelation in the target locations made it possible to learn where, on average, the next target location would appear. To test this “pattern recognition hypothesis,” the same autocorrelation analysis was applied to all data generated by M after May 18, 2001. The result showed that M’s response biases remained virtually identical to M’s previous responses, but the target’s autocorrelations were now in alignment with chance. This suggests that the exceptional cumulative scores provided by M and V in the Location Test prior to May 18, 2001 were due to their having unconsciously learned to spot sequential patterns in the target locations. This analysis reinforces prior research indicating how exceptionally skilled some people are at learning exquisitely subtle sequential patterns, including complex chaotic sequences (e.g., Neuringer & Voss, 1993). It also emphasizes how important adequate randomization is when one wishes to infer that psi, and psi alone, took place. Personality Correlates Figure 26 shows the Spearman rho correlations between the belief question and the other 15 questionnaire items, as answered by 4,912 users, all of whom provided exactly 25 trials in the Card Test and also answered all 16 questionnaire items. As expected, persons who tend to believe in psi also tend to be “right-brained” (laterality item), and they also tend to express high levels of interest in spirituality, meditation, intuition, etc. In contrast, persons reporting higher levels of scientific training and interest in sports reported lower levels of belief. These results help confirm that, on average, the information provided in the questionnaire is in alignment with prior expectations about personality, experience, and belief in psi.
Dean Radin © 2002
January 15, 2002
Page 15/23
0.6
Spearman rho
0.5 0.4 0.3 0.2 0.1 0.0 -0.1 scientist
sports
time
movement
lucky
RV train
psi expt
creative
use RV
religious
laterality
meditation
intuition
precognition
spirituality
-0.2
Figure 26. Spearman ρ and one standard error bars between belief and the other 15 questionnaire items.
As mentioned earlier, one advantage in having a large dataset to work with is that it allows us to conduct a test-retest examination of the personality–performance correlates. Specifically, for all of the psi tests resulting in significant test-retest personality– performance correlates, I combined those correlates across tests to investigate personality relationships in general. For the Card Test, first all users were selected who had contributed at least 25 trials and had also filled out all questionnaire items. Then these users were sorted alphabetically by UserID and the resulting datafile was split into two parts. A Spearman ρ was calculated for each questionnaire item vs. the observed hit rates. The statistical package used to calculate the Spearman ρ was limited to 8,000 pairs of datapoints (Statistica 4.3), so in all of these calculations only the first 8,000 datapoints in each of the two datafiles were used. Table 4 shows the results for the Card Test. The Pearson correlation between the t scores of the first test (left part of Table 4) and the second test (right part) was significant, with r = 0.50, t(14 df) = 2.15, p = .02 (one-tailed), thus the observed correlations may be considered reliable.
Dean Radin © 2002
January 15, 2002
Page 16/23
Item
N1
ρ1
t(N-2)
p-level
N2
ρ2
t(N-2)
p-level
combined
belief
8000
0.021
1.84
0.07
8000
0.022
2.01
0.04
2.72
precog
8000
0.008
0.68
0.49
8000
0.016
1.42
0.16
1.48
meditation
8000
0.012
1.04
0.30
8000
-0.006
-0.49
0.62
0.39
movement
8000
0.020
1.78
0.08
8000
0.007
0.58
0.56
1.67
creative
8000
0.003
0.23
0.82
8000
0.000
-0.03
0.97
0.14
lucky
8000
-0.018
-1.57
0.12
8000
-0.019
-1.66
0.10
-2.29
intuition
8000
-0.022
-1.97
0.05
8000
0.004
0.35
0.73
-1.15
religious
8000
-0.009
-0.77
0.44
8000
0.004
0.33
0.74
-0.31
spiritual
8000
-0.007
-0.67
0.50
8000
-0.008
-0.68
0.50
-0.95
sports
8000
-0.014
-1.22
0.22
8000
0.001
0.12
0.90
-0.78
scientist
8000
0.001
0.07
0.94
8000
0.000
0.01
0.99
0.06
rv train
8000
0.016
1.43
0.15
8000
0.024
2.18
0.03
2.55 1.38
rv use
8000
0.017
1.55
0.12
8000
0.004
0.39
0.69
psi expt
8000
0.015
1.31
0.19
8000
0.006
0.53
0.59
1.31
time meta
8000
0.004
0.39
0.70
8000
0.002
0.14
0.88
0.38
laterality
8000
-0.011
-0.99
0.32
8000
0.014
1.24
0.22
0.17
Table 4. Spearman correlations for questionnaire items vs. performance in the Card Test, as measured by overall hit rate per person. The column at the right labeled “combined” is the Stouffer Z equivalent after combining the t scores resulting from the first (left) and second (left) independently calculated Spearman correlations.
For the Location Test, all users were determined who had contributed at least 20 trials and filled in all of the questionnaire items. The resulting dataset was then split into two (approximately). The Pearson correlation between the t scores of the first and second tests was r = -0.13, t(14 df) = -0.51, p = 0.69 (one-tailed), thus the test-retest results were in the negative direction and the correlations could not be considered reliable. For the Remote Viewing Test, all users were determined who had contributed any number of trials with at least one word recognized by the associative thesaurus, and had filled in all questionnaire items. The resulting dataset was split into two. The Pearson correlation between the t scores of the first and second tests was r = 0.18, t(14 df) = 0.70, p = 0.25 (onetailed), thus while the test-retest results were positive, they were not significant and so the personality correlations were not reliable with respect to the Remote Viewing word-analysis method. For a second look at the Remote Viewing Test, all users were determined who had contributed any number of trials, had filled in the remote viewing descriptor items, and who had also filled in all questionnaire items. The resulting dataset was split into two. Table 5 shows the results of the Spearman correlations, where the independent variable was the Stouffer Z score resulting from the descriptor method of analysis. The Pearson correlation between the t scores of the first test (left part of Table 5) and the second test (right part) was significant, r = 0.44, t(14 df) = 1.82, p = 0.05 (one-tailed), thus the testretest results were significantly positive and the correlations were considered reliable.
Dean Radin © 2002
January 15, 2002
Page 17/23
Item
N1
r1
t(N-2)
p-level
N2
r2
t(N-2)
p-level
Combined
belief
8000
0.010
0.86
0.39
8000
0.026
2.32
0.02
2.25
precognition
8000
0.011
1.01
0.31
8000
-0.017
-1.52
0.13
-0.37
meditation
8000
0.007
0.67
0.50
8000
0.009
0.81
0.42
1.04
movement
8000
0.009
0.81
0.42
8000
0.024
2.11
0.04
2.06 -0.82
creative
8000
0.004
0.36
0.72
8000
-0.017
-1.52
0.13
lucky
8000
-0.002
-0.18
0.86
8000
0.003
0.28
0.78
0.07
intuition
8000
-0.009
-0.78
0.43
8000
-0.020
-1.78
0.08
-1.81
religious
8000
0.010
0.94
0.35
8000
-0.007
-0.60
0.55
0.24
spiritual
8000
0.000
-0.02
0.98
8000
-0.004
-0.33
0.74
-0.25
sports
8000
0.014
1.25
0.21
8000
0.013
1.18
0.24
1.72
scientist
8000
0.016
1.40
0.16
8000
0.017
1.49
0.14
2.05
rv train
8000
0.019
1.66
0.10
8000
0.001
0.12
0.90
1.26
rv use
8000
0.025
2.19
0.03
8000
0.009
0.82
0.41
2.13 0.88
psi expt
8000
0.006
0.49
0.62
8000
0.008
0.75
0.45
time meta
8000
0.010
0.88
0.38
8000
-0.008
-0.70
0.48
0.12
laterality
8000
-0.009
-0.83
0.40
8000
-0.006
-0.55
0.58
-0.98
Table 5. Spearman correlations for questionnaire items vs. performance in the Remote Viewing Test, as measured by overall Stouffer Z score per person using the descriptor evaluation method.
Now, because the Card Test and Remote Viewing Test (descriptor method) correlations showed reliable test-retest results, a single Stouffer Z was formed for each personality variable by combining the Spearman ρ results7 across the two tests. This allowed an examination of questionnaire items that might predict psi performance in general (or at least for these two tests). Figure 27 shows the results in graphical form. The first three items withstand a Bonferroni correction for multiple analyses: self-reported belief in psi (z = 3.6, p = 0.0002), involvement in remote viewing training (z = 2.7, p = 0.003), and involvement in the movement arts (z = 2.7, p = 0.003). The other correlations were nonsignificant, although surprisingly the intuition item was nearly negative significant.
7
More precisely, the z-transformed probabilities of these correlations.
Dean Radin © 2002
January 15, 2002
Page 18/23
4 3
z score
2 1 0 -1 -2
intuition
lucky
spiritual
laterality
creative
religious
time meta
sports
precog exp
meditation
scientist
psi expt
rv use
movement
rv train
belief
-3
Figure 27. Combination of personality results across the Card Test and Remote Viewing Test (descriptor method), in terms of z scores. After correction for multiple testing, the first three items remain significant: belief, remote viewing training, and involvement in movement arts.
Environmental Correlates This analysis examined the relationship between daily average performance in each test vs. the natural log of the planetary geomagnetic Ap index, per day.8 The geomagnetic indices were downloaded from the National Oceanic and Atmospheric Administration’s web site, www.sel.noaa.gov. The following graphs show this correlation for data collected between August 28, 2000 and September 28, 2001. Figure 28 shows the correlations for daily overall z scores observed in Card Test data, along with leading and lagging the Ap indices for plus and minus 9 days as a control. Figure 29 shows the same correlation for the Location Test data and Figure 30 for the Remote Viewing data (concept metric analysis method).
8
Log of Ap is used, rather than the Ap index itself, because the distribution of daily Ap values is highly skewed.
Dean Radin © 2002
January 15, 2002
Page 19/23
0.06 0.04
correlation
0.02 0.00 -0.02 -0.04 -0.06 -0.08 -0.10 -0.12 -9 -8 -7 -6 -5 -4 -3 -2 -1 0 1 2
3 4 5 6 7
8 9
day of test
Figure 28. Correlations between daily average hit rate on the Card Test vs. ln(Ap). 0.06 0.04
correlation
0.02 0.00 -0.02 -0.04 -0.06 -0.08 -0.10 -0.12 -9 -8 -7 -6 -5 -4 -3 -2 -1 0 1 2
3 4 5 6 7
8 9
day of test
Figure 29. Correlations between daily combined z score on Location Test vs. ln(Ap). 0.08 0.06
correlation
0.04 0.02 0.00 -0.02 -0.04 -0.06 -0.08 -0.10 -9 -8 -7 -6 -5 -4 -3 -2 -1 0 1 2 3 4 5 6 7 8 9 day of test
Figure 30. Correlations between daily combined z score for RV word association method vs. ln(Ap).
Figure 31 shows the combined z scores for these correlations (t → z, and then use of the Stouffer Z method), and Figure 32 shows the odds associated with these z scores. Overall, this result confirms many previous studies (e.g., Spottiswoode, 1990) indicating the presence of a negative correlation between psi performance and fluctuations in the Earth’s geomagnetic field.
Dean Radin © 2002
January 15, 2002
Page 20/23
2.0 1.5
Stouffer Z
1.0 0.5 0.0 -0.5 -1.0 -1.5 -2.0 -2.5 -3.0 -9 -8 -7 -6 -5 -4 -3 -2 -1 0
1
2
3
4
5
6
7
8
9
day of test
Figure 31. Stouffer Z scores associated with the combined results for the Card Test, Location Test, and Remote Viewing (concept metric method) correlations. 350 300
odds
250 200 150 100 50 0 -9 -8 -7 -6 -5 -4 -3 -2 -1 0
1
2
3
4
5
6
7
8
9
day of test
Figure 32. One-tailed odds associated with the Stouffer Z scores in Figure 35.
Discussion One goal in conducting these tests was to study implementation and analytical issues associated with development of long-term, online, mass psi experiments. That goal was amply achieved. Another goal was to provide large sample-size, long-term, continuous datasets to allow investigation of correlations between psi performance and environmental and personality variables. The Sheep-Goat effect, or the effect of a priori belief in psi, was strongly supported, with a combined result of z = 3.6, p = 0.0002; similarly, the predicted negative correlation with geomagnetic flux was supported at a combined result of z = 2.75, p = 0.003. While many of the other predicted personality correlates were not confirmed, those predictions were more speculative as there is far less prior research available on the performance effects of those personality factors. Lessons learned These Web-based psi tests collected more data in one year than all of the ESP tests conducted over 60 years by Rhine and his colleagues (Pratt, Rhine, Smith, Stuart & Greenwood, 1940). The reason, of course, is that the Web is accessible to hundreds of Dean Radin © 2002
January 15, 2002
Page 21/23
millions of people around the world. Another reason, which has distinguished this suite of tests from a handful of other Web-based psi tests, is the daily Halls of Fame. Judging from nearly a thousand unsolicited email notes received about the tests, many participants enjoyed tracking their daily performance over time. For about 9 months, these tests also included a cumulative, All-Time Hall of Fame for the Card and Location Tests. Unfortunately, the CPU computation time required to regenerate these Halls on demand became prohibitive due to the large number of trials collected, so only Daily Halls of Fame are currently provided. Another successful feature was the simplicity of the test designs, both in terms of the user interface and the underlying programming. The experimental system required daily tweaking for about two months to get it to run reliably and calculate the Halls of Fame without manual intervention. After the basic programs were working smoothly, only a few major changes were required to ensure that the target selection methods were adequately random, and to plug potential programming loopholes. Today the system is completely automated; rare failures are caused by unusually high access demands placed on the server due to the test site being mentioned in the print or broadcast media. The main short-coming of these tests, at least for scientific hypothesis testing, is the extent to which optional stopping behavior permeates the database. This confounds any form of proof-oriented analysis on tasks where feedback is provided. While I expected some optional stopping, I underestimated its pervasive biasing influence because I failed to take into account the very high statistical power afforded by collecting trials not in the thousands, but in the millions. My misjudgment was probably due to the fact that having too much statistical power is a problem seldom encountered in laboratory tests. A second weakness was again due to a risk associated with very high statistical power. I discovered that any bias in the analytical methods, either due to a violation of statistical assumptions or inadequate precision in the way that the computer stores and processes numbers, quickly overwhelms any underlying effects of interest. A third area that needs improvement was also expected to some extent, but the amount of time it took to address it was underestimated. The problem may be stated as a corollary of Murphy’s Law: Any weakness in a freely accessible, Web-based experiment will be exploited, no matter how apparently inconsequential that weakness may be. Over time, I discovered that users intentionally or inadvertently tried dozens of ways to break the online tests. Most of the “attacks” required simple modifications to the underlying Perl scripts to prevent the problem from reoccurring. I estimate that the sole purpose of about 30% of the code is to help ensure data integrity.
Conclusions Preliminary analysis of the first year’s worth of data collected in a suite of mass psi experiments indicates that Web-based tests are a valuable tool for conducting psi research. The benefits include enormous amounts of data collected quickly and inexpensively, the ability to provide individualized targets and feedback, and reasonably secure data collection. The longitudinal datasets are ideal for exploring environmental correlates of human performance, and for studying personality and experiential correlations of performance. Dean Radin © 2002
January 15, 2002
Page 22/23
These benefits have not been overlooked by other behavioral researchers. By May 1999, there were at least 65 standard psychological experiments running on the Web, including studies in social, cognition, sensation/perception, health, clinical, personality, industrial, organizational, and developmental psychology (Birnbaum, 2000). Early studies indicate that certain types of Web-based psychology studies are at least as valid as laboratory tests, if not more so (Krantz & Dalal, 2000). The same appears to be true for psi experiments.
References Birnbaum, M. H. Ed. (2000), Psychological Experiments on the Internet, San Diego: Academic Press, 2000. Jahn, R. G. & Dunne, B. J. (1987). Margins of reality, New York: Harcourt Brace Jovanovich. Johnson, D. (1977). PLATOnic parapsychology. The Daily Illini, November 19, 1977, p. 2. Kiss, G.R., Armstrong, C., Milroy, R., and Piper, J. (1973) An associative thesaurus of English and its computer analysis. In Aitken, A.J., Bailey, R.W. and Hamilton-Smith, N. (Eds.), The Computer and Literary Studies. Edinburgh: University Press. Krantz, J. H. & Dalal, R. (2000). Validity of Web-based Psychological Research. In Michael H. Birnbaum (Ed.), Psychological Experiments on the Internet, San Diego: Academic Press, 2000. Lawrence, T. (1993). Bringing in the sheep: A meta-analysis of sheet/goal ESP Studies, 1947-1993. Proceedings of Presented Papers, Parapsychological Association Annual Conference, Toronto, Canada, pp. 75-86.. Loye, D. (2000). An Arrow Through Chaos: How We See into the Future, Inner Traditions Intl. Milton, J. (1994). Mass-ESP: A meta-analysis of mass-media recruitment ESP studies. Proceedings of Presented Papers, Parapsychological Association Annual Convention, August 7-10, 1994, University of Amsterdam, p. 284 - 292. Neuringer, A., & Voss, C. (1993). Approximating chaotic behavior. Psychological Science, 4(2), 113119 Pratt, J. G., Rhine, J. B., Smith, B. M., Stuart, C. E., & Greenwood, J A. (1940/1966). Extra-sensory perception after sixty years. Boston: Bruce Humphries. Radin, D. I. (1988). Effects of a priori probability on psi perception: Does precognition predict actual or probable futures? Journal of Parapsychology, 52, 187 - 212. Rebman, J. M., Radin, D. I. & Stevens, P. R. (August, 1996). A precognition experiment on the World Wide Web. Proceedings of Presented Papers, Parapsychological Association Annual Convention, August 17-20, 1996, Handlery Hotel, San Diego, CA, p. 207 - 218. Schmeidler, G. R. (1943). Predicting good and bad scores in a clairvoyance experiment: A preliminary report. Journal of the American Society for Psychical Research, 37, 103-110. Spottiswoode, S. J. P. (1990). Geomagnetic activity and anomalous cognition: A preliminary report of new evidence. Subtle Energies, 1, 65-77. Steinkamp, F. (1999). Testing Clairvoyance and Precognition by Manipulating Probabilities: A Conceptual Assessment of the Experimental Literature, Journal of Parapsychology, 63. Thorndike, E.L. and Lorge, I. (1944). The teacher's Word Book of 30,000 Words. Teachers College, Columbia University, New York Wackermann, J., Benthin, R. & Pütz, R. (2001). An ESP experiment with the sequential card search task. In C. Alvarado (Ed.) The Parapsychological Association Proceedings of Presented Papers, August 2-4, 2001,Metropolitan Hotel, New York, NY, p. 334-348. Wiseman, R. & Greening, E. (2001). The mind machine. In C. Alvarado (Ed.), The Parapsychological Association Proceedings of Presented Papers, August 2-4, 2001, Metropolitan Hotel, New York, NY, p. 377-392.
Dean Radin © 2002
January 15, 2002
Page 23/23