EMPOWERMENT AND WEB BASED EVALUATION
MELISSA EILER & DAVID FETTERMAN SCHOOL OF EDUCATION STANFORD UNIVERSITY
[email protected] [email protected]
PRESENTED AT THE AMERICAN EVALUATION ASSOCIATION, HONOLULU, HAWAII, NOVEMBER 1-4, 2000. NOVEMBER 2, 2000, SCHOOL OF EDUCATION, STANFORD UNIVERSITY
Introduction There are a growing number of tools available to help program staff members and participants conduct their own evaluations1. One of the most useful tools is free online survey programs. They are being used, in part, to enhance empowerment evaluations and in the process facilitate organizational learning and capacity building. Web based survey instruments facilitate empowerment and other forms of organizational learning and evaluation, because they have the capacity to: ! ! ! ! ! !
Facilitate quick turnaround of evaluation findings thus enhancing feedback loops; Act as highly accessible tools for monitoring change over time; Promote inclusion of stakeholders because of the low cost and accessibility of the tools; Expand the range and depth of inquiry Promote efficiency and effectiveness of decision-making Demystify and increase evaluation use.
Each of these features resonates with the goals and processes embodied in empowerment evaluation. This discussion begins with a brief discussion about empowerment evaluation in order to situate and contextualize the use of web-based survey tools. Empowerment Evaluation Empowerment evaluation is designed to help staff members and participants challenge underlying assumptions in order to solve problems in the social context in which they exist. Evaluation coaches and facilitators typically assist them. However, the focus of the effort remains in the hands of program staff members and participants. Fetterman (2000) highlights the value of empowerment evaluation as a vehicle to enable organizations to institutionalize evaluation as part of their planning and management. According to Fetterman (2000): Empowerment evaluation is the use of evaluation concepts, techniques, and findings to foster improvement and self-determination…Empowerment evaluation has an unambiguous value orientation: It is designed to help people help themselves and improve their programs using a form of self-evaluation and reflection. …Empowerment evaluation is necessarily a collaborative activity, not an individual pursuit…Empowerment evaluation can create an environment that is conducive to empowerment and self-determination. This process is fundamentally democratic in the sense that it invites (if not demands) participation, examining issues of concern to the entire community in an open forum…By internalizing and institutionalizing selfevaluation processes and practices, a dynamic and responsive approach to evaluation can be developed… (p. 3).
Empowerment evaluation not only solves problems, it builds local capacity. Usher highlights the value of using empowerment evaluation to build capacity and explains: 1
A list of some of these tools is available on the American Evaluation Association's Collaborative, Participatory, and Empowerment Evaluation TIG web page.
PAGE 1
By developing the capacity to monitor and assess their own performance, program managers and staff can risk the mistakes that often occur with innovation. This is because they can detect problems and make midcourse corrections before the results of errors due to planning or execution become widely apparent and costly. Having the capacity and responsibility to obtain such information about program operations and impact thus empowers managers and staff to explore new ways to enhance their performance (pp. 62-63).
The following discussion highlights the power of technology as a tool to foster empowerment evaluation and organizational learning in the process. High-Tech Tools Technologically-based evaluation methodologies can act as tools through which capacity building is enhanced. Evaluation utilization theory is based on a conception of evaluation as “a continuous information dialogue” whereby program evaluators and stakeholders share responsibility for “generating, transmitting, and consuming evaluation information” (Shula and Cousins, 1997, p. 197) Technology can play a useful role in each of these functions – generation, transmission, and consumption. The methodologies discussed below can facilitate feedback loops, providing timely and relevant data that reflects an inclusionary approach to design, collection, and analysis. Specifically, the use of on-line surveys which are easily created using free software offered over the internet, alters the way in which data are collected and used. On-line survey instruments allow survey design, data collection, analysis of survey data, and graphical representation of the data automatically. Also, frequency data can be downloaded to other software programs such as Excel and SPSS for more advanced analysis. Zoomerang (http://www.zoomerang.com), Formsite (http://www.formsite.com), Bitlocker (http://www.bitlocker.com) are online surveys that are easily access and administered through the internet. On-line surveys do not merely replace paper-based surveys; rather, they alter the entire survey process and use of survey data. On-line surveys can be expected to: facilitate quick turnaround: serve as highly accessible and user-friendly tools to monitor change over time; promote inclusion of stakeholders because of the low cost and accessibility of the tools; expand the range and depth of inquiry; promote efficiency and effectiveness of decision-making; and demystify and increase evaluation use. Quick turnaround. Online surveys dramatically decrease the turnaround time normally associated with traditional survey research. The time involved in creating, distributing, and collecting surveys as well as the time involved in analyzing and disseminating survey results is significantly less than in paper-based survey research. Reduced turnaround time increases the likelihood that data will be available when decisions are made. Feedback loops are strengthened when the flow of data is not constrained by the slow turnaround often characteristic of survey efforts.
PAGE 2
In one case example, an evaluation of a nonprofit that facilitates links between researchers and nonprofits, the decision makers could view the graphically represented findings online as the data was being entered. In another case example described below, an elementary teacher education feasibility study, the window for decision making was extremely small. However, with the use of online surveys, the data needed was secured in a matter of hours. In essence, we were able to provide the decision makers with the data necessary to determine that there was enough demand for this program to proceed to a planning phase of the effort. This kind of turnaround time, in both cases, was the difference between the data being used or not used by program staff members and key decision makers. Accessibility. These tools can act as highly accessible tools for monitoring change over time. A wider range of individuals is likely to use this type of tool to collect, analyze, and report data, because on-line survey instruments are available on the internet, userfriendly, cost very little or nothing to use, and instantaneously provide analysis of the data. Specifically, program participants and other stakeholders, not just evaluators, can conduct survey research. The on-line survey eliminates the need for survey creation software, time-consuming data input and analysis, complex and costly follow-up concerning individuals who do not complete the survey on the first wave, as well as the costs of disseminating results. A critical friend with evaluation experience is still initially needed to help program participants and staff members construct useful and valid surveys, however, little, if any, assistance is required to use and maintain these surveys. Inclusion of stakeholders. Online surveys substantially broaden the scope of stakeholders included in survey research. This is accomplished in part by the ease in which stakeholders can be contacted and asked to complete a survey. In addition, minimizing the costs associated with contacting marginalized stakeholders (with email requests as compared with postal requests and telephone calls) increases the probability of including marginalized stakeholders. (This assumes stakeholder access to computers. The implication of this assumption will be great in certain contexts, but will diminish over time.) Expansion of the range and depth of inquiry. The range and depth of inquiry feasible through survey research is expanded exponentially by reducing the costs associated with asking open-ended questions. On paper-based surveys, open-ended questions are often avoided because of the difficulty associated with scanning and analyzing such data. Because responses are typed by respondents and downloadable into a variety of software packages, responses are not only more legible and but also easily analyzed using software such as Nud•ist and Ethnograph. Efficiency and effectiveness of decision-making. The on-line survey tools promote timely and informed decision-making by: 1) Providing reliable and on-going feedback on programs in a fraction of the time usually associated with survey research.
PAGE 3
2) Increasing the degree to which decision-makers and participants interact with the evaluation data. Rather than having to wait for a report, decision-makers and participants have on-line access to data as it is submitted. 3) Offering highly accessible media – webpages and email2-- to view evaluation findings. Cronbach’s (1981) comments underscore the value of the expediency of such tools. “…We advise the evaluator to release findings piecemeal and informally to the audiences that need them. The impotence that comes with delay may be a greater risk than the possibility that early returns will be misread.” (Cronbach, 1981, p. 3) This concept in further highlighted by a case example from a research study at Stanford University. Last year, a research team at Stanford’s School of Education (SUSE) was scheduled to present to the faculty a proposal for implementing an elementary teacher education program. The proposal was expected to encounter some resistance from faculty concerned about the resources needed for such a program. The research team had a solid proposal based on a year of research into exemplary elementary teacher education programs throughout the country, as well as considerable insight into resources available at Stanford for implementing such a program. However, one month before the faculty presentation the team realized there was no data showing student interest in such a program. Two of the team members suggested an on-line survey to the undergraduates to assess the student interest in a five-year co-terminal program. The rest of the team, understandably, had not thought a survey was possible in such a short time, but agreed that such data would be a major asset to the presentation. The survey was created in one day. The following day, the draft survey was emailed to the research team to solicit their feedback. Changes were made and a day later, the survey was emailed to all Stanford undergraduates.
2
The anonymity of respondents can be protected using available technology.
PAGE 4
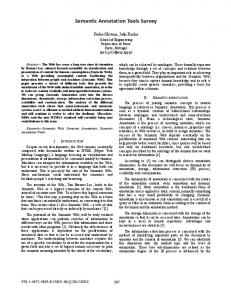
Figure 1. This is an online survey form. Respondents are asked to complete the survey on the web and submit it electronically. Once submitted it enters a data base and is sorted automatically.
By the end of the third day, we had responses and analyzed data from approximately 300 undergraduates interested in the proposed program. (The survey was sent to all undergraduates with the intent being that only undergraduates interested in an elementary teacher education program would respond.) The research team was given the URL for viewing the histograms (automatically generated by the on-line survey software) for each of the multiple choice and mark all-that-apply questions. Open-ended responses were also viewable on-line. We closed the data collection after receiving responses from as many undergraduates as necessary for our purposes
PAGE 5
Figure 2. This is a bar chart automatically generated by the online survey software. This allows the user access to a graphic representation of the preliminary findings instantaneously.
The histogram and quotes from open-ended responses were added to the report and overhead power point slides. The report, then, had all the components, including a market survey, we thought necessary to make a convincing argument for the program before the SUSE faculty.
Caveats and Suggestions The use of on-line survey software presents researchers with some issues that are not typically encountered when doing paper-based survey research. Three primary issues -distribution, calculation of response rates, and coding -- associated with on-line surveys are discussed below. The first issue involves survey distribution. Distribution of the on-line survey is typically through an email to a distribution list. The email typically includes an explanation of the purpose of the survey and any confidentiality and informed consent language that is necessary/appropriate. The email also includes the link to the survey URL. Sending out a reminder email a few days or a week after the first email is generally fruitful in terms of responses. However, the researcher must consider the implication of sending out
PAGE 6
additional emails. With the deluge of emails from various list servs and advertising campaigns, many individuals are sensitive to “spamming” and thus may take offense at receiving multiple emails from a researcher they may not know. The best policy is to consider your audience’s right to privacy and the expected marginal return from additional reminder emails. A decision to send additional emails should be a product of a carefully weighing these factors. (This is predicated on being introduced over the net by the sponsor and/or management.) Another issue related to distribution through email is the appearance of recipient names on emails sent. In most cases, the evaluator will want to protect the anonymity of the survey receipts. A simple way to conceal the names of survey recipients is to “blind copy” (bcc:) every recipient and place one’s own email in the regular “send to” field. By doing so, survey recipients will only see one email address – that of the individual who sent it. Second, calculating response rates can be challenging, depending on the means of distribution. This is due to the fact that there is no limit to the number of surveys that are “printed” and "disseminated" as is the case with paper-base survey research. Some evaluators will chose to place a link to an on-line survey on a website. For example, one might place a link to a member satisfaction survey on their organization’s website. In this scenario, the researcher would be able to determine how many respondents there are (the numerator in response rate), but calculating the total number who received the survey is questionable (the denominator in the response rate). There is no way to know how many “received” the survey. The researcher will be limited in making the response rate calculation in this case. Thus, if response rate is important to the evaluation, the evaluator will need to control the distribution of the survey URL. This control can be achieved by giving the URL to only a selected sample, either through email, regular mail, etc. Third, coding on-line surveys is not as straightforward as coding paper-based surveys. Currently, there is no way to place a unique code on each on-line survey; each on-line survey is the exact same. If coding each survey is an important part of the survey research, the researcher can provide each potential respondent a code (though email or in a letter, for example) that the respondent would enter into a designated field on the online survey. To ensure that each respondent actually enters the code, the on-line survey can be set-up to allow submission only if this code is entered. Just as online surveys change the way we conduct research, there are many lessons to learn as we adapt surveys to this new environment. We have identified a few in order to highlight the work that needs to be done to refine the use of online surveys. Conclusion The technological tools described in this discussion can foster dialogue and effective decision-making as well as and engagement in participatory, collaborative, and empowerment evaluations. User-friendly on-line survey software can serve to bolster the efforts of evaluators who are serious about inclusion and utilization. Technology, then,
PAGE 7
acts as a conduit for these theories of evaluation, as an added mechanism for putting theory into practice. These tools have helped to create simple and highly accessible feedback loops that enhance the ability of program participants, staff members, and decision-makers to engage in democratic pluralistic decision-making. They have done so by helping to create both “networks and information channels to make transmission” of evaluation information possible as well as “formal dialogues between decision makers and information gatherers that maximizes mutual understanding” (Schein 1996). Theoretically, these tools can be used to help people learn more about their own organizations and themselves as they engage in a social inquiry resulting in action.
PAGE 8
References Argyris, C. and Schon, D. (1978). London: Perspective.
Organizational Learning:
A theory of action.
Cronbach, L.J. et al (1981). Toward reform of program evaluation. San Francisco, CA: Jossey-Bass. Fetterman, D.M. (2000). Foundations of Empowerment Evaluation. Thousand Oaks, CA:Sage. Greene, J.C. (1997). Evaluation as Advocacy. Evaluation Practice, 18(1), 25-35. Mezirow, J. (1978). Education for perspective transformation: Women’s re-entry programs in community settings. New York: Columbia University Teachers College, Center for Adult Education. Patton, M. (1994). Developmental evaluation. Evaluation Practice, 15(3), 311-320. Shula, L.M. and Cousins, J.B. (1997). Evaluation Use: Theory, Research, and Practice Since 1986. Evaluation Practice, 18 (3), 195-208 Torres, R.T., Preskill, H.S., and Piontek, M.E. (1996). Evaluation strategies for communicating and reporting: Enhancing learning in organizations. Thousand Oaks, CA: Sage. Schein, E.H. (1996). Organizational Learning: What is New?. Working Paper. MIT Sloan School of Management. (http://www.solonline.org/res/wp/10012.html) Schwandt, T.A. (1997). The Landscape of Values in Evaluation: Charted Terrain and Unexplored Territory. New Directions for Evaluation, 76, 25-39 Senge, P.M. (1990). The Fifth Discipline: Organization. New York, NY: Doubleday.
The Art and Practice of the Learning
Vanderplatt, M. (1997). Emancipatory politics, critical evaluation, and government policy. Canadian Journal of Program Evaluation, 12(2), 143-162.
PAGE 9