i
i
i
i
“main˙BTA” — 2017/5/15 — 10:46 — page 395 — #395
CHAPTER 13
Web-Based Tools for Exploring the Potential of Quantitative Imaging Biomarkers in Radiology
Intensity and Texture Analysis on the ePAD Platform Roger Schaer,a,⇤ , Yashin Dicente Cid⇤ , Emel Alkim† , Sheryl John† , Daniel L. Rubin† and Adrien Depeursinge⇤,⇤⇤ ⇤ University of Applied Sciences Western Switzerland (HES-SO), Institute of Information Systems, Sierre, Switzerland. ´ ⇤⇤ Ecole Polytechnique F´ed´erale de Lausanne, Biomedical Imaging Group, Lausanne, Switzerland. † Stanford University, Department of Radiology and Medicine (Biomedical Informatics), Stanford, CA, USA. a Corresponding:
[email protected]
Contents 1. Introduction 2. Methods 2.1. Overview of ePAD 2.2. Quantitative imaging features
396 399 399 402
2.3. Feature aggregation
404
2.4. Classification 2.5. Web technologies
405
2.6. System architecture
408
3. Use-cases 3.1. Analysis of whole ROIs
412
407
413
3.2. Patch-based ROI analysis
417
3.3. Training a statistical modal and classifying ROIs
418
3.4. Helper tools for segmentation
423
4. Discussion 5. Conclusions References
423 426 428
Abstract Recent papers in the field of radiomics showed strong evidence that novel image biomarkers based on structural tissue properties have the potential to complement and even surpass invasive and costly biopsy-based molecular assays in certain clinical contexts. To date, very few translations of these research results have been carried out. In addition, a majority of the identified imaging biomarkers are perceived as black boxes by end-users, hindering their c Elsevier Ltd. All rights reserved.
i
395
i
i
i
i
“main˙BTA” — 2017/5/15 — 10:46 — page 396 — #396
396
i
Biomedical Texture Analysis
acceptance in clinical and research environments. We present a suite of plugins for the openaccess cloud-based ePAD platform enabling the exploration and validation of new imaging biomarkers in a clinical environment. The latter include the extraction, visualization and comparison of intensity- and texture-based quantitative imaging features, regional division of regions of interest to reveal tissue diversity, as well as the construction, use and sharing of user-personalized statistical machine learning models. No software installation is required and the platform can be accessed through any web browser. The relevance of the developed tools is demonstrated in the context of various clinical use-cases. The software is available on request.
Keywords: Quantitative imaging biomarkers, radiomics, texture analysis, medical imaging, radiology, web technologies, machine learning.
1. Introduction Modern multi-dimensional imaging in radiology yields much more information than the naked eye can appreciate. As a result, errors and variations in interpretations are currently the weakest aspect of clinical imaging. Computerized quantitative image analysis may provide solutions for ensuring the quality of medical image interpretation by yielding exhaustive, comprehensive and reproducible analysis of imaging features, which spawned the new fields of radiomics and imaging genomics [15] (see Chapter 8). It has the potential to complement, and possibly even surpass invasive biopsy-based molecular assays with the ability to capture intralesional heterogeneity in a non-invasive way [12]. Two large initiatives have recently been created in North America to coordinate and promote research and development of quantitative imaging methods for cancer: the Quantitative Imaging Network (QIN)1 from the National Cancer Institute (NCI), and the Quantitative Imaging Biomarkers Alliance (QIBA)2 from the Radiological Society of North America (RSNA). Although the research community in radiomics provided strong evidence that the novel imaging biomarkers may have a very high potential clinical value, very few translations of these biomarkers into clinical trials or medical practice were carried out so far. In 2012, the United States (U.S.) Food and Drugs Administration (FDA) issued a comprehensive report3 containing guidance for industry on how to describe and evaluate computer-assisted 1
http://imaging.cancer.gov/programsandresources/specializedinitiatives/qin, as of 5 December 2016. 2 https://www.rsna.org/qiba/, as of 5 December 2016. 3 http://www.fda.gov/RegulatoryInformation/Guidances/ucm187249.htm, as of 5 December 2016.
i
i
i
i
i
i
“main˙BTA” — 2017/5/15 — 10:46 — page 397 — #397
Web-Based Tools for Exploring the Potential of Quantitative Imaging Biomarkers in Radiology
397
detection devices applied to radiology data in order to obtain FDA approval. Quantitative imaging features can be difficult to interpret, as they can appear abstract to a medical doctor, since their meaning in the clinical context may not be directly obvious. It is very timely to develop front-end software enabling the exploration and validation of the imaging biomarkers in a clinical environment. Tools are required to allow experimentation with e.g., various features, parameter settings. Such tools can lead to a better understanding of relatively intangible numerical values. It may help in understanding which values are a↵ected by a certain pathology, how one value relates to another, how certain values generalize across a cohort of patients, or how a set of variables can di↵erentiate between an unhealthy patient and a control case. During the past 10 years, an increasing number of commercial, freeware and open-source quantitative imaging software for radiology data have been developed. Some of them are for general purpose, or either organ-, imaging modality-, or disease- specific. Noteworthy examples are listed in Table 13.1. Along with Original Equipment Manufacturer (OEM) image analysis software, some of the examples listed in Table 13.1 reported high acceptance and usefulness in the clinical environment. The market for these tools appears to be growing at a higher rate as compared to the equipment market4 . Most of current software available implementing quantitative biomarkers is based on image intensity and shape only. Moreover, the existing software applications leveraging structural tissue properties (i.e., image texture) are most often not easy to use for non-medical experts and do not have application-specific clinical workflows implemented (e.g., Slicer, Analyze, MeVisLab). In addition, they generally provide only basic texture features (i.e., Haralick, isotropic filtering), which have shown limited abilities to fully leverage multi-scale and directional texture patterns when compared to recent approaches in the field [5, 4, 20] (see Chapter 3). 4
http://www.marketsandmarkets.com/Market-Reports/medical-image-analysis-software -market-846.html, as of 5 December 2016. 5 http://amide.sourceforge.net/index.html, as of 5 December 2016. 6 http://analyzedirect.com, as of 5 December 2016. 7 Apollo Medical Imaging Technology, http://www.apollomit.com/mrm.htm, as of 5 December 2016. 8 https://code.google.com/archive/p/cgita/, as of 5 December 2016. 9 http://www.imageanalysis.org.uk/demo-dynamika as of 5 December 2016. 10 http://www.lifexsoft.org, as of 5 December 2016.
i
i
i
i
i
i
“main˙BTA” — 2017/5/15 — 10:46 — page 398 — #398
398
Biomedical Texture Analysis
Table 13.1: Overview of existing quantitative imaging software. Imaging software AMIDE5 Analyze6 Apollo MIT7 CGITA8 [10] Dynamika9 ePAD LifeX10 MaZda11 MeVis12 , MeVisLab13 Medis14 MIPAV15 mint Lesion16 Pie Medical Imaging17 Slicer18 TexRAD19 VIDA diagnostics20
Medical structure multiple multiple multiple multiple multiple multiple multiple multiple multiple cardiovascular multiple multiple cardiovascular multiple multiple lungs
Imaging modality multiple multiple CT, DCE-MRI PET, CT, MRI (DCE-) MRI multiple PET, CT, MRI multiple multiple multiple multiple multiple multiple multiple CT, MRI CT
Quantitative biomarkers intensity intensity, shape, texture intensity intensity, texture intensity intensity intensity, texture intensity, texture intensity, shape, texture intensity, shape intensity, shape intensity intensity, shape intensity, shape, texture texture intensity, shape
License freeware commercial commercial open-source multiple open-source freeware open-source multiple commercial open-source commercial commercial open-source commercial commercial
Type standalone standalone multiple standalone cloud cloud standalone standalone multiple standalone standalone multiple standalone standalone cloud cloud
The electronic Patient Annotation Device (ePAD) imaging platform21 [21, 22, 18] is a freely available quantitative imaging informatics platform, developed by the Rubin Lab at Stanford University. Its main objectives include providing a rich web client application that runs on any modern browser and does not require software installation on the client side, catalyzing the adoption and use of quantitative imaging data in clinical practice and providing a flexible architecture enabling third-party developers to extend the capabilities of ePAD and adapt it to more specific needs and personalized use-cases. Thanks to its plug-in architecture, ePAD can be used to support a wide range of imaging-based projects. The platform has been widely used by radiologists at various academic centers in the United States and showed to provide state-of-the-art solutions for visualizing, collecting, annotating and sharing data between clinicians from multiple institutions. Using ePAD as an entry-point for medical doctors is appealing, as the system is accessible and usable from any computer and mimics the behavior of a standard ra11
http://www.eletel.p.lodz.pl/programy/mazda/, as of 5 December 2016. http://www.mevis.de, as of 5 December 2016. 13 http://www.mevislab.de, as of 5 December 2016. 14 http://www.medis.nl, as of 5 December 2016. 15 http://mipav.cit.nih.gov, as of 5 December 2016. 16 https://mint-medical.com/products-solutions/, as of 5 December 2016. 17 http://www.piemedicalimaging.com, as of 5 December 2016. 18 http://www.slicer.org, as of 5 December 2016. 19 http://texrad.com, as of 5 December 2016. 20 http://vidadiagnostics.com, as of 5 December 2016. 21 http://epad.stanford.edu, as of 5 December 2016. 12
i
i
i
i
i
i
“main˙BTA” — 2017/5/15 — 10:46 — page 399 — #399
Web-Based Tools for Exploring the Potential of Quantitative Imaging Biomarkers in Radiology
399
diology image workstation closely. It provides the opportunity to easily set up and share an advanced collaborative environment for clinical and research purposes. It is therefore a convenient tool to let doctors interact and familiarize themselves with general-purpose imaging tools and features, allowing them to gain intuition from intensity or texture measurements that can at first seem very abstract, but which can carry a lot of information and meaning in a given context. We also aim to provide medical doctors with tools that can be used to create personalized machine learning models for a given study, giving full control to the doctor of what should or should not be included in a given model for classification. This is in contrast with recent developments in the fields of big data and deep learning, where e↵ective models can be achieved, but understanding the inner decision rules of the algorithms can be difficult to grasp. Moreover, deep learning methods require large amounts of data for building the models, which significantly complicates the investigation of novel promising imaging biomarkers. Using simple models that can be efficiently trained with small amounts of data (e.g., Support Vector Machines (SVM)) allows for quick evaluation of the relevance of a given quantitative imaging measure in a user-defined applicative context. Our main goal is to provide tools allowing medical doctors and researchers to explore and understand how to use quantitative imaging biomarkers in a specific medical application context (and especially texture biomarkers, which may be conceptually difficult to comprehend but can provide important cues for diagnosis of various pathologies). We developed a suite of plugins for the ePAD ecosystem and set up our own server architecture for performing complex computations and saving data for further analysis. The software is available on request.
2. Methods This section describes the architecture of the ePAD platform and the developed plugins. The implemented quantitative imaging features are described. The system set up and deployment, as well as the tools and libraries used are detailed.
2.1. Overview of ePAD This section presents a general overview of the ePAD platform with a focus on the web interface and its associated features. The ePAD web interface can be accessed from any modern browser and any location. The access to the platform is secured by a login and password, ensuring that only authorized users can visualize potentially sensitive data. Once the user has logged in, the main interface is shown. Fig. 13.1 depicts an overview of the interface, which is composed of the following sections: 1. Navigation menu - This menu provides access to the di↵erent views available in ePAD, such as the hierarchical structure of patients, their studies, images se-
i
i
i
i
i
“main˙BTA” — 2017/5/15 — 10:46 — page 400 — #400
400
i
Biomedical Texture Analysis
Figure 13.1: General overview of the ePAD web interface, highlighting the main areas: 1. Navigation menu, 2. Command toolbar, 3. Project list and 4. Workspace. ries and annotations under the menu entry Search (see Fig. 13.1). Other views include a global list of all annotations (menu entry Annotate) and the Digital Imaging and Communications in Medicine (DICOM) image viewer (menu entry Display). An Edit menu entry provides common actions for any item in the platform (e.g., Delete, Copy & Paste, Undo). 2. Command toolbar - This contextual toolbar provides di↵erent options depending on the current view. It allows uploading files in the Search or Annotate view or navigating and manipulating DICOM images within the system’s image viewer, for instance. 3. Project list - Users can assign patients, plugins and other resources to various projects, allowing to group similar cases together for example. This panel allows the user to switch from one project to another, and to set up a collaborative environment in the context of a research project. 4. Workspace - This context-sensitive area will display the information of the currently selected view (e.g., image viewer, patient list). It constitutes the central area where most interactions with the user take place. The Display view containing the image viewer and annotation tools is where most user interactions will be performed. It allows visualizing and navigating in DICOM volumes, adjusting the window width and level, zooming in on specific areas of an image, Multi-Planar Rendering (MPR) visualizations, to name a few possibilities. It is also the main entry point for saving annotations and executing plugins. When saving
i
i
i
i
i
i
“main˙BTA” — 2017/5/15 — 10:46 — page 401 — #401
Web-Based Tools for Exploring the Potential of Quantitative Imaging Biomarkers in Radiology
401
Figure 13.2: Screenshot of the ePAD image viewer, showcasing several of the features such as drawing annotations, inverting the image, zooming and panning in the image as well as selecting a template for running a plugin. a region, a window will be shown allowing the user to enter information related to that annotation and selecting a template which is linked to a specific plugin in the back-end system. Fig. 13.2 shows an overview of the features provided in the viewer. 2.1.1. Typical workflow in ePAD This section presents a typical workflow for a medical doctor using the ePAD platform in clinical routine:
1. The user logs into the platform from his/her web browser. 2. DICOM image series can be uploaded to the platform by choosing local files, or entire studies can be pushed from the Picture Archiving and Communication System (PACS).
i
i
i
i
i
“main˙BTA” — 2017/5/15 — 10:46 — page 402 — #402
402
i
Biomedical Texture Analysis
Figure 13.3: Overview of a typical image series visualization and analysis workflow in ePAD. 3. The image series is opened inside the viewer, where several features are available, such as: • volumetric navigation, • adjust the window level settings for specific image types (e.g., lung, brain, abdomen), • invert pixel values, zooming, taking screen captures, • display metadata about the series as an image overlay, • annotate images with 2D ROI using several drawing tools. 4. Once an annotation has been drawn, the user can optionally call a plugin. A selection window allows choosing the type of information to provide about the annotation and which analysis to perform on the selected ROI. 5. The chosen plugin is executed and the user is notified about the status of the plugin’s state (started, running, complete, failed). 6. Depending on the plugin, various event types can be triggered in the browser once a plugin has completed. For example, a chart displaying the computed features can be shown. Fig. 13.3 shows a schematic overview of the workflow with screenshots of the ePAD interface.
2.2. Quantitative imaging features Various types of quantitative imaging features are implemented in the proposed ePAD plugins. This section details the basics of these image measurements and their relevance to practical use-cases. Two distinct feature groups are considered in the following subsections: intensity- and texture-based attributes.
i
i
i
i
“main˙BTA” — 2017/5/15 — 10:46 — page 403 — #403
Web-Based Tools for Exploring the Potential of Quantitative Imaging Biomarkers in Radiology
-1000 to -500, 50 bins
403
-1000 to -800, 20 bins
300 250
200
Count
i
i
150 100 50 0 -1000
-800
-500
Hounsfield Units (HU)
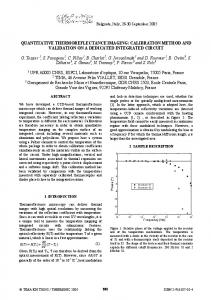
Figure 13.4: Two overlapping histograms of the same ROI with di↵erent upper bounds. The wide plot (gray) shows the distribution of values where the minimum and maximum edges of the histogram are set to -1000 and -500 HUs, with a bin size of 10 (i.e., 50 bins are generated). The narrower plot (blue) shows the distribution of values where the minimum and maximum edges are set to -1000 and -800 HU, with a bin size of 10 (i.e., 20 bins are generated). 2.2.1. Intensity-based features Intensity-based features are based on the statistical distribution of the pixel/voxel values (see Section 2.1 of Chapter 1). They are both fundamental and interpretable. In the context of the ePAD plugin development, we implemented two general-purpose intensity feature subtypes: Statistics and Histogram. The Statistics are meant to summarize of the intensity distribution of gray-levels within the chosen ROI. The first four statistical moments are computed to characterize the distributions: (i) mean, (ii) standard deviation (Std), (iii) kurtosis and (iv) skewness. Exact definitions and significance are detailed in Section 2.2.1 of Chapter 12. The Histogram shows the discretized distribution of gray-level values in the selected ROI and can be customized in two ways: setting the minimum and maximum values (i.e., bounds) of the histogram, and defining the resolution of the histogram (i.e., number of bins). This allows the user to focus on a given range of gray levels and to choose the level of detail of the chart. Fig. 13.4 shows an example of two histograms of the same ROI with di↵erent upper bounds in high-resolution chest Computed Tomography (CT). 2.2.2. Texture-based features Texture features are encoding the spatial transitions between the pixel/voxel values, which is independent from the distribution of the latter (see Fig. 1.1 of Chapter 1). Texture measurements are therefore complementary to their intensity counterpart. They
i
i
i
i
i
“main˙BTA” — 2017/5/15 — 10:46 — page 404 — #404
404
i
Biomedical Texture Analysis
provide exclusive cues for assessing e.g., diagnosis, prognosis, treatment response in a variety of diseases and imaging modalities [23, 5]. There is a large variety of methods for extracting quantitative texture measurements from medical images, and the most popular categories are extensively reviewed in Chapter 3. Two groups of texture measurements were integrated into the feature extraction plugins developed for ePAD. The first one is based on Gray-Level Co-occurrence Matrices (GLCMs), which estimates the statistics of gray-level co-occurrences between pixel pairs separated by a user-defined distance and direction. A detailed description and review is presented in Section 3 of Chapter 3. Thanks to their simplicity and interpretability, GLCMs are the most widely used group of texture measurements. In particular, GLCM statistics such as contrast or energy correspond to our intuitive perception of textured image patterns [14] (see Fig. 13.5). However, a major limitation of this feature group is their lack of ability to characterize transition between pixels that are far apart. It also requires drastic reduction and merging of the gray-level values, which can potentially result in a loss of information. Important parameters are the number of gray levels considered for the reduction (8, 16, 32) as well as the distance between pixels for computing the co-occurrences (e.g., 1, 2, 3). The GLCM measures are made invariant to image rotation by averaging the statistics over the four main image directions (0, 45, 90 and 135 degrees, see Section 3.1 of Chapter 3). The second texture group is based on Riesz wavelets. The latter are a subtype of convolutional approaches and can quantify image derivatives of any order and at multiple scales. Moreover, the image derivative are maximized for each position independently (i.e., the filters are “aligned” along dominant local orientations), allowing characterization of the local organization of image direction with invariance to the local orientation of anatomical structures (e.g., bronchovascular structures). The image derivatives have an intuitive interpretation and the Riesz features have shown to provide valuable imaging measurements in various medical applications [2, 6, 8, 1, 3, 19]. For instance, the first-order derivative measures the slope of the spatial transition between the pixel values, and the second-order measures the curvature of the transition. A detailed description and review is provided in Section 2.2 of Chapter 3. The important parameters are the alignment of the filters (yes/no), number of scales (e.g., 1, . . . , 5) and the order of the image derivatives (e.g., 0,1,2,3).
2.3. Feature aggregation Several strategies exist for aggregating features computed on a ROI. They are described in details in Section 3.1 of Chapter 1. For instance, the intensity or texture measurement can be averaged or counted over a user-defined ROI. However, averaging pixel-wise feature values over large ROIs containing mixed tissue type results in meaningless imaging measurements (see Section 3.2 of Chapter 2). To avoid this,
i
i
i
i
i
i
“main˙BTA” — 2017/5/15 — 10:46 — page 405 — #405
Web-Based Tools for Exploring the Potential of Quantitative Imaging Biomarkers in Radiology
405
GLCMs 1 0.87 0.81 0.78
0.82 0.76 0.75
0.75 0.64 0.60
0.51
0.50
0.5
0.32 0.25
0.19
0 Contrast
vascular
Correlation
mild emphysema
Energy
Homogeneity
mild ground glass
Figure 13.5: GLCMs features extracted from three full ROIs, showing global values for each of them. large ROIs can be automatically split into smaller patches to reveal the diversity of tissue types (e.g., tumor habitats [11]). To that end, two aggregating strategies are implemented for each feature extraction plugins. First, pixel-wise features can be aggregated over the entire ROI, yielding a single feature vector for the entire ROI (see Fig. 13.5). The second method divides ROIs into a series of small circular patches on which pixel-wise features are aggregated. This allows characterizing local tissue subtypes of the region. Feature-specific inter- and intra- regional variability can be visualized and investigated with scatter plots of the first two principal components. Principal Component Analysis (PCA) is computed over the collection of patches from the multiple regions. Fig. 13.6 illustrates how this method can be used to compare multiple regions.
2.4. Classification Apart from extracting visual features and displaying them to the user, two more ePAD plugins were developed for creating user-personalized machine learning models. A first plugin allows selecting a series of training ROIs and to build a SVM model. A second plugin allows the submission of one or several ROIs for classification. SVMs are able to learn maximum margin separating hyperplanes from a sparse number of training instances called support vectors. This learning rule showed to generalize well on unseen instances. It is therefore well suited to quickly explore the potential of a feature subset based on a small number of training ROIs. The Waikato Environment for Knowledge Analysis (WEKA) data mining software was used for the implemen-
i
i
i
i
“main˙BTA” — 2017/5/15 — 10:46 — page 406 — #406
406
Biomedical Texture Analysis
GLCMs (Patches) 0.25
0
PCA2
i
i
-0.25
-0.5 -1
0
1
PCA1 mild emphysema
mild ground glass
vascular
Figure 13.6: GLCMs features extracted from multiple ROIs split into circular patches. The feature vectors are transformed into a two-dimensional PCA space, where each patch is represented by a point in the scatter plot. tation of the SVM classifier [13]. The pairwise coupling strategy was used to output class-wise probabilities [24]. A two-phase approach was taken for the creation and use of SVM models, consisting of the following steps (see Fig. 13.7 for a detailed flowchart of the steps involved in the process). The beginning of the process is similar in both cases: the user selects one or more regions to train or classify, specifying a feature group (i.e., Statistics, Histogram, GLCMs or Riesz), as well as an identifier for the created model (e.g., “healthyVSabnormal Riesz”). Each ROI is then processed independently, and the initial steps include (i) extracting all the necessary information (ROI coordinates, DICOM image, patient data) from the annotation and associated metadata, and (ii) extracting features for each region (see Fig. 13.12). The computed feature vectors are persisted in the database. From that point onwards, the processes diverge between training and classification: 1. During the training process, the features of each ROI are collected in a data structure, normalized in [0, 1], and then used by the SVM library included in the WEKA toolkit to generate a model which can be used subsequently for classification. The model is then persisted as a file using serialization. 2. For the classification process, each ROI is classified using the previously generated model, and the results are collected in a data structure. A JavaScript Object Notation (JSON) file containing all the classification results is saved and then loaded by the client’s web browser to display the chart.
i
i
i
i
i
i
“main˙BTA” — 2017/5/15 — 10:46 — page 407 — #407
Web-Based Tools for Exploring the Potential of Quantitative Imaging Biomarkers in Radiology
407
Figure 13.7: Flowchart of the training and classification plugins’ processes.
2.5. Web technologies The ePAD platform is mainly based on two technologies. The first is a Java-based REpresentaional State Transfer (REST) Application Programming Interface (API) for the implementation of the system’s back-end: it handles all requests coming from plugins and clients using the front-end user interface. It exposes Create, Read, Update, Delete (CRUD) operations through HyperText Transfer Protocol (HTTP) endpoints for all aspects of the platform (e.g., users, patients, images, files, plugins, projects). It provides tools and utility methods for interacting with the other components of the platform such as the My Structured Query Language (MySQL) database, DICOM image repository, Annotation and Image Markup (AIM) annotations database. The second part is the front-end user interface. It is based on Google Web Toolkit (GWT), a development toolkit created by Google for developing complex browser-based applications without the need of advanced knowledge in web technologies such as Cascading StyleSheets (CSS), Javascript and HyperText Markup Language (HTML). It allows writing Java code which is then translated into Javascript and deployed to the browser. Several APIs are provided for handling communication, and widgets are
i
i
i
i
i
“main˙BTA” — 2017/5/15 — 10:46 — page 408 — #408
408
i
Biomedical Texture Analysis
Figure 13.8: Docker container architecture of the base ePAD distribution. available for the visual components (e.g., panels, lists, form controls, menu bars). For the development of our plugins, we used the Java Enterprise Edition (Java EE) platform, including Enterprise Java Beans (EJBs) for lifecycle management of the image processing and machine learning services, the Java Persistence API for ObjectRelational Mapping (ORM) and Java EE annotations for configuring components (e.g., stateless beans for web services or singleton beans for keeping one single shared reference to heavy MATLAB objects). The Highcharts22 library was used for generating attractive and dynamic charts. Highcharts is a powerful Javascript library for generating a variety of graphs and charts in 2D and 3D.
2.6. System architecture This section focuses on the technical architecture of ePAD and related plugin ecosystem. 2.6.1. Docker architecture The ePAD platform is based on Docker, which enables the packaging and deployment of applications inside software containers [16]. It allows running isolated processes in light-weight, self-contained, and single-purpose containers. The main advantages are the ease of deploying containers on any host running any operating system with a consistent behavior, as well as the ability to avoid conflicts between di↵erent system libraries and tools that may be required for running each process. Fig. 13.8 illustrates 22
i
http://www.highcharts.com/, as of 5 December 2016.
i
i
i
i
i
“main˙BTA” — 2017/5/15 — 10:46 — page 409 — #409
Web-Based Tools for Exploring the Potential of Quantitative Imaging Biomarkers in Radiology
409
how the system is designed. It is composed of the following docker containers: • ePAD web - This container runs the Java web server. It hosts both the user interface and the back-end of the ePAD platform. It includes a web service tier with a REST API, a GWT-based interface and utilities for communicating between the two tiers. • MySQL - This container runs an instance of the MySQL database system and is responsible for storing the organizational structures of ePAD (e.g., users, projects, image series, plugins, files). • DCM4CHEE - This container hosts the DICOM for Che Enterprise (DCM4CHEE) service, a Java EE-based DICOM archive. All uploaded DICOM image series and segmentations are stored in this repository. A web interface allows searching for patients and images. It is also linked to the ePAD web container for adding uploaded images to the repository. • eXist - This container runs eXist, a native eXtensible Markup Language (XML) database used for storing image annotations in the AIM format [17]. Combining and linking the four containers mentioned above constitutes the complete ePAD platform. 2.6.2. Plugin architecture There exist two main approaches for server-side ePAD plugin development: • Local plugins - These plugins are executed directly on the Java application server running the ePAD back-end. The main advantage of these plugins is data locality, but drawbacks include the dependency on the server’s runtime environment (installed libraries such as the MATLAB Compiler Runtime), as well as the risk of altering ePAD’s responsiveness when computationally heavy plugins are called. • Remote plugins - These plugins are executed on another server, and communication with ePAD is performed through HTTP calls. Advantages include the separation of concerns, running computations on a more powerful distant computer and being independent of the ePAD server’s runtime environment. Drawbacks include the necessity for transferring data across the network, which can increase the latency of the plugin. The second approach was chosen, as the benefits of running computations on an independent server with more power and being able to reuse the developed web services outside the scope of ePAD were very important for us. Each plugin consists of three parts: a Java plugin class that is integrated into ePAD, a web service class hosted on a remote application server, and a MATLAB routine that contains the image processing code. The MATLAB code is compiled into a Java library and added to the remote application server’s dependencies. Using this technique, only the royalty-free MATLAB Runtime Compiler, which requires neither to purchase nor to use MATLAB licenses for execution, is needed on the application server. Fig. 13.9 shows the architecture and interaction between the ePAD platform and the developed Java EE web service layer:
i
i
i
i
i
“main˙BTA” — 2017/5/15 — 10:46 — page 410 — #410
410
i
Biomedical Texture Analysis
Figure 13.9: Overview of the ePAD plugin architecture. 1. A plugin execution is started from within the ePAD Docker container, and the corresponding plugin class is called within the same container. 2. The container communicates via standard HTTP requests and responses with a remote Java EE server. 3. The Java EE server runs the plugin code (e.g., a MATLAB routine) and performs additional tasks such as persisting data in the database. 4. Plugin results are returned to the ePAD Docker container, where the user will be notified of the status of the plugin’s execution (success or failure). 2.6.3. Java EE for plugin development The Java EE application server is used for multiple purposes. It serves as the main resource for heavy computations required by certain plugins. The physical machine hosting the server has the following performance characteristics: • 2 x Intel(R) Xeon(R) Central Processing Unit (CPU) E7- 4820 @ 2.00 GigaHertz (GHz) processors (64 cores in total), • 128 GigaByte (GB) main memory, • Gigabit Ethernet network connection, • 550 GB Solid State Drive storage. The Java EE server architecture allows persisting all processed images, annotations, patients, along with computed features and generated results in a relational database for further analysis, reuse for training machine learning algorithms, extraction of statistics, etc. Fig. 13.10 shows a model of the various business objects involved in the persistence of image annotations and all linked metadata. It consists of the following main classes: • Person - abstract class defining the basic properties of a person, i.e., an identifier (for the database) and a name.
i
i
i
i
i
i
“main˙BTA” — 2017/5/15 — 10:46 — page 411 — #411
Web-Based Tools for Exploring the Potential of Quantitative Imaging Biomarkers in Radiology
411
Figure 13.10: Business objects of the Java EE plugin platform. • User & Patient - implementations of Person with additional fields (user ID and role for User, and personal information such as the birth date and sex for Patient). • ImageReferenceEntity - description and content of a DICOM image. • ImageAnnotation - properties and coordinates of ROIs. • QuantitativeImagingFeatures - representation of the computed visual features extracted by a quantitative image analysis plugin. • SVMClassifier - instances of SVM models built from one or more computed feature vectors stored in QuantitativeImagingFeatures. The persistence of business objects is fully managed through the Java Persistence API (JPA). Java EE contains several security mechanisms, allowing to ensure data privacy and security in all layers of the system (applicative, network transmission, storage). All components of the application (web services, business objects, image processing classes) are easily managed through the use of EJBs. Their execution environment (i.e., EJB containers) handles the role, scope and lifecycle of every components. Web Services and business classes used for short-lived operations are defined as stateless session beans. JPA entities are used to annotate business object classes for persistence. A singleton bean is used for managing the MATLAB factory, which initializes a unique reference to the heavy objects used for executing the MATLAB routines. Its lifecycle is as long as the application. The persistence bean contains a persistence context, which allows establishing a connection to the MySQL server and executing queries through the EntityManager interface. Fig. 13.11 shows the various EJBs and their links to other managed components of the system.
i
i
i
i
i
“main˙BTA” — 2017/5/15 — 10:46 — page 412 — #412
412
i
Biomedical Texture Analysis
Figure 13.11: Java EE EJBs. The stateless Web Service Resource (top) is used by the ePAD plugins using a web service client class. It holds references to the three main EJBs (MATLAB Bean, Persistence Bean and SVM Classifier Bean), which are obtained through dependency injection. The MATLAB Bean handles the call to the MATLAB routines using a singleton factory object. The Persistence Bean handles saving and reading the business objects described in Fig. 13.10 to the MySQL database. The SVM ClassifierBean handles the creation and reuse of SVM models using WEKA.
3. Use-cases This section describes the various plugins that were developed for the ePAD platform in the context of general-purpose use-cases. These plugins are designed to accelerate the exploration of quantitative imaging parameters’ value in diagnosis, prognosis or treatment planning tasks. The use-cases are divided in three major subsections. Section 3.1 describes various examples of (i) the extraction of intensity and texture measurements aggregated from whole user-defined ROIs, and (ii) the display of the latter in bar plots. Section 3.2 details the use of patch-based analysis to reveal the diversity of tissue components contained in user-defined ROIs with scatter plots. Section 3.3 illustrates the construction of personalized statistical models from a collection of userdefined ROIs and associated labels. The obtained models can be used to classify new ROIs with unknown labels.
i
i
i
i
i
i
“main˙BTA” — 2017/5/15 — 10:46 — page 413 — #413
Web-Based Tools for Exploring the Potential of Quantitative Imaging Biomarkers in Radiology
413
3.1. Analysis of whole ROIs The goal of this plugin is to allow medical doctors to annotate a specific region in a medical image and evaluate the value of associated quantitative imaging features. Fig. 13.12 details the process of executing the plugin and the interactions between the various layers of the application (ePAD front-end and back-end, Java EE server and EJBs, as well as the MySQL database). The process for one ROI is: 1. The user creates an image annotation and selects a feature extraction plugin to run based on various feature types. He/she clicks on a button to initiate the plugin execution. 2. The ePAD back-end receives this call, containing all the required information about the image, selected region, patient, etc. The input is transformed into an object sent (via an HTTP request) to the web service layer of the remote Java EE server. 3. The web service receives the query, parses the input parameters and calls the MATLAB Bean to execute corresponding the feature extraction routine. 4. Once feature extraction is complete, the received input data and the generated output results are sent to the Persistence Bean. 5. The Persistence Bean begins a transaction for saving all the supplied objects, connecting to the MySQL database and executing the appropriate queries to create or update rows. If any step of this procedure fails, the entire transaction is rolled back to ensure data integrity. 6. Once the objects have been persisted, the results are sent back to the web service layer, which will respond to the ePAD back-end with the computed features. 7. The ePAD back-end saves the computed features along with chart formatting parameters in a format that the Highcharts library can process, as a JSON file that is saved within the file hierarchy of ePAD. An event is then generated to inform the user that the plugin’s execution has completed. 8. The front-end receives the event and runs a query to receive the newly created JSON file from the back-end and renders the chart with the computed values and given configuration (see Fig. 13.13). Each feature type may contain one or more parameters that can be specified at runtime. The parameters of the plugin vary according to the selected feature category. Below is a list describing the currently available parameters: • All feature types
i
i
i
i
i
“main˙BTA” — 2017/5/15 — 10:46 — page 414 — #414
414
i
Biomedical Texture Analysis
Figure 13.12: Sequence diagram showing the execution of the feature extraction plugins. • Patches - boolean parameter to determine whether the ROI is analyzed as a whole or split up into smaller patches (see Section 3.2). • Riesz • RieszOrder - order of the Riesz transform (see Section 2.2.2), • NumScales - number of wavelet scales. • Histogram • HistMin, HistMax - minimum and maximum bounds for the intensity values of the histogram (see Section 2.2.1), • HistNumBins - number of bins. • GLCMs, Statistics - no additional parameters (see Sections 2.2.2 and 2.2.1). By testing di↵erent feature types and parameter values, the user can gain intuition about the meaning and discriminatory power of the raw features in the context of a given pathology. Below are two concrete use-cases to show the potential of using ePAD and the developed plugin for whole ROI analysis.
i
i
i
i
i
i
“main˙BTA” — 2017/5/15 — 10:46 — page 415 — #415
Web-Based Tools for Exploring the Potential of Quantitative Imaging Biomarkers in Radiology
415
Statistics 500 321.30 250
154.89 27.95 2.40
4.47 0.47
Skewness
Kurtosis
0
-250
-500 -537.26 -750 -902.54 -1000 Mean
Std
lungTissue
reticulation
Figure 13.13: Basic statistical feature extraction on two ROIs.
i
i
i
i
i
i
“main˙BTA” — 2017/5/15 — 10:46 — page 416 — #416
416
Biomedical Texture Analysis
GLCMs
Riesz 1k
1.75
Riesz
736.61
GLCMs
1.59
533.05 436.95
1.5
358.74
400
1.25 199.05 197.27 172.42
200
143.35
1 100
84.37 71.36 60.82
38.99 32.94
40
0.93 0.77
0.75
0.70
0.70
0.74
0.62 0.54
36.23
0.5
24.71 20
0.74
0.71 0.66
0.30
19.40 16.10 15.91 14.04
0.25
16.84
0.17 0.07
0.06
0.11
0
10 feat1
liverTissue_patient2
feat2
liverTissue_patient1
feat3
feat4
lesion_patient2
feat5
lesion_patient1
Contrast
liverTissue_patient2
Correlation
liverTissue_patient1
Energy
lesion_patient2
Homogeneity
lesion_patient1
Figure 13.14: Riesz (bottom left) and GLCMs (bottom right) feature extraction on four ROIs located in the liver (top). 3.1.1. Liver lesion quantification In this use-case, the goal is to compare regions of the liver in terms of texture features (Riesz and GLCMs were used for this use-case). A first run uses the Riesz feature extraction plugin, using the following default parameter values (RieszOrder = 0, NumScales = 5, Patches = false). Fig. 13.14 (bottom left) shows the results of the plugin execution on four ROIs. The chart shows that the energies of scales 2, 3 and 5 (i.e., feat2, feat3, feat5, note that the y-axis uses a logarithmic scale) is higher for the lesioned regions than those of healthy tissue (the scales vary from fine to coarse, see Section 2.2 of Chapter 3). Scale 1 is mostly characterizing small scale CT noise. Scale 4 is more represented in normal tissue when compared to lesions. A second run was performed on the same ROIs, using GLCM features with the following parameter value: Patches = false. The results of the plugin execution are also shown
i
i
i
i
i
i
“main˙BTA” — 2017/5/15 — 10:46 — page 417 — #417
Web-Based Tools for Exploring the Potential of Quantitative Imaging Biomarkers in Radiology
417
in Fig. 13.14 (bottom right). In this case, there is no clear trend separating healthy and lesioned tissue. The values of the computed features vary between regions of the same type, and have similar values as regions of the other type. We can conclude that GLCMs may not be optimal for specifically characterizing liver tissue in CT. 3.1.2. Liver metastasis quantification In this use-case, the objective is to quantify the liver tissue density in three ROIs in CT. Two hypodense ROIs contain metastasized tissue and the third one contains a majority of normal liver parenchyma. The intensity-based features (Statistics and Histogram) were used for this use-case. A first run uses the basic Statistics feature extraction plugin, using the following parameter value: Patches = false. In Fig. 13.15 (top right chart), the mean shows a clear distinction between healthy and metastasized liver tissue. Using simple statistical analysis therefore seems appropriate in this specific situation, as it is e↵ective and easily interpretable. A second run was performed on the same ROIs using the Histogram feature extraction with: HistMin = 0, HistMax = 200, HistNumBins = 30, Patches = false. Results are shown in Fig. 13.15 (bottom chart). Note that the histograms are not normalized across ROIs. The hypodensity of metastases is well characterized by the intensity histograms, which enables finegrained visualization of the tissue contained in each region. It is valuable to assess similarities in terms of density between various tissue types.
3.2. Patch-based ROI analysis The plugin described in 3.1 can also be used in patch mode, where the selected ROI is split into several smaller patches. It can be used to reveal the diversity of one or several regions. The user can visualize the spread of patches when represented in the first two PCA dimensions of a chosen feature space. Each selected ROI is split into several smaller patches (patch radius r = 28 pixels). The features are computed for each patch and the results aggregated in a data structure. When all features have been computed, the PCA decomposition is computed and the first two components explaining most variance are used as the dimensions of a scatter plot where each point represents one patch instance. Fig. 13.16 shows the result of extracting GLCMs features from two large ROIs divided into patches. The unhealthy lung parenchyma (gray) appears to have more variation along the first PCA component (PCA1) when compared to the healthy lung tissue (blue). Similarly, the healthy lung tissue has more variation along the PCA2 component than the unhealthy lung parenchyma tissue. 3.2.1. Patch-based liver lesion quantification In this use-case, the goal is similar to Section 3.1.1, but the global features are substituted for locally computed features based on patches. The basic Statistics features were used for this use-case, with Patches = true (see Fig. 13.17). It can be observed
i
i
i
i
“main˙BTA” — 2017/5/15 — 10:46 — page 418 — #418
418
Biomedical Texture Analysis
Statistics 125 117.87 100
71.59 68.81
75
50
25
16.86 13.91 13.41 2.773.425.56
0.330.87
0 -0.06 -25 Mean
Std
metastasis2
Histogram
Skewness
Kurtosis
metastasis1
liverTissue
2500 2 263.00
1 970.00
2000
1 496.00 1500
1 089.00
1 061.00 1000
520.00
500.00
422.00
500 266.00
318.00
285.00
219.00 170.00 167.00 139.00 130.00 121.00 101.00 158.00 139.00 118.00 93.00 113.00 63.00 81.00 55.00 43.00 19.00 48.00 41.00 28.00 22.00 18.00 11.00 15.00 4.00 13.00 0.00 5.00 6.00 20.00 4.00 0.00 6.00 0.00 9.00 0.00 0.00 0.00 0.00 0.00 0.00 0.00 0.00 0.00 0.00 5.00 0.00 0.00 7.00 0.0020.00 0.0030.000.00 0.00 0.00 2.00 1.00 3.00 0.00 0.00 0.00 0.00 0.00 0.00 0.00 0.00 0.00 0.00 0.00 0.00 0.00 0.00 0.00 0.00 0.00 0.00 0.00 0.00
00
33
67
00
33
67 6. 19
0. 19
3. 18
6. 17
0. 17
00
33
67
00
33
67
00
33
67
3. 16
6. 15
0. 15
3. 14
6. 13
0. 13
3. 12
6. 11
0. 11
.6 7
3. 10
.0 0
96
.3 3
90
.6 7
83
.0 0
76
.3 3
70
.6 7
63
.0 0
56
.3 3
50
.6 7
43
.0 0
36
.3 3
30
.6 7
23
16
33 3.
.0 0
0 10
i
i
Figure 13.15: Statistics (top right) and Histogram (bottom, unnormalized) feature extraction on three ROIs located in the liver (top left). metastasis2
metastasis1
liverTissue
that the patches in the healthy ROI are occupying a well-defined region of the PCA space, whereas the ROI containing a heterogeneous lesion is spread out (some patches also contain healthy tissue, which also clearly visible with the naked eye).
3.3. Training a statistical modal and classifying ROIs Visualizing features and comparing them can be useful, but manual visual inspection and analysis is not necessarily the easiest or most efficient way of di↵erentiating ROIs. A more automated and reproducible approach is to enable the training of userpersonalized statistical models based on annotations with known labels (e.g., normal versus abnormal, good versus poor treatment response). With a sufficient number of training examples (this depends on the complexity of the recognition task), SVMs can
i
i
i
i
“main˙BTA” — 2017/5/15 — 10:46 — page 419 — #419
Web-Based Tools for Exploring the Potential of Quantitative Imaging Biomarkers in Radiology
419
GLCMs (Patches) 0.4
0.2
PCA2
i
i
0
-0.2 0
PCA1 healthy
unhealthy
Figure 13.16: Scatter plot (bottom) of a patch-based GLCMs feature extraction on two ROIs (top). The first two PCA dimensions are represented. be further used to classify ROIs of unknown classes with probability output. The goal is to allow the user to fully control which ROI instances and quantitative imaging features to use for the generation of the predictive model. This makes the classification process easier to understand and trust (the decisions taken by the machine learning algorithm are backed up with concrete examples, rather than abstract concepts gathered from huge datasets with limited quality control as it is the case for big data and deep learning).
i
i
i
“main˙BTA” — 2017/5/15 — 10:46 — page 420 — #420
420
i
Biomedical Texture Analysis
Statistics (Patches) 1 0.5
PCA2
i
i
0 -0.5 -1 -1
0
PCA1 lesion_patient5
liverTissue_patient5
Figure 13.17: Patch-based Statistics feature extraction on two ROIs located in the liver. The first two PCA dimensions are represented. The diversity in terms of tissue density of the liver lesion is revealed by scattered patches instances in the PCA space. The first step of this process consists in selecting several ROIs of known class for training a new model. The labels of each class present in the generated model are currently based on the name given to each ROI (e.g. “normal”, “abnormal”). Fig. 13.18 shows the ePAD interface used for selecting the training ROIs. The next step is to determine the feature type for the creation of the model, as well as a user-defined model name for the created model (allowing a user to create and share multiple models for di↵erent purposes). This is done through the input of two plugin parameters by the user in the ePAD web interface, as shown in Fig. 13.19. The features are then extracted from each region, and the resulting instances are normalized and used to train the model. A notification is provided to the user when the model training is complete, which can subsequently be used for classification of new ROIs with unknown label.
i
i
i
i
i
i
“main˙BTA” — 2017/5/15 — 10:46 — page 421 — #421
Web-Based Tools for Exploring the Potential of Quantitative Imaging Biomarkers in Radiology
421
Figure 13.18: ROI selection for statistical model training.
Figure 13.19: Plugin parameter definition for statistical model training. Both the visual feature type and a user-defined model name are required. For classifying a ROI, the user selects it in the Annotations list and runs the classification plugin based on the classifier specified by the feature type and the model name previously used for the training plugin. The model is loaded by the server and the classification is performed using the normalized features extracted from the unseen ROI. The result is sent back to the client’s browser, where a bar plot shows the probability (in percent) for each class (see Fig. 13.20). Using these two plugins (training and classification), the user can easily create and share statistical models, test and refine them by providing new examples increasing the size of the ground truth, improving the classification accuracy of the generated model over time.
i
i
i
i
“main˙BTA” — 2017/5/15 — 10:46 — page 422 — #422
422
Biomedical Texture Analysis
Classification 100% 90% 80% 70% 0.56
60%
Probability
i
i
50%
0.44
40% 30% 20% 10% 0% reticulation
lungTissue
unknown
Figure 13.20: Classification of a ROI with unknown label (two-class SVM model based on Statistical features).
Figure 13.21: Four among the twelve ROIs of known class (normal versus reticulation) from two di↵erent patients used for training. 3.3.1. Lung tissue classification In this use-case, the goal is to train a model that can distinguish between healthy lung parenchyma and reticulation. The model is trained using 12 ROIs (6 normal, 6 reticulation) taken from 2 di↵erent patients. Fig. 13.21 shows 4 of the 12 training ROIs. Once the model is trained, the classification is tested with 3 ROIs from an unseen patient: 1 normal, 1 reticulation and 1 unknown. Distinct models based on the same collection of training ROIs but based on di↵erent feature types (i.e., Riesz, GLCMs,
i
i
i
i
i
i
“main˙BTA” — 2017/5/15 — 10:46 — page 423 — #423
Web-Based Tools for Exploring the Potential of Quantitative Imaging Biomarkers in Radiology
423
Statistics and Histogram) are compared in Fig. 13.22. In each case, the Patches parameter was set to false. For all feature types but Histogram, the two control ROIs were correctly classified. Histogram feature type wrongly classified healthy tissue as reticulation by a small margin. The latter can be explained by the inadequate choices of the Histogram parameters, the latter characterizing the intensity between [0, 100] HU whereas both healthy lung and reticulation mainly have intensity values below 0 HU. The largest classification confidence for the control ROIs are obtained by the GLCM features, with a probability of 89% for the reticulated tissue and 92% for the healthy lung tissue. The unknown ROI is classified as normal lung tissue when using either Riesz, GLCMs or Statistics features, with a probability of 53%, 64% and 56%, respectively.
3.4. Helper tools for segmentation In addition to the specific use-cases mentioned previously, another plugin was developed to investigate and showcase the numerous features provided by the ePAD platform. It allows automatically segmenting lungs in a DICOM volume, using the method described in [9]. The detected lung regions are highlighted using colored overlay in the image viewer of ePAD (see Fig. 13.23). This type of plugin along with the image overlay functionality showcase the possibility to automate the annotation process, yielding reproducible ROIs that can be further used by the quantitative image analysis plugins. The execution process of this plugin di↵ers significantly from the previously mentioned ones. In this case, the analysis is performed not only on a single DICOM image, but on the entire volume. In addition, it does not require a user-defined ROI for initialization and is entirely automated. ePAD provides utilities for downloading all images of the current DICOM series and storing segmentation information in the DICOM archive using the standardized DICOM Segmentation Object (DSO) format. It also handles displaying this information in the front-end interface. Similar plugins may be used in combination with quantitative image analysis methods (e.g., intensity, shape or texture) to highlight areas in an image representing a distinct tissue type using di↵erent colors, enabling the quantification and simplified visual inspection of images using visual cues of pathological findings within an a↵ected area.
4. Discussion This section is dedicated to the analysis of the obtained results and experience working with the ePAD platform. The ePAD environment is a fully-featured imaging, annotation and analysis platform that is already in use by several medical doctors and researchers. This provides the exciting opportunity to finally include end-users in the development cycle of quantitative image analysis in radiology as all developed plugins
i
i
i
i
“main˙BTA” — 2017/5/15 — 10:46 — page 424 — #424
Biomedical Texture Analysis
100% 95% 90% 85% 80% 75% 70% 65% 60% 55% 50% 45% 40% 35% 30% 25% 20% 15% 10% 5% 0%
Riesz
0.86
0.80
0.53 0.47
0.20 0.14
reticulation
lungTissue
Probability
0.56 0.44
0.29
0.26
reticulation
lungTissue
lungTissue
unknown
0.92
0.64
0.36
0.11
0.08
lungTissue
reticulation
0.74
0.71
GLCMs
0.89
reticulation
unknown
Statistics
reticulation
100% 95% 90% 85% 80% 75% 70% 65% 60% 55% 50% 45% 40% 35% 30% 25% 20% 15% 10% 5% 0%
lungTissue
reticulation
100% 95% 90% 85% 80% 75% 70% 65% 60% 55% 50% 45% 40% 35% 30% 25% 20% 15% 10% 5% 0%
Probability
Probability
424
Probability
i
i
100% 95% 90% 85% 80% 75% 70% 65% 60% 55% 50% 45% 40% 35% 30% 25% 20% 15% 10% 5% 0%
lungTissue
unknown
Histogram 0.55
0.53
0.53 0.45
reticulation
reticulation
0.47
0.47
lungTissue
lungTissue
unknown
Figure 13.22: Lung tissue classification using Riesz features (middle left, RieszOrder = 0, NumScales = 5), GLCMs features (middle right), Statistics features (bottom left) and Histogram features (bottom right, HistMin = 0, HistMax = 100, HistNumBins = 20, the bin values are used as features).
i
i
i
i
i
i
“main˙BTA” — 2017/5/15 — 10:46 — page 425 — #425
Web-Based Tools for Exploring the Potential of Quantitative Imaging Biomarkers in Radiology
425
Figure 13.23: Two images of automatically segmented lungs in a DICOM volume. The detected lung regions are highlighted with green image overlays in the front-end of ePAD. and tools are within immediate reach of the clinical context. The methods developed in this work represent e↵orts to reduce the black-box e↵ect of current quantitative imaging biomarkers. The plugins allow quickly evaluating the significance and discriminatory power of intensity or texture imaging biomarkers in an applicative context that the end user fully controls. The possibility to o✏oad the main computational aspects of the plugins to a remote server designed to our own specifications added a layer of complexity (e.g., managing the transfer of data between the two servers), but was ultimately a judicious decision, because it allowed freedom for the design of the plugins and the associated frameworks (e.g., use of Java EE for component lifecycle management and persistence, use of a version of MATLAB that di↵ers from the version for which ePAD is configured). The use of standardized protocols and formats such as HTTP and JSON allowed interoperability between all tiers of the platform. Moreover, the image analysis services deployed on the remote server can be accessed by any other client with or without the ePAD front-end, which allows eased reusability of the developed components. The relevance of developed plugins has been demonstrated with several use-cases. Using the developed tools, we can bring quantitative imaging biomarkers and texture analysis closer to the clinical world and allow medical doctors and researchers to experiment with various feature types, parameters and perform comparisons across image series and patients with ease.
i
i
i
i
i
“main˙BTA” — 2017/5/15 — 10:46 — page 426 — #426
426
i
BIBLIOGRAPHY
5. Conclusions We developed a suite of web-based tools for medical doctors and researchers allowing the rapid exploration of the potential of quantitative imaging biomarkers in a medical applicative context. Recent and extensive scientific evidence of such biomarkers was provided by researchers in the domain of radiomics. The contributions of this work are timely to ease the adoption of quantitative imaging biomarkers in the medical domain. Focusing on a small set of use-cases and features, the developed tools enable the creation of personalized methods and models that can be adapted to various specific medical contexts. They are a proof-of-concept showing that it is possible to bring complex texture analysis methods such as Riesz or GLCMs to the user in an approachable manner, using experimentation as the key to understanding. Extracting quantitative features from several ROIs, comparing between images and patients can provide intuition as to whether a given feature type can be helpful in a given clinical setting, and can be used to identify optimal features for a medical image analysis task. We recognize limitations of this work, including the current impossibility to deal with three-dimensional ROIs and texture features, which is presented in Chapters 11 and 12. In the future, we aim to enhance the current plugins and create new plugins, performing more complex tasks while remaining user-friendly. The possibility of segmenting an image and highlighting di↵erent texture components is very promising, for example. We also plan to integrate new types of features such as circular harmonic wavelets [7] and to improve the training/classification processes with the addition of several machine learning methods and inner cross-validations for automatically choosing hyperparameters. There is still much work to be done, and we want to develop tools that will make the frequent use of quantitative imaging biomarkers analysis in hospitals a reality. The software is available on request.
Acknowledgments This work was supported by the Swiss National Science Foundation (under grant PZ00P2 154891), the Center for Biomedical Imaging (CIBM), and grants from the National Cancer Institute, National Institutes of Health, U01CA142555, 1U01CA190214, and 1U01CA187947.
Bibliography 1. Jocelyn Barker, Assaf Hoogi, Adrien Depeursinge, and Daniel L. Rubin. Automated classification of brain tumor type in whole-slide digital pathology images using local representative tiles. Medical Image Analysis, 30:60–71, 2016. 2. Pol Cirujeda, Yashin Dicente Cid, Henning M¨uller, Daniel Rubin, Todd A Aguilera, Billy W Loo Jr., Maximilian Diehn, Xavier Binefa, and Adrien Depeursinge. A 3–D Riesz–Covariance Texture Model for Prediction of Nodule Recurrence in Lung CT. IEEE Transactions on Medical Imaging, 2016. 3. Adrien Depeursinge, Antonio Foncubierta-Rodr´ıguez, Dimitri Van De Ville, and Henning M¨uller. Multiscale lung texture signature learning using the Riesz transform. In Medical Image Computing and Computer–Assisted Intervention MICCAI 2012, volume 7512 of Lecture Notes in Computer Science, pages 517–524. Springer Berlin / Heidelberg, October 2012. 4. Adrien Depeursinge, Antonio Foncubierta-Rodr´ıguez, Dimitri Van De Ville, and Henning M¨uller. Rotation–covariant texture learning using steerable Riesz wavelets. IEEE Transactions on Image Processing, 23(2):898–908, February 2014. 5. Adrien Depeursinge, Antonio Foncubierta-Rodr´ıguez, Dimitri Van De Ville, and Henning M¨uller.
i
i
i
i
i
“main˙BTA” — 2017/5/15 — 10:46 — page 427 — #427
BIBLIOGRAPHY
6. 7. 8. 9. 10.
11. 12.
13. 14. 15.
16. 17. 18.
19.
20.
i
i
427
Three-dimensional solid texture analysis and retrieval in biomedical imaging: review and opportunities. Medical Image Analysis, 18(1):176–196, 2014. Adrien Depeursinge, Camille Kurtz, Christopher F Beaulieu, Sandy Napel, and Daniel L Rubin. Predicting visual semantic descriptive terms from radiological image data: Preliminary results with liver lesions in CT. IEEE Transactions on Medical Imaging, 33(8):1–8, August 2014. Adrien Depeursinge, Zsuzsanna P¨usp¨oki, John-Paul Ward, and Michael Unser. Steerable wavelet machines (SWM): Learning moving frames for texture classification. IEEE Transactions on Image Processing, 26(4):1626–1636, 2017. Adrien Depeursinge, Masahiro Yanagawa, Ann N Leung, and Daniel L Rubin. Predicting Adenocarcinoma Recurrence Using Computational Texture Models of Nodule Components in Lung CT. Medical Physics, 42:2054–2063, 2015. Yashin Dicente Cid, Oscar Alfonso Jim´enez-del Toro, Adrien Depeursinge, and Henning M¨uller. Efficient and fully automatic segmentation of the lungs in CT volumes. In Proceedings of the VISCERAL Challenge at ISBI, number 1390 in CEUR Workshop Proceedings, Apr 2015. Yu-Hua Dean Fang, Chien-Yu Lin, Meng-Jung Shih, Hung-Ming Wang, Tsung-Ying Ho, Chun-Ta Liao, and Tzu-Chen Yen. Development and Evaluation of an Open-Source Software Package CGITA for Quantifying Tumor Heterogeneity with Molecular Images. BioMed Research International, 2014, March 2014. Robert A Gatenby, Olya Grove, and Robert J Gillies. Quantitative Imaging in Cancer Evolution and Ecology. Radiology, 269(1):8–14, 2013. Marco Gerlinger, Andrew J Rowan, Stuart Horswell, James Larkin, David Endesfelder, Eva Gronroos, Pierre Martinez, Nicholas Matthews, Aengus Stewart, Patrick Tarpey, Ignacio Varela, Benjamin Phillimore, Sharmin Begum, Neil Q McDonald, Adam Butler, David Jones, Keiran Raine, Calli Latimer, Claudio R Santos, Mahrokh Nohadani, Aron C Eklund, Bradley Spencer-Dene, Graham Clark, Lisa Pickering, Gordon Stamp, Martin Gore, Zoltan Szallasi, Julian Downward, P Andrew Futreal, and Charles Swanton. Intratumor Heterogeneity and Branched Evolution Revealed by Multiregion Sequencing. New England Journal of Medicine, 366(10):883–892, 2012. Mark Hall, Eibe Frank, Geo↵rey Holmes, Bernhard Pfahringer, Peter Reutemann, and Ian H. Witten. The WEKA Data Mining Software: An Update. SIGKDD Explor. Newsl., 11(1):10–18, 2009. Robert M Haralick. Statistical and Structural Approaches to Texture. Proceedings of the IEEE, 67(5):786–804, may 1979. Virendra Kumar, Yuhua Gu, Satrajit Basu, Anders Berglund, Steven A. Eschrich, Matthew B. Schabath, Kenneth Forster, Hugo J. W. L. Aerts, Andre Dekker, David Fenstermacher, Dmitry B. Goldgof, Lawrence O. Hall, Philippe Lambin, Yoganand Balagurunathan, Robert A. Gatenby, and Robert J. Gillies. Radiomics: the process and the challenges. Magnetic Resonance Imaging, 30(9):1234–1248, 2012. Dirk Merkel. Docker: Lightweight Linux Containers for Consistent Development and Deployment. Linux J., 2014(239), March 2014. Pattanasak Mongkolwat, David S. Channin, and Vladimir Kleper Daniel L. Rubin. Informatics in Radiology: An Open-Source and Open-Access Cancer Biomedical Informatics Grid Annotation and Image Markup Template Builder. Radiographics, 32(4):1223–1232, 2012. Dilvan A. Moreira, Cleber Hage, Edson F. Luque, Debra Willrett, and Daniel L. Rubin. 3d Markup of Radiological Images in ePAD, a Web-Based Image Annotation Tool. In Proceedings of the 2015 IEEE 28th International Symposium on Computer-Based Medical Systems, CBMS ’15, pages 97– 102, Washington, DC, USA, 2015. IEEE Computer Society. Sebastian Ot´alora, Angel Cruz Roa, John Arevalo, Manfredo Atzori, Anant Madabhushi, Alexander Judkins, Fabio Gonz´alez, Henning M¨uller, and Adrien Depeursinge. Combining Unsupervised Feature Learning and Riesz Wavelets for Histopathology Image Representation: Application to Identifying Anaplastic Medulloblastoma. In Nassir Navab, Joachim Hornegger, William M Wells, and Alejandro Frangi, editors, Medical Image Computing and Computer-Assisted Intervention — MICCAI 2015, volume 9349 of Lecture Notes in Computer Science, pages 581–588. Springer International Publishing, oct 2015. Olaf Ronneberger, Philipp Fischer, and Thomas Brox. U-Net: Convolutional Networks for Biomed-
i
i
i
i
“main˙BTA” — 2017/5/15 — 10:46 — page 428 — #428
428
BIBLIOGRAPHY
21. 22. 23. 24.
i
i
ical Image Segmentation. In Nassir Navab, Joachim Hornegger, William M Wells, and Alejandro F Frangi, editors, Medical Image Computing and Computer-Assisted Intervention MICCAI 2015, volume 9351 of Lecture Notes in Computer Science, pages 234–241. Springer International Publishing, 2015. Daniel L Rubin, Debra Willrett, Martin J O’Connor, Cleber Hage, Camille Kurtz, and Dilvan A Moreira. Automated Tracking of Quantitative Assessments of Tumor Burden in Clinical Trials. Translational Oncology, 7(1):23–35, jan 2014. Alan Snyder, Debra Willrett, Dilvan Abreu Moreira, Kleberson Junio Amaral Serique, Pattanasak Mongkolwat, Vitally Semeshko, and Daniel L. Rubin. ePAD: A Cross-Platform Semantic Image Annotation Tool for Quantitative Imaging. ResearchGate, 1:1–1, January 2011. Ronald M. Summers. Texture analysis in radiology: Does the emperor have no clothes? Abdominal Radiology, 2016. Ting-Fan Wu, Chih-Jen Lin, and Ruby C Weng. Probability Estimates for Multi–class Classification by Pairwise Coupling. Journal of Machine Learning Research, 5:975–1005, aug 2004.
i