Web Engineering
Web Metrics— Estimating Design and Authoring Effort Emilia Mendes University of Auckland Nile Mosley Auckland University of Technology Steve Counsell Birkbeck College, University of London
Like any software process, Web application development would benefit from earlystage effort estimates. Using an undergraduate university course as a case study, we collected metrics corresponding to Web applications, developers, and tools. Then we used those metrics to generate models for predicting design and authoring effort for future Web applications.
C
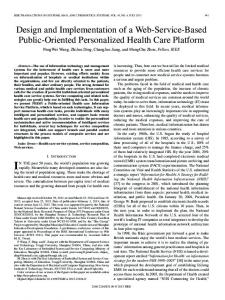
ountless organizations around the world have developed commercial and educational applications for the World Wide Web, the best known example of a hypermedia system. But developing good Web applications is expensive, mostly in terms of time and degree of difficulty for the authors.1 By using measurement principles to evaluate the quality and development of existing Web applications, we can obtain feedback that will help us understand, control, improve, and make predictions about these products and their development processes. Prediction is a necessary part of an effective software process, whether it be authoring, design, testing, or Web development as a whole. As with any software project, having realistic estimates of the required effort early in a Web application’s life cycle lets project managers and development organizations manage resources effectively. As shown in Figure 1, the prediction process involves ❚ capturing data about past projects or past development phases within the same project,
50
1070-986X/01/$10.00 © 2001 IEEE
❚ identifying size metrics and cost drivers and formulating theories about their relationship with effort, ❚ generating prediction models to apply to the project, and ❚ assessing the effectiveness of the prediction models. This article focuses on effort prediction for the design and authoring processes. We adopt the classification proposed by Lowe and Hall,2 in which authoring encompasses the management of activities for the actual content and structure of the application and its presentation. Design covers the methods used for generating the structure and functionality of the application, and typically doesn’t include aspects such as hypermedia application requirements analysis, feasibility consideration, and applications maintenance. In addition, our design phase also incorporates the application’s conceptual design, reflected in map diagrams showing documents and links. The data we used to generate our prediction models came from a quantitative case study evaluation, in which we measured a set of suggested size metrics and cost drivers for effort prediction. Some of our complexity metrics are adaptations from the literature of software engineering3 and multimedia.4,5 In addition, we adapted several media metrics from McDonnell and Fletcher.6 The metrics we propose characterize Web application size from two different perspectives3—length and complexity. Our prediction models derive from statistical techniques—specifically linear regression and stepwise multiple regression.
Measuring the Web design and authoring processes We used our case study evaluation to measure several attributes (metrics) of Web applications and the effort involved in Web design and authoring. The attributes reflect our notion of product length and complexity, as well as characteristics of the application, process, and resources that we expected to influence effort in some way. (A “product” can be a Web application, a Web page, a program such as a CGI script, or media such as video, audio, or an image.) The case study aimed to measure attributes for use as parameters in bottom-up and top-down effort estimation models.3 Bottom-up estimation begins with the lowest level parts of products or
tasks and provides estimates for each. We then combine these into higher level estimates. Top-down estimation begins with the overall process or product. We make a full estimate and calculate estimates for the component parts as relative portions of the whole. Case study evaluation The participants in our case study were 43 computer science students from the University of Auckland, attending the Hypermedia and Multimedia Systems course during the first semester of 2000. Before we began our case study, the students had completed an initial assignment with the following objectives: ❚ Use a Web search engine to find sites on the Web and discuss their interface design. ❚ Cover core Hypertext Markup Language (HTML) tags and the structure of HTML documents and Web sites. ❚ Create a simple personal homepage. ❚ Design a multipage Web site. ❚ Create a new Web site for the Matakohe Kauri Museum, improving on its existing site (http:// www.hmu.auckland.ac.nz:8001/gilchrist/ matakohe/). ❚ Load the Web pages onto a Web server.
Empirical observations Data Actual results Theory Relationships and key variables Models Projects Predictions
to measure characteristics (suggested metrics) of the students’ Web applications and the effort they put into designing and authoring them. The two questionnaires are available at http://www.cs. auckland.ac.nz/~emilia/Assignments/expquestionnaire.HTML and http://www.cs.auckland. ac.nz/~emilia/Assignments/questionnaire.HTML. On both questionnaires, we described each scale in depth to avoid any misunderstanding. Members of the research group checked both questionnaires for ambiguous questions, unusual tasks, number of questions, and definitions in the questionnaires’ appendices. Analysis of the data showed that four questionnaires lacked fundamental information. Consequently, we didn’t use them in the data analysis. Using box plots, we identified three data points in the data set for which the total effort to develop an application was noticeably high. More careful investigation showed that two of those data points
Figure 1. General prediction process (based on a figure from Fenton and Pfleeger3).
❚ Write a two-page “work-in-progress” research paper describing their work. We based our case study on their second assignment—each student designed and authored an educational Web application using a minimum of 50 Web pages (according to Lowe and Hall,2 a medium-sized Web application). The students chose their own topics and structured their applications according to the principles of cognitive flexibility theory.7 (They had received approximately 150 minutes of training on CFT authoring principles earlier in the course. For more on CFT, see the sidebar.) To collect the case study data, we gave our students two questionnaires. The first asked subjects to rate their Web-authoring experience on a scale of one to five, from no experience (0) to very good experience (4). We used the second questionnaire
Cognitive Flexibility Theory CFT is a conceptual model for instruction based on cognitive learning theory. Its intent is to facilitate the advanced acquisition of knowledge to serve as the basis for expertise in complex and ill-structured knowledge domains. CFT’s central claim is that revisiting the same material at different times, in rearranged contexts, for different purposes, and from different conceptual perspectives is essential to advanced knowledge acquisition. For full understanding, content must be covered more than once—to the point that associations among elements become apparent. If students don’t grasp some of these associations on a first exploration, they may notice them on a second or third attempt. CFT’s central metaphor is a criss-crossed landscape. The image suggests a nonlinear, multidimensional traversal of complex subject matter, with students returning to the same place in the conceptual landscape on different occasions, from different directions.
51
Table 1. Entities used in the case study. Entity Deliverables
Resources Software Process
Type Application Page Media Program Developer Tool Application design and authoring Page authoring Media authoring Program authoring
Description Web application HTML or SHTML page Graphics, audio, video, animation files, scanned images CGI script, JavaScript, or Java applet Subject who developed the application Tool used to author the Web pages Task carried out to author or design a Web application Task carried out to develop a Web page Task carried out to develop a media file Task carried out to develop a program
Table 2. Length size metrics. Entity Type Application
Metric Description Page count Number of HTML or SHTML files* Media count Number of media files Program count Number of CGI scripts, JavaScript files, Java applets Total page allocation Total space allocated for all HTML or SHTML pages (Mbytes)* Total media allocation Total space allocated for all media files (Mbytes)* Total code length Number of lines of code for all programs Page Page allocation Size of HTML or SHTML file (Kbytes)* Media Media duration Duration of audio, video, and animation (minutes) Media allocation Size of media file (Kbytes) Program Code length Number of lines of code in program Code comment length Number of comment lines in program * Useful only for static Web applications, which don’t include dynamically generated links and pages.
Table 3. Reusability metrics. Metric Description Reused media count Number of reused or modified media files Reused program count Number of reused or modified programs Total reused media Total space allocated for all reused media files used in allocation application (Mbytes) Total reused code length Total number of lines of code for all programs reused by application Program Reused code length Number of reused lines of code Reused comment length Number of reused comment lines * Useful only for static Web applications, which don’t include dynamically generated links and pages.
IEEE MultiMedia
Entity Type Application
52
hadn’t presented any reasonable justification in the data for the values given; we therefore removed those two from the data set. Consequently, we used 37 data points. Ultimately, through the case study, we collected information on 37 applications, 2,165 pages, 443 reused media, 1,027 non-reused media, 115 reused programs, and 22 non-reused programs.
Metrics collected during the case study The metrics we collected measured attributes of different types of entities, as listed in Table 1. Each entity type had a set of metrics that we collected and organized into five categories: length size, reusability, complexity size, effort, and confounding factors. (This last category consists of factors that, if not controlled, could influence the validity of the evaluation.) Tables 2
Table 4. Complexity and size metrics. Entity Type Application generated links*
Metric Connectivity
Description Total number of internal links, not including dynamically
Connectivity density2
Connectivity divided by page count* PageCount
Total page complexity
∑
PageComplexity / PageCount
1
(Connectivity − page count) + 2* Measurement of organization of the application’s main structure (backbone): sequence, hierarchy, or network* Page Page linking complexity Number of links per page* Page complexity Number of different types of media used on page, not including text* Graphic complexity Number of graphics media used in page* Audio complexity Number of audio media used in page* Video complexity Number of video media used in page* Animation complexity Number of animations used in page* Scanned image complexity Number of scanned images used in page* * Useful only for static Web applications, which don’t include dynamically generated links and pages. Cyclomatic complexity2 Structure
Table 5. Effort metrics. Entity type Application authoring and design tasks
Metric
Description
Structuring effort Interlinking effort Interface planning Interface building Link-testing effort Media-testing effort Total effort
Estimated elapsed time taken to structure application (hours) Estimated elapsed time taken to interlink pages to build the application’s structure (hours)* Estimated elapsed time taken to plan application’s interface (hours) Estimated elapsed time taken to implement application’s interface (hours) Estimated elapsed time taken to test all links in application (hours)* Estimated elapsed time taken to test all media in application (hours)* Structuring effort + interlinking effort + interface planning + interface building + link-testing effort + media-testing effort Page authoring Text effort Estimated elapsed time taken to author or reuse text in page (hours)* Page-linking effort Estimated elapsed time taken to author links in page (hours)* Page-structuring effort Estimated elapsed time taken to structure page (hours) Total page effort Text effort + page-linking effort + page-structuring effort Media-authoring task Media effort Estimated elapsed time taken to author or reuse a media file (hours) Media-digitizing effort Estimated elapsed time taken to digitize media (hours) Total media effort Media effort + media-digitizing effort Program-authoring task Program effort Estimated elapsed time taken to author or reuse a program (hours) * Useful only for static Web applications, which don’t include dynamically generated links and pages.
Table 6. Confounding factors. Entity type Developer experience) Tool
Metric Experience
Description Authoring/design experience of subject on a scale of 0 (no experience) to 4 (very good
Type
Type of tool used to author/design Web pages: WYSIWYG (what you see is what you get), semi-WYSIWYG, or text-based
53
2. maturation effects—that is, the effects of subjects learning as an experiment proceeds;
6
Experience rating
5
3. application structure; and
4
4. tools used to help author and design the Web application.
3 2 1 0 0
20
40
60
80
100 120 140 160
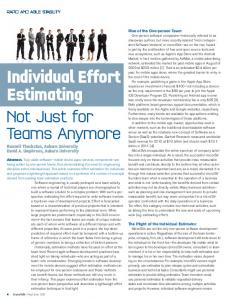
Effort (hours) Figure 2. Scatter plot for experience versus effort.
4.5 4.0
Tool rating
3.5 3.0 2.5 2.0 1.5 1.0 0.5 0 20
40
60
80
100 120 140 160
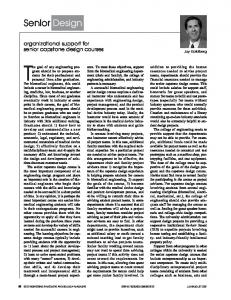
Effort (hours) Figure 3. Scatter plot for tool used versus total effort. On the tool rating axis, 2.0 corresponds to NotePad, and 3.0 corresponds to FirstPage.
IEEE MultiMedia
through 6 list and describe the metrics and corresponding categories. In Table 3, we consider something reused only if it existed already outside the application and is copied for use within the application. Note in Table 4 that subjects didn’t use external links to other Web sites. All the links pointed to pages within the application only. In addition, for the structure metric in Table 4, a sequential structure corresponds to documents linearly linked; a hierarchical structure denotes documents linked in a tree shape, and a network structure for documents linked in a net shape.
54
Comments on case study validity We found four confounding factors in our evaluation of the case study: 1. subjects’ authoring and design experience;
Regarding factor 1, the data we collected revealed that our subjects had little (experience level 2) to average (experience level 3) authoring and design experience. Based on the descriptions of the scales we gave on both questionnaires, going from level 2 to level 3 doesn’t require learning very different skills. A scatter plot between experience and effort helped investigate their relationship (see Figure 2). For experience levels 2 and 3, most data points fell in the interval of 10 to 80 hours, and data points were clustered in similar areas. Consequently, we didn’t split the original data set. As we described, our subjects completed an assignment to develop a Web application prior to the case study. They had also received training in CFT principles. Consequently, we controlled, or at least substantially reduced, maturation effects— confounding factor 2. For factor 3, nearly all our subjects used a hierarchy for their application structure. Regarding factor 4, subjects mostly used Notepad (or a similar simple text editor) and FirstPage (freeware that offers buttons related to HTML tags). Although the two tools differ with respect to functionality offered, a scatter plot between total effort and tool (see Figure 3) reveals that most data points fell within the interval between 10 and 80 hours for both Notepad and FirstPage; again, the data points clustered in similar areas. Consequently, it seems that confounding effects that different tools might have caused were reduced.
Estimation process Once we collected the data, we used two algorithmic models—linear regression and stepwise regression—to generate bottom-up and top-down effort prediction models for Web design and authoring. We generated different prediction models for each of the categories used: application, page, media, and program. The prediction model we obtained for the application category characterizes the top-down approach to prediction, whereas those we obtained for the page, media, and program categories represent the bottom-up approach.
After obtaining the prediction models, we assessed each model’s accuracy by measuring their prediction power. To do this, we used the Mean Magnitude of Relative Error (MMRE),8 which we describe later. Linear regression and stepwise regression The general purpose of linear and stepwise multiple regression models is to learn more about the relationship between several predictor variables and a response variable. Multiple regression and linear regression let researchers to ask (and hopefully answer) the general question, “What is the best predictor of x?” Regression modeling is one of the most popular statistical modeling techniques for fitting a quantitative response variable y as a function of one or more predictor variables x1, x2, ..., xp. Regression models are widely used because they often provide an excellent fit to a response variable when the true functional relationship, if any, between the response and the predictors is unknown.9 In the scope of this article, Table 7 lists the response variables; Table 8 lists the corresponding predictor variables. (See the Metrics section for more details.) We calculated both linear regression and stepwise regression using SPSS 10.0.5. We analyzed the residuals for the data set, and they didn’t indicate any nonlinearity.
Entity Type Application authoring and design tasks Page authoring Media authoring Program authoring
Table 8. Predictor variables. Entity Type Application
Page
Media Program
Predictor Variables Page count Media count Program count Total page allocation Total media allocation Total code length Reused media count Reused program count Total reused media allocation Total reused code length Connectivity Connectivity density Total page complexity Cyclomatic complexity Page allocation Page linking complexity Page complexity Graphic complexity Audio complexity Video complexity Animation complexity Scanned image complexity Media duration Media allocation Code length Code comment length Reused code length Reused comment length
popular technique, the MMRE is not limited to regression-based methods.10 The mean the MMRE uses considers the numerical value of every single observation in the data distribution. A small MMRE indicates a good prediction model. To calculate the MMRE, we use the formula i=n
Measuring the models’ predictive power We evaluated the predictive power of the estimation models using the MMRE, which gives an indication of a predictive model’s capability. A
Response Variables Total effort Total page effort Total media effort Program effort
Epredi − Eacti Eacti * 100 n
∑ i =1
January–March 2001
Results using linear and stepwise regression We decided to split the data sets for media and program to evaluate whether reusing information would affect the prediction model generated. Both prediction models for media use information about media duration. However, the model for media not reused also uses information about media allocation. The prediction models for program not reused and program reused, on the other hand, don’t have any overlapping variables. For non-reused programs, information about code length is important; for reused programs, reused comment length is important for prediction. Once we generated the prediction models, we used them to predict effort, for each entity type, and compare the results against the actual effort values stored in the data sets.
Table 7. Response variables.
(1)
55
more influence when trying to fit a regression equation than they do when assessing the overall predictive performance of the method. This can lead Entity Linear regression Stepwise regression to small anomalies in the relative performance of Application 75% 56% linear regression and stepwise regression models. Page 105% 108% The prediction models for the non-reused proMedia not reused 34% 51% gram entity type are reasonable, since the differMedia reused 110% 110% ences between predicted and actual effort are 17 Program not reused 17% 24% percent using linear regression and 24 percent Program reused 53% 48% using stepwise regression. Generally, algorithmic models perform better on smaller, more homogeTable 10. Metrics statistically correlated to effort. nous data sets. Although the number of Web pages for each application was Entity Type Spearman’s Pearson’s similar, other variables had greater Application Total page allocation** Total page allocation** variation and may have influenced our Total code length** results. For example, total page allocaConnectivity* tion varied from 129 to 728, media Connectivity density* count from 0 to 296, and graphic comCyclomatic complexity* plexity from 0 to 113. If we split the Reused program count** original data sets to make them more Total reused code length** homogeneous, we would reduce the Page Graphics complexity** Graphics complexity* sizes of the sub-data sets; the side effect Video complexity** Audio complexity* would be not finding statistically sigAnimation complexity* Animation complexity** nificant regression models. Scanned image complexity* Scanned image complexity** We analyzed the association (or correlation) between effort and prePage linking complexity* dictor variables for each entity type. Page allocation** We generated the correlations using Media not reused Media duration* N/A Pearson correlation and Spearman Media allocation** Rank correlation tests,9 with levels of Media reused Media duration** N/A significance of 1 and 5 percent. This Media allocation** means that if an association is statistiProgram not reused Code length* Code length** cally significant, it is with a confidence Code comment length* Code comment length** level of 99 percent and 95 percent, Program reused Reused code length** N/A respectively. The Pearson correlation Reused comment length** coefficient is a parametric test that * Correlation is statistically significant at 5 percent. should only be used with normally ** Correlation is statistically significant at 1 percent. distributed values. Spearman rank correlation is used with non-normal data. Eact is the actual effort, and Epred is the esti- Table 10 lists the metrics that demonstrated statistically significant correlation with effort. mated effort. A statistically significant correlation between Table 9 presents the MMRE for the prediction an attribute and effort suggests that that attribute models we generated. One salient aspect of Table 9 is that stepwise may be a good indicator of effort. However, a regression, contrary to expectations, isn’t consis- strong correlation doesn’t mean causality. Table tently better than linear regression. Shepperd et 10 suggests that several attributes can be used as al.10 reported a similar result and suggested the fol- indicators of effort. lowing explanation for the phenomenon. Regression analysis is based on minimizing the sum Conclusions and future work of the squares of the residuals. A residual is the difAlthough the prediction models we generated ference between actual effort and predicted effort. didn’t present low MMREs, other techniques, such Because the MMRE is based on the average of the as general linear models (GLMs), have the advansum of the residuals, poor predictions have far tage of allowing relationships between response
IEEE MultiMedia
Table 9. Predictive power of the estimation models.
56
and predictor variables to be nonlinear. This provides considerable flexibility while still yielding to a rigorous statistical treatment. In addition, other nonalgorithmic techniques—fuzzy systems and case-based reasoning—allow the user to see how a model derives its conclusions, just as linear models do. GLMs and case-based reasoning represent the scope of our future work. In addition, we also plan to apply effort prediction to the whole development cycle of Web applications and to compare the performance of several prediction techniques against human estimation. There’s an urgent need for adequate, earlystage effort prediction for Web development. As the use of the Web as a resource delivery environment increases, effort estimation can contribute significantly to the reduction of costs and time involved in developing Web applications. MM
References
Emilia Mendes is a lecturer in the Department of Computer Science at the University of Auckland. Her research interests are hypermedia (Web) metrics and their application to quality control and development effort prediction. She is also interested in computer science education, software engineering, and usability engineering. She has written more than 20 papers on hypermedia metrics. She received a PhD in computer science from the University of Southampton, U.K.
Nile Mosley is Managing Director of MXM Technology, a consultancy that specializes in software development and Web site design. He is also a part-time lecturer in the Department of Computing Systems at Auckland University of Technology. His research interests are hypermedia measurement, object orientation, computer science teaching, and humancomputer interaction. He received his PhD in applied mathematics and computational fluid dynamics from Nottingham Trent University, U.K.
Steve Counsell recently completed a PhD in computer science from Birkbeck College, University of London, where he is a lecturer in the Department of Computer Science. His main areas of research are object-oriented metrics, business process modeling, and evolution of object-oriented systems. He graduated with a BS in computer studies from the University of Brighton in 1987 and an MS from the City University, London, in 1988.
January–March 2001
1. P.J. Brown, “Creating Educational Hyperdocuments: Can It Be Economic?” IETI—Innovations in Education and Training Technology, vol. 32, no. 3, 1995, pp. 202-208. 2. D. Lowe and W. Hall, eds., Hypertext and the Web— An Engineering Approach, John Wiley & Sons, New York, 1998. 3. N.E. Fenton and S.L. Pfleeger, Software Metrics, A Rigorous and Practical Approach, 2nd edition, PWS Publishing Company and International Thomson Computer Press, London, 1997. 4. E. Hatzimanikatis, C.T. Tsalidis, and D. Christodoulakis, “Measuring the Readability and Maintainability of Hyperdocuments,” J. Software Maintenance, Research and Practice, vol. 7, no. 2, 1995, pp. 77-90. 5. P. Warren, C. Boldyreff, and M. Munro, “The Evolution of Websites,” Proc. Seventh Int’l Workshop on Program Comprehension, IEEE Computer Soc. Press, Los Alamitos, Calif., 1999, pp. 178-185. 6. S.G. McDonell and T. Fletcher, “Metric Selection for Effort Assessment in Multimedia Systems Development,” Proc. Metrics 98, IEEE Computer Society Press, Los Alamitos, Calif., 1998, pp. 97-100. 7. R.J. Spiro et al., “Cognitive Flexibility, Constructivism, and Hypertext: Random Access Instruction for Advanced Knowledge Acquisition in Ill-Structured Domains,” Constructivism, L. Steffe and J. Gale, eds., Erlbaum, Hillsdale, N.J., 1995. 8. I. Myrtveit and E. Stensrud, “A Controlled Experiment to Assess the Benefits of Estimating with Analogy and Regression Models,” IEEE Trans. Software Engineering, vol. 25, no. 4, Jul./Aug. 1999, pp. 510-525.
9. R.L. Mason, R.F. Gunst, and J.L. Hess, Statistical Design and Analysis of Experiments with Applications to Engineering and Science, John Wiley & Sons, New York, 1989, pp. 435-440. 10. M.J. Shepperd, C. Schofield, and B. Kitchenham, “Effort Estimation Using Analogy,” Proc. Int’l Conf. Software Engineering, IEEE Computer Soc. Press, Los Alamitos, Calif., 1996, pp. 170-178.
Readers may contact Mendes via email at
[email protected] and Counsell via email at
[email protected].
57