Oct 5, 2012 - web user interface (UI), a server-side PHP API for database access consisting ... wide and extensive support from both Google and developer.
Web Tool for Traffic Engineers: Direct Manipulation and Visualization of Vehicular Traffic Using Google Maps Tomi Juntunen, Vassilis Kostakos, Mikko Perttunen, Denzil Ferreira Department of Computer Science and Engineering University of Oulu, Finland
{tomi.juntunen, vassilis, mikko.perttunen, denzil.ferreira}@ee.oulu.fi ABSTRACT We present a lightweight web-based tool aimed for traffic engineers that allows an engineer-friendly way to interact and explore traffic volume statistics. This system has been created in participatory design with experienced traffic engineers from a local traffic center. The tool has been built using common web technologies and utilizing an existing traffic detection loop network, and public online GIS and graph tool APIs.
Categories and Subject Descriptors H.5.2 [Information Interfaces and Presentation]: Interfaces – graphical user interfaces (GUI), prototyping.
User
General Terms Design, Experimentation.
Keywords Traffic volume, vehicular traffic, statistics, web-based services, tools
1. INTRODUCTION As cities get bigger and road networks grow more complex, the overall density and flow of road traffic increases. An important challenge is to analyze and detect problems in road networks and find solutions to them. Traffic engineers seek to analyze, and create new and modify existing road network structures and traffic control device installations corresponding to acquired information. Interviews with a traffic engineer in a local traffic center revealed important aspects of the data collection process. Currently, the data collection is often done by utilizing road cameras and manually counting the vehicles that have passed by in the areas of interest and this way creating approximates of the total traffic flow. Another way used to analyze traffic volumes is to utilize data from traffic detector loops installed under the road that count the vehicles passed in fixed time intervals. This numeric data is collected into a large database consisting of numerous rows of raw data, which can be queried and visualized in human-friendly format. Here we demonstrate an automated lightweight system aimed at these purposes for traffic engineers, utilizing standard web technologies, and Google Maps and Charts Application Permission to make digital or hard copies of all or part of this work for personal or classroom use is granted without fee provided that copies are not made or distributed for profit or commercial advantage and that copies bear this notice and the full citation on the first page. To copy otherwise, or republish, to post on servers or to redistribute to lists, requires prior specific permission and/or a fee. MindTrek 2012, October 3-5, 2012, Tampere, FINLAND. Copyright 2012 ACM 978-1-4503-1637-8/12/10…$10.00.
Programming Interfaces (API). The goal of the system was to provide an engineer-friendly way to interact and explore the traffic data more easily and without the hands-on mining. It has been specifically designed to suit the purposes of traffic engineers with participatory design and feedback sessions.
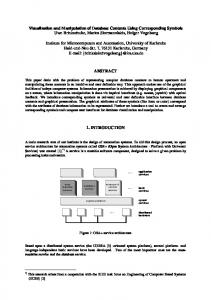
2. ARCHITECTURE The tool consists of three separate layers as shown in Figure 1. A web user interface (UI), a server-side PHP API for database access consisting of different individual modules for querying the database and traffic volume calculation algorithms, and a MySQL database containing information about the detector loops, intersections and the real-time traffic volumes. The user interface is built using common web technologies: HTML, JavaScript (AJAX) and PHP. The current version of the tool UI consists of two main elements: a map of the city and a panel where traffic volumes are shown in line charts as shown in Figure 2. Map overlay with the intersections and the road network can be seen in the left part of the figure and traffic volume information on the right side. Map and charts are created using Google Maps and Google Charts APIs, as there is no fee for using these environments below certain quotas. Also both of these have wide and extensive support from both Google and developer community. The server side PHP API is a layer between the UI and MySQL database. It handles the requests received from the web application and queries the database for traffic information with corresponding parameters, calculates the traffic volume information, and returns the final values in JavaScript Object Notation (JSON) format. All resource-intensive calculations are processed at the server-side.
2.1 Interaction model When the tool is loaded for the first time, it requests information from the API on all the intersections and their connections to other intersections in the city. The API then queries the database for static intersection information and creates a JSON object containing the necessary information for showing the network on a map and sends it as a response to the web page. The tool then displays the road network as an overlay on top of the Google map interface showing road sections as blue selectable line objects and intersections as red dots. We refer to the former as 'polylines' and the latter as plain 'markers'. After the map has been initialized, user may interact freely with the map and select road sections for which to see traffic statistics. When selecting a road section, a panel is displayed on the right side containing two minimaps and two graphs: The direction of
traffic is shown with a blue arrow on the minimap and next to the minimaps are line charts showing the total volume of traffic in each direction for the defined time intervals.
network structure and the volume of traffic in graphical form. Closer examination of numbers is also possible.
3. DISCUSSION The reason for choosing web as our platform was to have a flexible and platform-independent open-source tool. Only a JavaScript-enabled browser is needed to use the tool. Due to the flexibility of web technologies, the tool can be also used on devices of varying form factors, for example on touchscreen devices. Figure 1. Graph of the overall structure of the tool.
We did a heuristic evaluation and interview with a traffic engineer from a local traffic center who had a long experience using traffic statistics tools. Interviews revealed that there is a need for such a tool to analyze traffic volumes in a simple manner within one application. Currently, the manipulation has to be done by first extracting the data using other application, and then visualizing it on charts using other tools, so they lack integration between each other. Our tool succeeds to provide both numerical and graphical representations of the traffic information.
3.1 Limitations
Figure 2. Screenshot of the user interface of the web app.
2.2 Data The tool utilizes multiple data sources. The client side requests data from PHP API using GET method. The API handles the requests received from UI, queries the database, and sends a response in JSON format to the client side after processing the data. User interface handles the lightweight data processing completely in JSON using JavaScript, whereas resource-intensive processing is performed at the server. The data used by the tool is divided into three different MySQL database tables: The first table is for general detector information, the second for intersection structure information, and the third for traffic volume counts received from traffic detector loops. The detector table contains information about where the detector is located (coordinates and intersection ID), from which intersection the traffic comes to the detector, distance from intersection in meters and on which lane the detector is located. The intersection table contains general information about intersections, for instance the road names that cross at that point and where the intersection is located. Each intersection has also its unique ID. The traffic volume records table contains information how many cars have passed over a detector in an intersection around city. The table updates in 3 to 15 minute intervals depending on the update frequency of an individual detector loop. One row in the traffic volume table consists of an ID of an intersection and all detectors that belong to the vicinity of that intersection with their car counts. The main purpose behind the tool is to make it possible for traffic engineers to examine and visualize the road
Web technologies give much flexibility, but they also pose a challenge maintaining the user interface on all browsers due to the differences in the way browsers handle HTML5 and JavaScript code. Security risks and possible authentication measures should also be taken into account. Also it is important to note that using the public Google Apps APIs are free below a certain quota. Exceeding these quotas will require more investments in the tool if it is deployed in a larger scale.
3.2 Conclusions and future work Following a participatory design process with local traffic engineers, we have developed a practical prototype tool that allows representing and analyzing traffic data and statistics in an engineer-friendly form without a concern of platform compatibility. Moreover, the system provides an important capability for the traffic engineers to re-utilize an existing network of traffic loop detectors. Due to the modular adapter pattern design, we state that it is possible to utilize the tool in different operating environments only by rewriting the query interface of the tool. It is also possible to add and improve the traffic calculation algorithms in a collaborative manner with other traffic authorities and companies due to the open source nature of the tool. Combined together with an existing network of traffic detection loops deployed in the city provide us a low-cost and flexible traffic statistics system.
4. LICENCE The tool has been licensed under the open source MIT license.
5. ACKNOWLEDGMENTS The authors gratefully acknowledge financial support from the City of Oulu and the UBI (UrBan Interactions) consortium. We would also like to thank the Traffic Center of Oulu for their technical support on the traffic network structure and the traffic data analysis.