WebAware is a system that makes information about web site traffic available in a .... users an awareness of web site activity which they would not otherwise get.
WebAware: Continuous Visualization of Web Site Activity in a Public Space Tobias Skog and Lars Erik Holmquist PLAY Research Group, Interactive Institute c/o Viktoria Institute, Box 620 S-405 30 Göteborg, Sweden {tobias.skog, lars.erik.homquist}@interactiveinstitute.se http://www.viktoria.informatics.gu.se/groups/play
ABSTRACT
WebAware is a system that makes information about web site traffic available in a public space. The information is presented in a dynamic visualization, which is based on a map of the web site and designed to give an overview of how the site is constructed. Information about activity, such as the number of visitors and which area of the web site is most popular, is continuously reflected on the display. The application is designed to be shown on a wall-mounted public screen. Initial evaluations show that WebAware can act as an aesthetically pleasing information display, as well as a nice conversation piece. KEYWORDS
Web logs, geography of cyberspace, information visualization INTRODUCTION
Information about the activity on a web site is of great interest to many people, not only to web masters and designers, but to anyone interested publishing material on the web. Such information is for instance: • How many people are visiting our web site? • Who are they? • Which pages are most popular? • What are the patterns, i.e. how do people move between pages on the site? However, while this information is indeed available for most web sites, it is usually hidden in a log file and not easily accessible. It would be of great benefit if this information could be made visible in some easily understandable way. Several applications have made an attempt to visualize such web site activity, e.g. by presenting statistical analysis in traditional bar graphs [5], by focusing mainly on crowd dynamics [3] (i.e. how visitors move around on the site), etc. Since this is information which changes over time, a visualization of it should preferably be running continuously, thus at all times presenting the current activity on the site. But cramming yet another window requiring the user’s attention into the already crowded desktop environment might not be a good idea. Instead, we decided to display the information on a wall-mounted display in a public space, making it an unobtrusive part of the peripheral awareness rather than the focus of the user’s attention [1]. THE WEBAWARE SYSTEM
Picture an open office space where several dozen people work. On one of the walls, a huge map of the company’s web site is displayed. This map gives everyone in the room the ability to obtain information about the current traffic situation on the site with a quick glance. However, this information is not exact in the form of numbers or charts, but
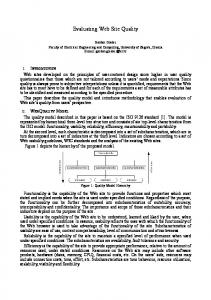
Figure 1:
A wall-mounted display at our office, showing the WebAware visualization.
looks more like a beautiful picture of a galaxy. Whenever someone wants to know the current situation, she looks at the display, but at other times she can focus fully on her desktop work. WebAware [Figure 1] is designed to be such a public display, giving people involved in a web site the ability to become increasingly aware of the on-going activity on the site. However, it intentionally only gives a rough view of what is happening – for detailed information it will still be necessary to consult traditional web site logs and statistics. IMPLEMENTATION
Bringing information from a web server to a wall-mounted display required solving a number of tasks. We chose to split the workload between two different parts of the program: a server part, responsible for the construction of the site map and the continuous reading of the log file; and a client part, responsible for drawing the map and performing the dynamic visualization on the display. Visualization
Most web sites have a file structure that is designed to be a logical grouping of the pages on the site [4], e.g on our example site, where a natural such division consists of the four research groups and a fifth group of pages, not belonging to any of the research groups. Since this type of structure is a familiar grouping to anyone that has visited or worked on the site, we found it to be a suitable basis for the structuring of our site map. We decided to do the determination of the major groups by hand, since finding a universal way to perform this completely automatically is fairly complicated. The division is done by telling the program which of the directories on the server will constitute a group. In order to be able to tell which group is which in the resulting visualization, some kind of labeling is required.
We chose to use the criteria from the site division as labels on the groups (e.g. if the program is told that the directory named /groups/play constitutes a group, then /groups/play is the label of that group). In the resulting visualization we used different colors for different groups, so that it would be fairly easy to see approximately to which logical grouping a page belonged. Having performed the division into groups, we then utilized a visualization technique, CyberGeo Maps, based on a solar system metaphor which had previously been used to visualize historical web site data [1]. In the visualization, each document (or page) on the site is represented by a dot, placed on a distance from the centre determined by its depth in the directory structure. To avoid that the dots cover each other completely on the display, they are then distributed within a limited space according to a simple hash function based on the directory names plus a slight random element. The result is that the dots form ‘orbits’ around the centre, and when the number of dots is high the result starts looking very much like a star-filled galaxy. Figure 2 shows a small tree-structure and the corresponding CyberGeo Map. Since the amount of available space grows larger the further from the centre you get, this type of visualization is well suited for visualizing hierarchical tree structures such as the documents of a web site. Figure 3 shows an actual web site map, with approximately 1000 documents. Reflecting Web Site Activity
We determined the web site activity by continuously checking the web server’s log file, which contains information about which pages are requested, what IP addresses the requests come from, etc. As soon as a new request is added to the log file (i.e. when a page is downloaded), a new dot in a bright color is added to the display at the position corresponding to this page. Unless the page is visited again, the color gradually fades as the amount of time passed since the fetching grows larger. Eventually, the dot disappears. The result is a dynamic visualization that makes the areas of the site currently being visited clearly visible at all times, whereas the non-visited parts seem to be toned down into the background. It also gives some sense of history, since a page that been visited fairly recently will still be indicated but with a fading color, thus giving a sense of how users move through the site. Displaying the Results
Since the visualization should be accessible to anybody working in or visiting a certain workplace, the placement of the display is crucial. Preferably, it should be located on the wall in a public area, such as a corridor or in an open office environment. We have experimented with a variety of dis-
Figure 3:
A site map. Arrows have been added to indicate the position of recently visited pages.
Figure 2:
A small tree-structure and it’s corresponding CyberGeo Map. The figure shows how the two subdirectory levels in the tree-structure correspond to “orbits” in the CyberGeo Map.
play devices, including projectors, small flat wall-mounted screens and a large plasma display. Generally the display should be as inconspicuous as possible, so as to not distract users from other tasks. USER EXPERIENCE
We have had different versions of WebAware running in a variety of public areas using several different types of display technology for approximately 6 months. We found that it works well as a peripheral information source, giving users an awareness of web site activity which they would not otherwise get. Users would sometimes stop by the display in the corridor to check out what was happening or discuss the visualization with others. However, display quality and background noise turned out to be crucially important factors, which motivated a move from noisy projectors to various wall-mounted flat-screen displays to minimize disturbance and improve legibility in different light conditions. CONCLUSION AND FUTURE WORK
WebAware is an example of how it is possible to make information that is not usually accessible, in this case the activity on a web site, a part of peoples’ everyday lives. The fact that we introduced the visualization to a public space, rather than confining it to the desktop, meant that it could be used as a peripheral source of information rather than demanding users’ undivided attention. The visualization also turned out to be quite beautiful – we even had WebAware running as a backdrop during a large party, where it was a good conversation piece. Future work includes exploring different ways of showing where visitors come from, how many they are, etc. This can be expressed with the extended use of colors, lines etc. in the visualization. We also intend to conduct long-term user studies to establish possible improvements of the system. ACKNOWLEDGMENTS
We wish to thank Magdalena Siverbo for her work on the project. The project is funded by the Internet Project and NUTEK: Promodis. REFERENCES 1. Buxton, W. (1995). Integrating the Periphery and Context: A New Model of Telematics. Proceedings of Graphics Interface ’95, 239-246. 2. Holmquist, L.E, Fagrell, H. and Busso, R. (1998) Navigating Cyberspace with CyberGeo Maps. Proceedings of IRIS 21, Saeby Denmark. 3. Minar, N. (1999) Visualizing the Crowds at a Web Site Extended abstracts of CHI ’99, Pittsburgh, Pennsylvania, USA. 4. Rohrer, R M. and Swing, Edward. Web-Based Information Visualization. IEEE Computer Graphics and Applications, July/August 1997. 5. WebTrends Log Analyzer. Copyright 1995-1999 WebTrends Corporation, Portland, Oregon. http://www.webtends.com/ products/log/default.htm