WebTracer: Evaluating Web Usability with Browsing History and Eye Movement Noboru Nakamichi†, Makoto Sakai‡, Jian Hu†, Kazuyuki Shima †, Masahide Nakamura†, Ken’ichi Matsumoto † †
Graduate School of Information Science, Nara Institute of Science and Technology 8916-5, Takayama, Ikoma, Nara, 630-0101, JAPAN {noboru-n, jian-hu, shima, masa-n, matumoto} @is.aist -nara.ac.jp
‡
SRA Key Technology Laboratory, Inc.
Marusho Bldg. 5F, 3-12, Yotsuya, Shinjuku-ku, Tokyo, 160-0004, JAPAN
[email protected]
Abstract This paper describes a WWW site evaluation tool, WebTracer, which can record user's gazing points, a user’s operational data, and the screen image of browsed pages . In addition, the WebTracer can replay a user’s browsing operations. In an evaluation experiment, we record without interruption, a user's browsing operations using WebTracer. The average execution time per task in the experiment was 2 minutes and 48 seconds. We interviewed users by applying the usability-testing-support function based on a replay and summary of the WebTracer. The average time required for an interview was 19 minutes. 16 comments on the average were obtained for the execution time. The experimental results show that the various summarized user-operational data were help ful for getting more comments about web usability from the subjects .
1
Introduction
Designing attractive Web sites is a crucial problem in business, since Web sites directly reflect the images and sales of companies (Goto & Cotler, 2002). Therefore, usability evaluation for web pages is now an important concern in finding flaws and shortcomings in the pages with respect to usability (Jakob, 1993). Web usability testing is a popular way to conduct usability evaluation. Web usability testing requires subjects (users ) to browse a target web site, and then evaluators get feedback from the users based on an interview. Usability testing has been widely studied and various methods have been proposed to date. However, most conventional methods must occasionally (or periodically) interrupt the user’s browsing operations, to get opinions within a certain period of time on the web pages browsed. This discontinuous browsing creates difficulties in evaluating the usability of a “whole” Web site, which consists of a number of pages. To achieve effective continuous testing, we need to first “record” how users browse the entire site, and then we need to perform the interview by “ replaying” the recorded data. Finally, we need to justify the feedback by “analysis ” of the recorded data.
Time stamp Gazing point position Mouse event Screen image (JPEG file name)
[00:00:07.750, 0000000035, 07/08/02] {MouseMove . (Position . 378 425) (Message . 200) (Window . "Internet Explorer_Server" "-")} [00:00:07.750, 0000000036, 07/08/02] {Eye . (Position . 939 743)} [00:00:07.750, 0000000038, 07/08/02] {MouseMove . (Position . 379 421) (Message . 200) (Window . "Internet Explorer_Server" "-")} [00:00:07.800, 0000000039, 07/08/02] {MouseMove . (Position . 379 420) (Message . 200) (Window . "Internet Explorer_Server" "-")} [00:00:07.860, 0000000041, 07/08/02] {MouseMove . (Position . 380 419) (Message . 200) (Window . "Internet Explorer_Server" "-")} [00:00:07.910, 0000000042, 07/08/02] {MouseMove . (Position . 381 418) (Message . 200) (Window . "Internet Explorer_Server" "-")} [00:00:07.970, 0000000043, 07/08/02] {E ye . (Position . 187 624)} [00:00:07.970, 0000000044, 07/08/02] {ButtonDown . (Position . 381 418) (Moved . 882.0) (Message . 201) (Window . "Internet Explorer_Server" "-")} [00:00:07.970, 0000000045, 07/08/02] {CaptureImage . WT0208070115400001.jpg} [00:00:07.970, 0000000046, 07/08/02] {MouseMove . (Position . 381 418) (Message . 200) (Window . "Internet Explorer_Server" "-")}
Figure 1: Example of data collected by the WebTracer However, no tool currently exists to allow the cooperation of the above tasks effectively, although each task requires sophisticated methodologies. Therefore, conventional methods had to utilize much less data than was actually performed by the users . In this research, we have developed an integrated usability evaluation tool, called WebTracer, which can record user operational data without discontinuation of user operational data and can be replayed. In addition, we demonstrated WebTracer’s effectiveness through an experimental evaluation.
2
WebTracer
WebTracer is an integrated environment for web usability testing. It can record a user’s browsing operations, replay the user’s recorded browsing history, and provide analysis tools which can depict graphs and calculate statistical equations. WebTracer is optimize d especially in the following two features.
2.1
Recording web operation
WebTracer records the various user operational data needed for replay and analysis. Specifically, WebTracer records user’s gazing points via the camera eye, mouse movements and clicks, keyboard inputs, and the screen image of the browsed pages . An example of data collected by WebTracer is shown in Figure 1. Unless the appearance of the browsed page changes, WebTracer does not record browsed screen image. The image is captured only when a transition of the browsed page is triggered by a user's events (e.g., mouse click to follow the next links). Thus, the size of the recorded image can be significantly reduced to 1/10 to 1/20 of the size of recorded data when compared with data recorded in an Mpeg-2/4 format.
2.2
Usability testing support based on replay and summary
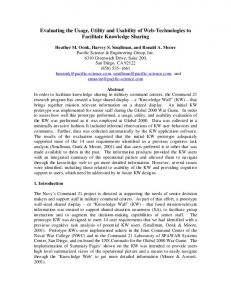
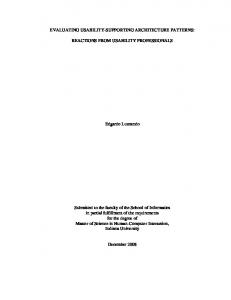
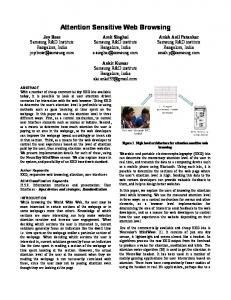
WebTracer can support usability testing by using a replay of the user’s operations, summarized data, and graphs derived from the recorded data. By using the summarized data, we can capture the characteristics and statistics of each page, which helps with the analysis of a Web site. Recorded data are summarized in the form of a table for every page, as is shown in Figure 2. The data can also be shown in graph form. An e xample of an eye movement statistics graph is shown in Figure 3. In addition, an example of the replay screen with the eyemark of the user (the user’s gazing point) is shown in Figure 4. The replay feature reproduces operations, such as the eyemark
and mouse cursors, operations performed when the page is being browsed. In another window, WebTracer can display other events , such as a keystroke. Moreover, at any time during the recording, we can insert annotations and replay these annotations later.
Figure 2: Example of a summary (summarized browsing history)
Eye movement distance Eye movement speed
Order of browsed pages
Figure 3: Example of eye movement statistics graph
Eyemark
Mouse cursor
Figure 4: Example of replay screen with eyemark
3
Experimental Evaluations
We have conducted an experiment, to evaluate the effectiveness of WebTracer in a Web usability evaluation. In the experiment, we asked the three subjects to find objective information within a
company Website. Then, with the support of WebTracer, the subjects were interviewed and their comments were recorded. Table 1: The average number of comments by three subjects Phase1: Summary and Graph Phase2: Replay Phase3: Subject’s memory Phase4: Fast forward replay
3.1
Task1 0.7 7.7 2.3 0.7
Task 2 2.3 13.7 0.0 0.7
Task3 2.3 12.0 0.0 1.7
Task 4 1.7 8.0 1.3 1.0
Task5 2.3 18.7 0.3 3.3
Total 9.3 60.0 4.0 7.3
(%) 11.6 74.4 4.9 9.1
Experiment Design
First, we asked the three subjects who often use the WWW to do a task, and we recorded the operational data using the WebTracer. Tasks for the subjects included gathering the following five pieces of information from a company Website. Task 1: finding the way to a certain place in the company Task 2: finding out the number of employees Task 3: finding information about compensation benefits of the company Task 4: finding specific news about the company Task 5: finding a technical method of construction Secondly, we interviewed each subject about the ease of using an object Website after the end of a task. The interview is divided into four phases , and the outline of each phase is as follows. Phase 1: An interview based on statistics obtained from recorded data. WebTracer shows the summarized browsing history . We interviewed each subject based on the summary and the eye movement graph as shown in Fig. 2. We had the subject point out the difficulty of use in focusing on a web page with both the large moving distance and moving speed of the subject’s gazing point. Phase 2: The interview based on the replay screen in which the eyemark was placed. W e had the subject point out the difficulty of use with the replay screen as shown in Fig. 3 regarding the web page from which the comment was obtained by phase 1. Phase 3: The interview based on the memory of the subject. We conducted an interview based on the memory of the subject for whom the whole task was performed. Comments which were obtained and which overlapped by phase 2 are not included in the number of comments obtained by this phase. Phase 4: The interview based on the fast forward replay screen. W e had the subject point out the difficulty of use with the fast-forwarding replay screen. Comments which were obtained and which overlapped by phase 3 are not included in the number of comments obtained by this phase.
3.2
Results and Discussion
The average execution time per task in the experiment was 2 minutes and 48 seconds. Also, the average time of the interview was 19 minutes. Therefore, the total time spent for entire process was 21 minutes and 48 seconds. The average number of comments given by the three subjects is summarized in Table 1. For execution time, we obtained 16 comments on average. The comments include usability problems, thinking during operation. We assume that the unit of a comment is every sentence uttered by a
subject. The number of comments becomes material data of the usability problem for evaluator judges. As shown in Table 1, about 95% of the entire comments are obtained from the graph and replay (Phase 1, 2 and 4) using the WebTracer. Moreover, about 74% of the entire comments are obtained from Phase2 by replaying of WebTracer. We can see that the replay function of the user operation which added the eyemark in WebTracer is effective from the experiment results. Subjects can remember their operations, can point out the points, which is hard to use, and a evaluator can ask an interview more easily by replaying of WebTracer. We believe that the WebTracer made the phases of this evaluation experiment possible. For example, we consider the case where "Usability laboratory" carries out the interview phases . The "Usability laboratory" can be applied to Phase2 and Phase4, if the evaluator records the subjects’ operations with a video camera. However, by replay of the video camera, we still cannot know a user's gazing point. Therefore, we assume that the number of comments obtained from subjects decreases compared with the WebTracer. Phase3 is also made possible by performing a questionnaire-based evaluation at the end of the task. However, "Usability laboratory" cannot be used for Phase1, since no quantitative result is available. “Usability laboratory” cannot record a detailed user’s operational data and show the summarized data. Consequently, 9.3 comments in Table 1 would not be available. As a result, the “Usability laboratory” would miss 11.6% of the entire comments shown in Table 1.
4
Conclusions
In this research, we have presented an integrated usability evaluation tool, WebTracer, and have also conducted an experimental evaluation. WebTracer allows evaluators to perform an efficient Web usability evaluation with optimized features, i.e., with recording operations, replay, summaries and graphs. Web Tracer records the user’s gazing point as well as the user's operations, and replays the user’s operation in the same screen. From the user’s operations performed in each page, we were able to capture the characteristics of the page. As a result of the evaluation experiment, we have obtained many useful comments with respect to usability. Our future work includes refining the evaluation procedure, as well as comparing the proposed method with other evaluation methods. If WebTracer spreads widely, research of Web usability will become less difficult. Moreover, a usability evaluation in an actual development also becomes eas ier. Furthermore, we expect that software which is easier to use will increases.
References Etgan, M. & Cantor, J. (1999). What does getting WET (Web Event-logging Tool) mean for web usability?, HFWEB99. Goto, K. & Cotler, E. (2002). Web ReDesign. Peason Education. Nielsen, J. (1993). Usability Engineering. Academic Press. Okada, H., & Asahi, T. (1999). GUI TESTER: log-based usability testing tool for graphical user interfaces. IEICE Trans. on Information And Systems, Vol.E82-D, No.6, pp.1030-1041. Paganelli, L. (2002). Intelligent analysis of user interactions with web applications. IUI'02. Torii, K., Matsumoto, K., Nakakoji, K., Takada, Y., Takada, S., & Shima, K. (1999). Ginger2: An environment for computer-aided empirical software engineering. IEEE Trans. on Soft. Eng., Vol.25, No.4, pp.472-492.