each stage, geological, geochemical and geophysical ..... Mineral deposit exploration is a multi-stage ... (Propilitic, Argyllic and Phallic) are integrated into one.
American Journal of Applied Sciences 5 (9): 1187-1198, 2008 ISSN 1546-9239 © 2008 Science Publications
Weighting Spatial Information in GIS for Copper Mining Exploration Farhad Hosseinali and Ali Asghar Alesheikh Faculty of Geomatics Engineering, K.N. Toosi University of Technology ValyAsr Street, Mirdamad Cross, Tehran, Iran 19967-15433 Abstract: Exploration of new mines is vitally important for human life. Geospatial Information Systems (GIS) can be effectively used in the gathering, weighting, analyzing and presenting spatial and attribute information to facilitate the mine exploration process. The success of mine exploration largely depends on: the identification of governing factors, the determination of their impacts and the selection of suitable models to integrate the parameters. Weighting methods are classified into two main groups: data-driven and knowledge-driven. Six weighting methods are identified and scientifically assessed in this study, namely; Ratio Estimation, Analytical Hierarchy Process (AHP), Delphi, Weight of Evidence, Logistic Regression and Artificial Neural Networks (ANN). The first three are examples of knowledge-driven and the last three are classified in the data-driven group. In order to evaluate the methods, the information of 26 copper boreholes are used. Numerical experimentations showed that the artificial neural network used in this study is the most accurate method because it could predict the characteristics of all boreholes correctly. It is shown that knowledge-driven methods are very much affected by the degree of knowledge and the specialization of experts. The results indicated that AHP is the most successful method among knowledge-driven class and could predict the characteristics of 82% of boreholes correctly. Key words: Data-driven, knowledge-driven, mineral potential map, artificial neural networks INTRODUCTION Geologists, miners and engineers are dealing with problems related to the analysis and manipulation of geospatial information to explore minerals for many decades[5, 22]. It is a multistage investigation that begins at a small scale maps and progresses to larger ones. At each stage, geological, geochemical and geophysical data are collected, processed and analyzed to produce Mineral Potential Maps (MPM)[10]. Even after labor intensive studies on a deposit, predicting the exact location and the amount of minerals under the ground is difficult. Boreholes must be drilled to find out the exact characteristics of the underground deposits. However, drilling is expensive if not impossible. A GIS has the potential for storing, updating, retrieving, displaying, processing, analyzing and integrating various geospatial data. GIS can produce MPMs easily and integrates the results of different investigations such as geological, geophysical and geochemical studies[15, 29]. Using a powerful method for weighting of the information, GIS can provide a better prediction on the potential of mineralization
under the ground[35]. The basic pre-requisite for MPM generation is the determination of weights and rating values representing the relative importance of factors and their categories[2, 19] . Determining the relative importance of information is called map layer weighting[24]. In general, each layer of information includes some sub-classes. The importance of sub-classes has to be determined before assigning weights to the layers. This procedure is called calibration and the weights are assigned to the classes are called rating[4]. There are two main methods for weighting the information layers; data-driven and knowledge-driven[5,27]. In data-driven methods, the importance of data is determined using data itself while in knowledge-driven methods, an expert or a group of experts perform this task. Six methods are implemented in this research to scientifically assess weighting predictors of copper mineralization and producing MPMs. They are: Analytical Hierarchy Process (AHP), Delphi and Ratio Estimation (RE) (as knowledgedriven) and Logistic Regression (LR), Weight Of Evidence (WOE) and Artificial Neural Networks (ANN) (as data-driven methods).
Corresponding Author: Ali Asghar Alesheikh, Faculty of Geomatics Engineering, K.N. Toosi University of Technology ValyAsr Street, Mirdamad Cross, Tehran, Iran, 19967-15433
1187
Am. J. Applied Sci., 5 (9): 1187-1198, 2008 KNOWLEDGE-DRIVEN METHODS
J
The weights and ratings in this category are determined using subjective experts knowledge. Although, it can be implemented in various ways[34], three approaches are used in this investigation: AHP, Delphi and Ratio Estimation.
•
•
Preferences for different alternatives depend on separate criteria which can be reasoned about independently and given numerical scores. The score for a given criteria can be estimated from sub-criteria. That is, the criteria can be arranged in a hierarchy and the score at each level of the hierarchy can be calculated as a weighted sum of the lower level scores. At a given level, suitable scores can be calculated from only pair-wise comparisons.
The scores are arranged in a matrix and the weights for each of the compared elements are calculated using various methods such as eigenvector. This gives a weight for each element within a cluster as well as inconsistency ratio[31]. The inconsistency checking can be done through the following relations: II (Inconsistency Index) =
λ max − n n −1
II I.R = I.I.R
(1) (2)
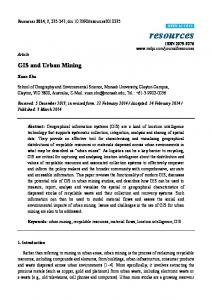
Where n is the dimension of comparison matrix, λmax is the maximum eigenvalue of the comparison matrix and I.I.R is the inconsistency index of a random matrix with the same dimension as the comparison matrix. Finally, I.R is the inconsistency ratio. If I.R is less than 0.1 the comparisons are consistent, if not they should be compared again[21]. The final weight of each alternative or sub-criteria (in a hierarchy like Fig. 1) is obtained using Equation 3. The sum of calculated weights for each comparison matrix is equal to 1. w A = w11w1 + w 21w 2 w B = w12 w1 + w 22 w 2
(3)
A
W12 Goal
W21 W2
AHP: AHP is a mathematical decision making technique that allows for the rational evaluation of weightings[32]. It determines an optimal solution through the use of simple representation of a hierarchical model. AHP relies on three fundamental assumptions: •
W11
W1
K
B
W22
Fig. 1: Calculating the Final Weights in a Hierarchy of AHP Delphi: Delphi provides reliable information for weighting[29]. The method gathers knowledge from a group of experts by means of a series of questionnaires and their feedbacks. Anonymity, controlled feedback and statistical response characterize Delphi[12]. These characteristics provide distinct advantages over the conventional face-to-face conference as a communication tool. A team is chosen to do the Delphi activities. They invite experts and prepare the questionnaires. The questionnaires are distributed among the participants and after some sessions of conversation participants often converge to unique decisions about each related weight. Ratio Estimation: This approach is categorized in rating methods of weighting[24]. First the criteria are ranked from the most important to the least important. Then, the method starts by assigning an arbitrary weight (i.e. 100) to the most important criterion, as well as to the least important attribute. The value for the least important criterion is, then, divided by the score for each criterion: that is, the ratio is equal to wi/w*, where w* is the lowest score and wi is the score for the ith criterion. This ratio expresses the relative desirability of a change from the worst level of that criterion to its best value. This states how much more or less valuable an alternative is than the best, in a ratio sense. This procedure is repeated for the next most important criterion until weights are assigned to all criteria. Finally, the weights are normalized by dividing each weight by the total[18]. DATA-DRIVEN METHODS Data-driven method reduces the problem of biased or incorrect decisions that knowledge-driven method
1188
Am. J. Applied Sci., 5 (9): 1187-1198, 2008 may have. For minimizing the subjectivity and bias in the weighting process, quantitative methods, namely, statistical analysis, deterministic analysis, probabilistic model and distribution free approaches may be utilized[14]. Data-driven models need samples of results to be executed and evaluated. Weigh of evidence (WOE): The WOE is a data-driven and discrete multivariate statistical method that uses conditional probabilities to determine the relative importance of parameters[11]. Prior and posterior probabilities are the major concepts which are used in this approach to delineate the relative importance of data. If a phenomenon has been assessed in a region, then, it is present in some points and is absent in others[8]. Thus, the probability of occurrence of this phenomenon can be calculated by dividing the number of occurrence samples to the whole assessed samples[30]. This probability is called prior probability. The posterior probability is the conditional probability of existence of the phenomena when the predictor exists. The following equations formulate the basis of WOE[5]: log it(D | B1
B2
B3 ... Bn ) = logit(D) +
n i =1
Wis
(4)
Where, logit is the natural logarithm, D is an event, B1, B2…Bn are binary maps which are considered as a predictor for D and Wis is the weight which is changed to Wj+ when the predictor Bj is present and also is changed to Wj− when the predictor Bj is absent ( Wj+ and Wj− are the positive and negative weights of evidence). If one or more data is not available somewhere, the W is 0 for that area. The contrast C provides a measure of spatial association between a set of occurrence points and an evidence pattern and is derived from:
of occurrences gives the best measure of spatial correlation. For each estimated weight, the variance can be calculated. The sum of variances for two weights is the variance of contrast. Dividing the contrast by its standard deviation, the studentized value can be calculated[1]. The studentized value serves as an approximate test of the spatial association between the occurrence points and the test domain. It is an informal test that C is significantly different than zero, or the contrast is likely to be real. This test is applied when a small area being considered and there is only a small number of occurrence points (In such cases the uncertainty of the weights is large and C is meaningless). Contrast and studentized values are suitable parameters to determine cut off values to produce a binary map from a continuous map[16]. Studentized values can be used to produce uncertainty maps as well. Logistic Regression: Logistic Regression (LR) is a part of statistical models called generalized linear models[20]. LR describes the relationship between the response (dependent) and the linear sum of the predictor (independent) variables. LR can predict a discrete outcome, such as MPM, from a set of variables that may be continuous, discrete, dichotomous, or a mix of any of these[25]. Generally, the dependent or response variable is dichotomous like presence/absence or success/failure. Logistic regression makes no assumption about the distribution of the independent variables[23]. The presence/absence of copper potential can be transformed into a continuous probability space ranging from 0 to 1[17]. Values close to 1 represent high probability of presence; whereas, values close to 0 represent high probability of absence.
Artificial neural networks (ANN): Artificial neural networks have been used in many branches of science due to their versatile characteristics[13]. An artificial neural network operates by creating connections C = W+ − W− (5) between many different processing elements, each analogous to a single neuron in a biological brain. Each If more occurrences occur within a pattern than neuron takes many input signals, then, based on an would be expected by chance, then W+ is positive and internal weighting system, it produces a single output W- is negative. In contrary, W+ is negative and W- is signal that is typically sent as input to the positive when fewer points occur within a other neurons[28]. pattern by chance. Ability of learning is one of the most important Since Equation 4 is derived assuming the characteristics of ANN[3]. Based on the type of training, conditional independency between predictor maps, it is ANNs are categorized into two main classes of necessary to evaluate the conditional independency supervised and unsupervised networks[6]. The network between layers of data before using WOE[9]. The weights are modified in the training process through a maximum contrast in a large area with a large number number of learning algorithms based on back 1189
Am. J. Applied Sci., 5 (9): 1187-1198, 2008 propagation learning[7]. The most widely used back propagation algorithms are gradient decent and gradient decent with momentum. A feed forward multilayer network consists of three layers namely; input, output and hidden layers. Each layer in a network contains adequate number of neurons depending on specific applications. The number of neurons in the input layer is equal to the number of data sources and the number of neurons in the output layer is limited by the application and is represented by the number of outputs. The number of hidden layers and the number of neurons in each layer depend on the architecture of network and usually are determined by trial and error[33]. Index overlay: Index overlay is used in this research to integrate various data layers. In index overlay method, each class of maps is given a different score allowing for a flexible weighting system. The table of scores and the map weights can be adjusted to reflect the judgment of experts in the domain of the application under consideration[5]. At any location, the output score S is defined as: n
S=
i =1 n
Sij Wi
i =1
(6)
Wi
Where, S is the assigned score to the cell (or polygon), Wi is the weight of the ith map and Sij is the weight of jth class from the ith map. When a map is binary Sij will be 0 or 1. The biggest disadvantage of this method probably lies in its linear additive nature. However, as the method is the same for all of the weighting methods it will not have a biased effect. MATERIAL AND METHODS Study area: The study area of this research is located in the centre of Iran (latitude: 31º 39´ and longitude: 53º 51´) which is called Ali-Abad copper deposit. The area of study is about 1 squared kilometer. Mineral deposit exploration is a multi-stage process that starts with feasibility studies on small scale maps and/or aerial images[26]. This paper focuses on the final stage of exploration which is a large scale investigation and is performed on large scale maps (e.g. 1:1000). At this scale the existence of a mineral (e.g. copper in this study) is investigated by considering the existence of the evidences.
Data preparation and spatial analysis were done by AutoCAD 2006 and ArcGIS 9.2 software. A software was developed to implement AHP in MATLAB v.7 environment. SPSS v9 was used to construct LR model. Figure 2 demonstrates the processes followed to prepare nine data layers. In the first step, all data layers are digitized from hardcopy maps and georeferenced. The values of contour lines are assigned and finally the Digital Terrain Models (DTM) of the related layers are generated in ArcGIS. These information layers are copper predictors that are called factor maps. Maps of geoelectric, geomagnetic and geochemical anomaly are classified into three classes of anomaly, medium and background. Due to its simplicity and efficiency in 2 overlaying, maps are converted to raster in 1x1 m resolution. Finally maps of different alterations (Propilitic, Argyllic and Phallic) are integrated into one layer. The layers are then weighted and integrated to produce MPM. The resulting factor maps are illustrated in Fig. 3. Boreholes are used to check the efficiency of each weighting method. Figure 4 represents the implemented procedure of knowledge driven models. AHP has high compatibility to work with hierarchical data, hence, AHP is used for data calibrating and weighting. Using AHP in two cases of with/without hierarchy facilitates assessing the effect of hierarchy on AHP performance. Experts did the pairwise comparisons in this case. Since the faults layer did not present a statistically meaningful effect on mineralization, the layer was removed from the weighting process. Pair-wise comparisons are performed on nine standard statements of AHP and the digits from 1 to 9 are assigned to the statements where the higher the number is, the stronger the preference is. The same experts performed both AHP and the Ratio Estimation and assigned the weights. A complete package of an invitation letter, prepared data layers, elements of Delphi process and questionnaires were sent to several expert persons. The questionnaires were filled out and presented to Delphi process. In the process of Delphi the opinions were converged and participants became successful in weighting the layers. Due to the separation of two parts of host rock and phillic alteration, the experts identified that one of the faults may have a negative effect on mineralization. Therefore, they proposed three spatial buffers (30, 45 and 60 meters) around the faults. Three ratings were then assigned to the buffers (0.7, 0.2 and 0.1 respectively).
1190
Am. J. Applied Sci., 5 (9): 1187-1198, 2008
Fig. 2: Process of data preparation and the resulting factor maps 1191
Am. J. Applied Sci., 5 (9): 1187-1198, 2008
Fig. 3: Factor maps, boreholes and a fault with its buffers Geochemical Anomaly Geoelectric Anomaly Geomagnetic Anomaly Alterations Host Rock
Calibrating with AHP Calibrating with AHP Calibrating with AHP Calibrating with AHP
Weighting with AHP (with Hierarchy) Weighting with AHP (without Hierarchy) Weighting with Ratio Estimation
Bed Rock Dike Brecciated Zones Faults
Weighting with Delphi Buffering
Calibrating with AHP
Integrating Using Index Overlay
Mineral Potential Map
Fig. 4: Flow diagram of preparing MPM using knowledge-driven methods 1192
Am. J. Applied Sci., 5 (9): 1187-1198, 2008 Three data-driven methods have been performed as presented in Fig. 5 and 6. To execute the data-driven procedures, 16 boreholes (out of 26 existed ones) are randomly chosen. The amount and quality of copper in the boreholes are the basis to call a borehole good or not. By taking the statistics of the boreholes into account, experts classified the quality of boreholes to bad (poor) or good (suitable). The spatial dependency among data has to be considered and the dependent data must be removed from the model. If a layer does not cover any boreholes, it is removed from further processing. Observing these constraints, the remaining layers were reduced to: geoelectric, geomagnetic, geochemical, host rock and phillic alteration. These layers are tested for spatial correlation. Pair-wise comparisons and χ2 tests revealed that phillic alteration have significant spatial correlation with Host Rock. Consequently, the two layers are
Geochemical Anomaly Geoelectric Anomaly
merged using Boolean AND operator to build the Host Rock And Phillic Alteration (HRAPA) layer. LR uses binary response values for building a model. A value of 1 is assigned to good boreholes and 0 is assigned to bad ones. The predictor parameters are the values of the four used layers, (namely; geoelectric, geomagnetic, geochemical and HRAPA) at 16 boreholes locations. The natural values (the values extracted directly from hardcopy maps) of geoelectric, geomagnetic and geochemical maps are normalized to lie between 0 and 1. This brings data into an equivalent rational scale; otherwise, the target coefficients will have different ranges. For constructing the LR model, the values are uploaded in SPSS 9 software. The process showed that the values of geomagnetic layer cannot pass the significance test, therefore, this layers was removed from further processing. The model is, however, passed the tests of goodness of fit such as Hosmer and Lemeshow test and likelihood ratio test[17].
Making Binary Geoelectric Anomaly Geoelectric Medium
Making Binary
Extracting Weights
Making Binary
Integrating Using Index Ovelay
HRAPA
Mineral Potential Map
Boreholes
Integrating Using WOE
Fig. 5: Flow diagram of implementing WOE Geochemical Anomaly Geoelectric Anomaly
Normalization
Geomagnetic Anomaly
Finding the best architecture and training Neural Network Network
HRAPA
Boreholes
Integrating Using Neural Network
Constructing Logistic Regression Selected Boreholes
Extracting Weights
Extracting Weights
Integrating Using Index Overlay
Integrating Using Index Overlay
Integrating Using Logistic regression
Fig. 6: Flow diagram of constructing LR and implementing ANN 1193
Mineral Potential Map
Am. J. Applied Sci., 5 (9): 1187-1198, 2008 WOE uses binary predictor maps as well. The HRAPA layer is binary itself while geochemical, geoelectric and geomagnetic maps have three classes of; anomaly, medium and background. The later layers are reclassified into two class maps based on experts' opinions. Then, the same 16 boreholes in LR are used to determine the weights. The new information layers are tested for conditional independency, pair by pair. The result showed that geochemical anomaly map and geochemical medium were conditionally dependent and therefore, the geochemical medium map was rejected for further processing. In addition, no borehole falls in anomaly of geomagnetic and only one bad borehole falls in the medium class of geomagnetic, so these layers could not be taken into account either. The remained layers to use in WOE were the maps of: anomaly of geoelctric, medium of geoelectric, anomaly of geochemical and HRAPA. W+ and W- were calculated and C was treated as the weights needed in index overlay. A multi layer perceptron network is designed and implemented in this research. To train the network, 16 randomly selected boreholes are considered. Four layers are used in this case, namely: geoelctric, geomagnetic, HRAPA and geochemical layers. Like LR model, the layers had been normalized in the range of 0 and 1. Output of network is binary; number 1 for good boreholes and 0 for bad ones. Root Mean Squared Errors (RMSE) of responses are calculated for each run. The best network is the one with minimum RMSE. The networks are changed both in number of hidden layers and number of neurons in each hidden layer to produce various RMSEs. PRODUCING MPM
The weights extracted from all models of weightings are entered to Index Overlay model. Then the MPMs are produced by Index Overlay. For the produced MPMs, experts determined the cut-off value for classifying MPMs to two classes of high and low mineral potential. Experts determined 0.4 as a cut-off value for this purpose. Figure 8 represents the final MPMs produced for copper deposit of Ali-Abad using AHP and ANN. RESULTING AND DISCUSSION Table 1 presents the weights assigned to the factor maps in knowledge-driven methods. The table also shows the rating obtained by AHP method. The weights extracted from LR, WOE and ANN are shown in Table 2-4 respectively. Table 1: Weights extracted from knowledge-driven methods Method Delphi Ratio Layer or class AHP process Estimation Geochemical Anomaly 0.157 0.161 0.123 Geomagnetic Anomaly 0.063 0.030 0.135 Geoelectric Anomaly 0.187 0.191 0.158 Brecciated zones 0.087 0.036 0.090 Alterations 0.392 0.401 0.202 Dike 0.013 0.008 0.022 Host Rock 0.087 0.188 0.180 Bed Rock 0.014 0.010 0.090 Faults 0 -0.025 0 Geoelectric, Geomagnetic and Anomaly 0.749 Geochemical Medium 0.198 Back Ground 0.053 Alterations Phillic 0.739 Argillic 0.167 Propilitic 0.094 Bed Rock Tuff 0.220 Lava 0.096 QSC 0.625 ASC 0.059
Table 2: Weights obtained from Logistic Regression Sixteen boreholes are used to build the LR model. Coefficient HRAPA Geochemical Geoelectric Seven boreholes out of 16 are good ones, therefore, the Value 0.927 8.975 0.281 primary probability of being good is 7/16=0.4375. Then, the probability of being a high potential point is Table 3: Values obtained from WOE calculated. If the probability for each pixel exceeds the W+ WContrast (C) Anomaly of Geochemical 7.7142 -1.8281 9.5423 value of 0.4375, it is considered as a high Anomaly of Geoelectric 0.6568 -0.3083 0.9651 potential pixel. Medium of Geoelectric -0.6649 0.4746 -1.1395 Similar method is performed for WOE. Using HRAPA 0.9445 -0.5960 1.5405 Equation 4, MPM is estimated. The cut off value in Table 4: Weights obtained from ANN in two cases of with and WOE is also considered as 0.4375. Therefore, any cell without geomagnetic layer in MPM surpass the cut-off value is classified in high HRAPA Geoelectric Geochemical Geomagnetic potential area. Layers Anomaly Anomaly Anomaly The same 16 boreholes are used for training ANN. With 0.0754 0.0909 0.1417 -8.5420 The output values of ANN do not bear the concept of Geomagnetic Anomaly probability like LR or WOE models. A natural break Without 37.1522 45.7031 220.8821 -------classifies the MPM into two classes of high potential Geomagnetic [19] and low potential . Anomaly 1194
Am. J. Applied Sci., 5 (9): 1187-1198, 2008 The minimum RMSE, 0.2780, in ANN is occurred with two hidden layers, 8 neurons in the first hidden layer and 3 neurons in the second one. After ignoring geomagnetic anomaly layer, the result got better. RMSE showed a meaningful decrease where the minimum RMSE reached to 0.1259. These values are obtained from a network with two hidden layers, 6 neurons in the first and 4 neurons in the second hidden layer. Comparing the numerical weights in Data-driven and Knowledge-driven models revealed that in knowledge-driven methods, alterations and host rock are the most important predictors while date-driven methods detected geochemical anomaly as the major predictor. Knowledge-driven methods have considered positive weights for all probable predictors. In contrast, data-driven methods have assigned negative weights to geomagnetic layer; hence the layer had negative impact on existing copper mineralization.
In brief, ANN has produced the best results. In fact, its MPM includes all 10 test boreholes resulting in a perfect prediction. If Index overlay is not used for information integration, the results of data-driven methods are a bit better than knowledge-driven ones. Figure 7 shows the success rate in predicting the boreholes. Also Fig. 8 represents the best MPMs produced by data-driven and knowledge-driven approaches. Low Potential High Potential Bad Boreholes Good Boreholes
A
a Low Potential High Potential Bad Boreholes Good Boreholes
b Fig. 7: Percent of correct prediction of (a) 26 boreholes and (b) 10 test boreholes. Numbers refer to the used methods: 1- AHP with hierarchy, 2- AHP without hierarchy, 3- Delphi, 4- Ratio Estimation, 5- WOE and Index Overlay, 6WOE, 7- LR and Index Overlay, 8- LR, 9- ANN with using Geomagnetic layer and Index Overlay, 10- ANN without using Geomagnetic layer and Index Overlay, 11- ANN with using geomagnetic and 12- ANN without using Index Overlay.
B
Fig. 8: MPM produced by (A): ANN without considering geomagnetic anomaly into account and without using index overlay, (B): AHP with hierarchy 1195
Am. J. Applied Sci., 5 (9): 1187-1198, 2008 Data-driven methods of weighting are explicit and must have some information from the results (like boreholes in this case). This condition is limiting the application of weighting to the number of samples and their reliability. Moreover, weighting by data-driven methods depends to the opinions of experts for determining and preparing efficient data, proper way of classification and interpretation. Ratio Estimation suffers from its weak theoretical base. Delphi is a structured way to extract the hidden knowledge of experts and try to protect the judgments from biased decision. Though AHP can be executed by a group of experts, the consistency of judgments rarely is obtained. Pair-wise comparisons and consistency checking of judgments have made AHP a reliable approach for weighting of spatial information.
•
•
•
CONCLUSIONS AND RECOMMENDATIONS In this research, six different weighting procedures viz. Ratio Estimation, Analytical Hierarchy Process (AHP), Delphi, Weight of Evidence, Logistic Regression and Artificial Neural Networks (ANN) were applied for producing MPMs in part of Ali-Abad copper deposit in Iran. A comparative evaluation was also carried out. The ANN approach produced the most accurate map. This may be attributed to the objective approach where weights for factors are determined through ANN connection weight approach. In short, the following observations were made based on this research: •
•
•
If the effects of some factors are not easily demonstrated by numeric equations and expert judgment is required Delphi can be used to produce a reliable measurement of judgments by a group of experts. Due to its hierarchical nature of this study, Delphi did not bit AHP results. Logistic regression strongly depends on boreholes′ situation and is concerned about the strength of the overall fit between the dependent variable and the independent parameters. In this study logistic regression was hardly fitted and could only predict %88.46 of boreholes correctly. The weight of evidence approach emphasizes spatial context by focusing on geological features that may have localized mineral deposition. In this case study, the extracted weights from WOE were suitable for Index overlay. It ranked as a second best data-driven method. ANN could nicely process the relationship between the predictors and situation of boreholes and predict the high potential area. For all boreholes true prediction were obtained. ANN had an extreme flexibility faced with data. In a way that even with using geomagnetic anomaly, the results are relatively good and with eliminating this data the best results are obtained.
Therefore, the integration of different factors in GIS environment using a variety of weighting procedures may serve as one of the key objectives in any MPMs generation. It is recommended that uncertainty in weighting methods to be studied further. It is also recommended that other methods for integrating the weights obtained from data-driven approaches to be tested. Providing alternative solutions to integrate the weights obtained from data-driven and knowledge-driven approaches can be another option for more researches.
Ratio Estimation is based on the assumption that a standard alternative exists and the decision maker is able to state valuations of the other alternatives in a ratio form. If no standard alternative exists and such an alternative cannot be created, ratios of value differences are compared. This method may not produce reliable results in comparison to AHP and Delphi. AHP is a simple systematic engineering method to quantitatively analyze non-quantitative objects. It 1. cannot only fully consider the researcher’s subjective judgment during the quantitative and/or qualitative analysis, but also expresses the complex 2. system in a hierarchic structure from interrelation between inside and outside of the system and by analyzing step by step, helps the decision-making process to be systemic, numerical and modeling. It 3. was shown that employing hierarchy improves efficiency of the used method. Among knowledge4. driven models, AHP with hierarchy produced the best results. 1196
REFFERENCES Agterberg, F. and Q. Cheng, 2002. Conditional Independence Test for Weights-of-Evidence Modeling, Nat. Resour. Res., 11(4): 249-255. Asadi, H. and M. Hale, 2001. A Predictive GIS Model for Mapping Potential Gold and Base Metal Mineralization in Takab Area, Iran, Computer and Geosci., 27 (8): 901-912. Beale R. and T. Jackson, 1998. Neural Computing: An Introduction, Institute of Physics Publishng. Berry, J.K., 2002. Map analysis: Procedures and Applications in GIS Modeling, Basis Press.
Am. J. Applied Sci., 5 (9): 1187-1198, 2008 5. 6.
7.
8.
9.
10. 11.
12. 13.
14. 15.
16.
Bonham-Carter, G., 1994. Geographic Information Systems for Geoscientists: Modelling with GIS. Pergamon Press, Oxford, pp: 398. Brown, W., T. Gedeon, D. Groves and R. Barnes, 2000, Artificial Neural Networks: A new method for mineral prospectivity mapping: Australian J. Earth Sci., 47 (4): 757-770. Brown, W., D. Groves and T. Gedeon 2003. Use of Fuzzy Membership Input Layers to Combine Subjective Geological Knowledge and Empirical Data in a Neural Network Method for MineralPotential Mapping. Natural Resourc. Res., 12 (3): 183-200. Calcerrada, R. and S. Luque, 2006. Habitat Quality Assessment using Weight-of-Evidence based GIS modelling: The Case of Picoids Tridactylus as Species Indicator of the Biodiversity Value of the Finnish Forest, Ecological Modelling. 196: 62-76. Carranza, E. and M. Hale, 2002. Where are porphyry copper deposits spatially localized? A Case Study in Benguet Province, Philippines, 11 (1): 45-59. Chen, Y., 2004. MRPM: three visual basic programs for mineral resource potential mappin. Comput. and Geosci., 30 (9-10): 969-983. Ford, A., T. Blenkinsop, 2007. Combining fractal analysis of mineral deposit clustering with weights of evidence to evaluate patterns of mineralization: Application to copper deposits of the Mount Isa Inlier, NW Queensland, Australia. Ore Geology Reviews. Available on line 7 March 2007. Fowles, J., 1978. Handbook of Futures Research. Westport CT, Greenwood Press. Connecticut. Graupe, D., 2007. Principles of Artificial Neural Networks, Advanced Series in Circuits and Systems. 2nd Edn. World Scientific Publishing Company, pp: 250. Hanne, T., 2000. Intelligent Strategies for Meta Multiple Criteria Decision Making, Springer, pp: 236. Harris, J., Wilkinson, L. and Grunsky, E., 2000. Effective use and interpretation of lithogeochemical data in regional mineral exploration programs: Application of Geographic Information Systems (GIS) technology. Ore Geolo. Rev., 16 (3-4): 107-143. Harris, J., L. Wilkinson, K. Heather, S. Fumerton, M. Bernier, J. Ayer and R. Dahn, 2001. Application of GIS processing techniques for producing mineral prospectivity maps - A case study: mesothermal Au in the Swayze Greenstone Belt, Ontario, Canada. Nat. Resour. Res., 10 (2): 91-124.
17. Hosmer D. and S. Lemeshow, 2000. Applied Logistic Regression, 2nd Edn., John Wiley and Sons Inc. 18. Huang, S., 1997. Application of optimum stratified sampling and separate ratio estimation in stochastic copper loss of transmission system evaluation IEE Proceedings-Generation, Transmission and Distribution, 144 (2): 207-212. 19. Kanungo, D., M. Arora, S. Sarkar and R. Gupta, 2006. A comparative study of conventional, ANN black box, fuzzy and combined neural and fuzzy weighting procedures for landslide susceptibility zonation in Darjeeling Himalayas, Engineering Geol. 85: 347-366. 20. Kleinbaum, D. and M. Klein, 2005. Logistic Regression. 2nd Edition. Springer, pp: 536. 21. Kolat, C., V. Doyuran, C. Ayday and L. Süzen, 2006. Preparation of a geotechnical microzonation model using Geographical Information Systems based on Multicriteria Decision Analysis. Engineering Geology. 87: 241-255. 22. Ligas, P. and M. Palomba, 2006. An integrated application of geological-geophysical methodologies as a cost-efficient tool in improving the estimation of clay deposit potential: Case study from South-Central Sardinia (Italy). Ore Geology Reviews. 29 (2): 162-175. 23. Long, J. and Freese, J., 2005. Regression Models for Categorical Dependent Variables using Stata, Stata Press, pp: 528. 24. Malczewski, J., 1999. GIS and Multicriteria Decision Analysis. John Wiley and Sons INC. pp: 392. 25. Menard, S., 2001. Applied Logistic Regression Analysis, 2nd Edn. Sage Publications Inc. pp: 128. 26. Moon, C., M. Whateley and A. Evans, 2006. Introduction to Mineral Exploration, 2nd Edn. Blackwell Publishing, pp: 496. 27. Porwal, A., E. Carranza and M. Hale, 2003. Knowledge-driven and data-driven fuzzy models for predictive mineral potential mapping: Natural Resources Research, 12 (1): 1-25. 28. Porwal, A., E. Carranza and M. Hale, 2003a. Artificial Neural Networks for Mineral-Potential Mapping: A Case Study from Aravalli Province. Natural Resources Research, 12 (3): 155-171. 29. Rowe, G. and G. Wright, 2001. Expert opinions in forecasting: The role of the Delphi technique, in J. S. Armstrong (ed.), Principles of Forecasting. Boston: Kluwer Academic Publishers, pp: 125-144.
1197
Am. J. Applied Sci., 5 (9): 1187-1198, 2008 30. Roy, R., D. Cassard, P. Cobbold, E. Rossello, M. Billa, L. Bailly and A. Lips, 2006. Predictive mapping for copper-gold magmatic-hydrothermal systems in NW Argentina: Use of a regional-scale GIS, application of an expert-guided data-driven approach and comparison with results from a continental-scale GIS. Ore Geology Reviews, 29 (3-4): 260-286. 31. Saaty, T., 1980. The Analytic Hierarchy Process. NY, McGraw Hill. 32. Saaty, T., 2001. Decision Making for Leaders: The Analytic Hierarchy Process for Decisions in a Complex World. RWS Publications Pittsburg. pp: 323.
33. Samanta, B., S. Bandopadhyay and R. Ganguli, 2006. Comparative Evaluation of Neural Network Learning Algorithms for Ore Grade Estimation. Mathematical Geology, 38 (2): 175-197. 34. Tsiporkova, E. and V. Boeva, 2006. Multi-step ranking of alternatives in a multi-criteria and multiexpert decision making environment. Information Sciences, 176 (18): 2673-2697. 35. Zhou, W., G. Chen, H. Li, H. Luo and S. Huang, 2007. GIS application in mineral resource analysisA case study of offshore marine placer gold at Nome, Alaska. Computers and Geosciences, 33 (6): 773-788.
1198