What’s in a p-value in NLP? Anders Søgaard, Anders Johannsen, Barbara Plank, Dirk Hovy and Hector Martinez Center for Language Technology University of Copenhagen
[email protected]
Abstract
2005; Berg-Kirkpatrick et al., 2012). Specifically, most system comparisons across words, sentences or documents use bootstrap tests (Efron and Tibshirani, 1993) or approximate randomization (Noreen, 1989), while studies that compare performance across data sets use rank-based tests such as Wilcoxon’s test. The question we wish to address here is: how likely is a research finding in NLP to be false? Naively, we would expect all reported findings to be true, but significance tests have their weaknesses, and sometimes researchers are forced to violate test assumptions and basic statistical methodology, e.g., when there is no one established metric, when we can’t run our models on full-length sentences, or when data is biased. For example, one such well-known bias from the tagging and parsing literature is what we may refer to as the WSJ FALLACY. This is the false belief that performance on the test section of the Wall Street Journal (WSJ) part of the English Penn treebank is representative for performance on other texts in English. In other words, it is the belief that our samples are always representative. However, (the unawareness of) selection bias is not the only reason research findings in NLP may be false. In this paper, we critically examine significance results in NLP by simulations, as well as running a series of experiments comparing state-of-the-art POS taggers, dependency parsers, and NER systems, focusing on the sensitivity of p-values to various factors. Specifically, we address three important factors: Sample size. When system A is reported to be better than system B, this may not hold across domains (cf. WSJ FALLACY). More importantly, though, it may not even hold on a sub-sample of the test data, or if we added more data points to the test set. Below, we show that in 6/10 of our POS tagger evaluations, significant effects become insignificant by (randomly) adding more test data.
In NLP, we need to document that our proposed methods perform significantly better with respect to standard metrics than previous approaches, typically by reporting p-values obtained by rank- or randomization-based tests. We show that significance results following current research standards are unreliable and, in addition, very sensitive to sample size, covariates such as sentence length, as well as to the existence of multiple metrics. We estimate that under the assumption of perfect metrics and unbiased data, we need a significance cut-off at ⇠0.0025 to reduce the risk of false positive results to 200, unless otherwise stated. In our experiments, we average across 3 runs for POS and NER and 10 runs for dependency parsing. D OMAIN
#W ORDS
C O NLL 2007 Bio Chem
POS
4k 5k
• •
S WITCHBOARD 4 Spoken
162k
•
E NGLISH W EB T REEBANK Answers Emails Newsgrs Reviews Weblogs WSJ
29k 28k 21k 28k 20k 40k
• • • • • •
F OSTER Twitter
3k
•
C O NLL 2003 News
50k
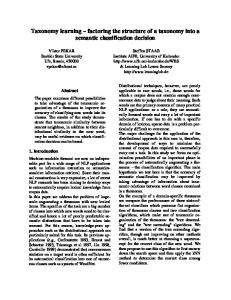
Figure 1: Accuracies of L APOS VS . S TANFORD across 10 data sets.
TASKS Dep. NER
al., 2011; Tjong Kim Sang and De Meulder, 2003, LDC99T42; LDC2012T13). POS tagging. We compare the performance of two state-of-the-art newswire taggers across 10 evaluation data sets (see Table 1), namely the L A POS tagger (Tsuruoka et al., 2011) and the S TAN FORD tagger (Toutanova et al., 2003), both trained on WSJ00–18. We use the publicly available pretrained models from the associated websites.2 Dependency parsing. Here we compare the pre-trained linear SVM MaltParser model for English (Nivre et al., 2007b) to the compositional vector grammar model for the Stanford parser (Socher et al., 2013). For this task, we use the subset of the POS data sets that comes with Stanfordstyle syntactic dependencies (cf. Table 1), excluding the Twitter data set which we found too small to produce reliable results. NER. We use the publicly available runs of the two best systems from the CoNLL 2003 shared task, namely F LORIAN (Florian et al., 2003) and C HIEU -N G (Chieu and Ng, 2003).3
• • • • • •
•
Table 1: Evaluation data.
3
Experiments
Throughout the rest of the paper, we use four running examples: a synthetic toy example and three standard experimental NLP tasks, namely POS tagging, dependency parsing and NER. The toy example is supposed to illustrate the logic behind our reasoning and is not specific to NLP. It shows how likely we are to obtain a low p-value for the difference in means when sampling from exactly the same (Gaussian) distributions. For the NLP setups (2-4), we use off-the-shelf models or available runs, as described next.
3.2 Standard comparisons POS tagging. Figure 1 shows that the L APOS tagger is marginally better than S TANFORD on macro-average, but it is also significantly better? If we use the bootstrap test over tagging accuracies, the difference between the two taggers is only significant (p < 0.05) in 3/10 cases (see Table 2), namely S POKEN, A NSWERS and R EVIEWS. In two of these cases, L APOS is significantly better
3.1 Models and data We use pre-trained models for POS tagging and dependency parsing. For NER, we use the output of the best performing systems from the CoNLL 2003 shared task. In all three NLP setups, we compare the outcome of pairs of systems. The data sets we use for each of the NLP tasks are listed in Table 1 (Nivre et al., 2007a; Foster et
2
http://www.logos.ic.i.u-tokyo.ac.jp/ ˜tsuruoka/lapos/ and http://nlp.stanford. edu/software/tagger.shtml 3 http://www.cnts.ua.ac.be/conll2003/ ner/
3
Bio Chem Spoken Answers Emails Newsgrs Reviews Weblogs WSJ Twitter
TA (b) 0.3445 0.3569