The Visual Computer manuscript No. (will be inserted by the editor)
Oleg Polonsky · Giuseppe Patan´ e · Silvia Biasotti · Craig Gotsman · Michela Spagnuolo
What’s in an Image ? Towards the Computation of the “Best” View of an Object
Abstract There are many possible 2D views of a given 3D object and most people would agree that some views are more aesthetic and/or more “informative” than others. Thus, it would be very useful, in many applications, to be able to automatically compute these “best” views. Although all measures of the quality of a view will ultimately be subjective, hence difficult to quantify, we propose some general principles which may be used to address this challenge. In particular, we describe a number of different ways to measure the goodness of a view, and show how to optimize these measures by reducing the size of the search space. Keywords Visualization · View entropy · Scene composition
1 Introduction The real world consists of three-dimensional objects. The human visual system, however, is limited by optics to view only their two-dimensional images. Stereo vision and perspective only partially overcome this limitation. Thus, a significant component of the geometric information about a 3D object is lost during the viewing transformation. This unfortunate fact is also reflected in traditional computer graphics applications, where we commonly see rendered 2D images. Although all the information about the 3D shape is known a-priori (i.e., before the image rendering), much is lost when the shape is This work is supported by the EU Network of Excellence AIM@SHAPE IST NoE No 506766. O. Polonsky Technion — Israel Institute of Technology E-mail:
[email protected] G. Patan´e, S. Biasotti, M. Spagnuolo IMATI/CNR Genova E-mail: {patane,biasotti,spagnuolo}@ge.imati.cnr.it C. Gotsman Harvard University E-mail:
[email protected]
projected onto the image plane, and the amount of preserved information depends on the eye (camera) position relative to the shape in that particular view. In this paper, we focus on the quantification and measurement of the visual information present in an image of a 3D object with the aim of finding optimal, or nearlyoptimal, views. It should be emphasized that the notion of the goodness of a view may depend on the particular visual task or application. For example, in an illustrated manual of work tools, people may prefer views where the tool is drawn in the typical position, as used by the machine operator. Object recognition tasks performed by a robot may require a totally different view to achieve best performance. Nonetheless, we believe that there exists some common basis for all these visual problems. Answering these questions presents a significant challenge in the field of visualization and shape understanding. A solution would be useful in several applications such as automatic camera positioning in CAD, thumbnail generation for large 3D databases, automatic scene composition, technical illustration, and object recognition. In this paper we propose the following methodology: define a view descriptor which attaches a score to a view of the object, taking into account its visible geometry (Section 3). Then, compute the value of this descriptor for a small number of candidate views (Section 4). We consider the view with the highest score to be the most informative. We describe a number of such descriptors, and show how to optimize them efficiently over the viewing sphere. We compare the views generated by these descriptors and discuss their performance (Section 5 and 6).
2 Previous work The question “What is a good view of an object ? ” dates back to the Greeks and Romans, who proposed some simple rules of thumb, e.g. the golden ratio, the rule of thirds, the rule of fifths, etc [13].
2
In the 1930s, the mathematician Birkhoff [5,6] tried to quantify the notion of an object’s beauty. He defined the beauty B of an object as B = O/C, where O is order and C is complexity. He tested this formula on simple geometric figures, but was unable to provide a general notion of order and complexity. In the computer vision community, good views are presumed to be ones that make an object more readily recognizable by humans. Many automatic object recognition techniques in vision and robotics are based on theories from human visual perception. Currently, there are two main competing theories: Marr [18] and Biederman [4] describe a theory of “recognition-by-components” (or “structural description”), maintaining that human vision represents objects as 3D entities consisting of 3D components, and this representation is viewpoint-independent. The second theory is “multiple-view description” (B¨ ulthoff et al. [8], Koenderink [16]), stating that the object is best represented and processed as a set of 2D images from different viewpoints, connected in a so-called aspect graph. This is a graph defined such that the vertices correspond to equivalence classes of views and edges join one view with another if the two differ by a single visual event. Unfortunately, the complexity of the aspect graph for line drawings containing n lines has been shown to be O(n6 ), which is quite prohibitive. Weinshall and Werman [27] give a theoretical proof of equivalence between view stability and view likelihood for a given aspect and show that this view can be computed from the aspect’s autocorrelation matrix using Principal Components Analysis (PCA) [14]. Tarr and Kriegman [25] have conducted psychophysical experiments investigating the influence of the aspect of an object on the quality of recognition. The experiments reveal that humans are indeed sensitive to certain types of visual events captured by the aspect graphs. One interesting consequence of other psychophysical experiments is that for many models, there exist a small number of views which seem to be preferred by most people. Palmer et al. [21] and Blanz et al. [7] call these views ”canonical views” and show that they often correspond to the classical “three-quarter view” of the object. According to Blanz et al. [7], canonical views are stable, and expose as many salient and significant features as possible. In the field of computer graphics, Gooch et al [13] try to use the results of Blanz et al [7] to perform automatic scene composition, where finding the viewpoint is one of the three stages of the composition process (i.e., image format, viewpoint, and shape layout). They start from the three-quarter view (determined manually) and then optimize it to find the most stable view, where stability means to eliminate coincident silhouette lines. More specifically, they maximize the sum of squared distances between all silhouette midpoints, ignoring silhouette visibility.
Polonsky, Patan´e, Biasotti, Gotsman and Spagnuolo
Probably the first attempt to compute good views in computer graphics was made by Kamada and Kawai [15]. They treat objects drawn in wire-frame in an orthogonal projection. A degenerate projection is one for which an edge is projected to a point, or a polygon is projected to a line. The objective is to minimize such degeneracies, and the optimal viewpoint is called “general position”. The complexity of the analytical solution is O(n3 log n), but this does not take occlusions into account. The work of G´omez et al. [12] is similar in spirit to [15], incorporating perspective projections. Various “niceness” criteria are defined: regularity, simplicity, minimum crossing, and monotonic projections. Barral et al. [2] add coefficients to the formulae of [15] to cope with perspective projection, and introduce other heuristic balance coefficients, but admit that it is difficult to determine optimal weights for the different components. Plemenos and Benayada [22] introduce the term “visible projected area”. They assume that a good view is that which maximizes the number of visible triangles and the visible projected surface area. These two measures are weighted and summed to an objective function and the optimal value is heuristically searched for by hierarchically subdividing the viewing sphere surrounding the scene. This measure does not take into account at all the amount of invisible (occluded) surface area. V´azquez et al. [26] extend the measure of Plemenos and Benayada [22] to operate on a per-face basis. This gives more detailed information on the view. A “probability” is associated with each face, defined as the fraction of its visible projected area relative to the total visible projected area. These probabilities are then combined using the information-theoretic entropy function. The cost function, called viewpoint entropy, is defined to be the entropy of this distribution. Hence, a good view is one for whom the faces are exposed as uniformly as possible. Note, however, that this cost function does not either take into account the behaviour of the occluded surfaces. Additionally, Stoev and Straßer [24] point out that the method of V´azquez et al. generates “flat” views for scenes where all the normals point in similar directions (e.g., digital terrain models). As a result, the good view direction (maximal viewpoint entropy) typically is vertical; so although the number of visible triangles and the projected area are maximized, most of depth information is lost. Their proposed workaround is to add to the cost function another (weighted) term which measures the maximal depth in the frame. In the field of robotics, Arbel and Ferrie [1] and Roberts and Marshall [23] attempt to find good views that simplify object recognition. The approach in [1] is based on a learning process for entropy maps on the viewing sphere, where each entropy value indicates the expected ambiguity of recognition. During the recognition process, these maps are navigated in order to minimize the chance of expected ambiguities. Roberts and Marshall [23] select a
What’s in an Image ?
Fig. 1 Four top-ranking (left to right) views among candidate views according to the surface area entropy descriptor. Black dots indicate a three-quarter view (otherwise it is a normal-clustered view).
minimal number of views that allow adequate representation for every face of the object.
3 View descriptors In this section, we describe a number of ways to measure the goodness of a view of an object. The objective function that measures this is called a view descriptor, and the best view is that which maximizes this function. Our descriptors are based on the following principles. The first principle is to exploit an accepted measure of geometric complexity for a 3D shape. This could be based on various features in the shape, its surface area, its curvature destribution, etc, and is obviously viewindependent. The view descriptor would then assign to a view a score which is the contribution to the complexity from the portion of the shape which is visible in that view (see paragraphs on Surface area entropy, Visibility ratio and Curvature entropy). So, in effect, the best view is that which exposes as much of the geometric complexity of the object as possible. The second principle is to define descriptors which are based on inherently view-dependent features. Examples are object silhouettes and critical points (see paragraphs Silhouette entropy and Topological complexity). Here again we would like to expose as much of these features as possible. A third principle is to build a descriptor which, instead of assigning values to the primitive elements of the 3D model (e.g., vertices, faces, and edges), assigns
3
Fig. 2 Four top-ranking (left to right) views among candidate views according to the visibility ratio descriptor.
values to larger portions of the model which have some semantic meaning. Such portions of the model may be obtained from segmentation algorithms (see paragraph Surface entropy of semantic parts). This affords a higher level visual appreciation of the model.
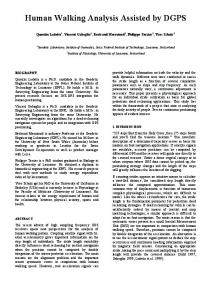
Surface area entropy. The first descriptor that we examined measures geometric complexity of an object as its surface area. Each face is assigned a “probability” — the fraction of its visible projected area relative to the total visible projected area and the descriptor value is the entropy of this distribution. We computed these probabilities at image precision by rendering each face with a distinct colour, and counting the number of pixels of each colour. This is essentially the “viewpoint entropy” method proposed by V´azquez et al. [26]. The ranking of some views by this descriptor are shown in Figure 1. In this figure, and those related to the other descriptors, we restrict our attention to a small number of candidate views generated by a filtering procedure, as described in Section 4.
Visibility ratio. The previous descriptor did not take into account the behavior of the invisible portions of the surface, so it might prefer a view of the object in which most of its surface area is occluded. A descriptor which does take this into account is the ratio between the 3D surface area that is visible in the image, and the total 3D surface area. This seeks to expose as much of the surface area as possible. The ranking of some views by this descriptor are shown in Figure 2.
4
Polonsky, Patan´e, Biasotti, Gotsman and Spagnuolo
Fig. 3 Four top-ranking (left to right) views among candidate views according to the curvature entropy descriptor. Black dots indicate a three-quarter view (otherwise it is a normal-clustered view).
Curvature entropy. Surface area is a very simple measure of shape complexity. A more sophisticated one, as proposed by Page et al [20], is the entropy of the Gaussian curvature distribution over the entire surface of the object. We define the curvature entropy descriptor to be the entropy of the curvature distribution over the visible portion of the surface. The curvature at a vertex v is estimated by the standard angle-deficit approximation, as in [20]: P 2π − i θi P C(v) = 3 i Ai
(1)
where θi and Ai are the apex angles and areas in the one ring of triangles incident on v, respectively. The ranking of some views by this descriptor are shown in Figure 3. The previous descriptors were based on view independent measures of shape complexity. We now define descriptors which are inherently view-dependent. Silhouette length. Silhouettes (sometime called “occluding contours”) seem to provide an accurate and compact depiction of the shape of a 3D model, and, for this reason, are often used in non-photorealistic rendering. Silhouettes are also view-dependent. A simple version of this descriptor measures the total length of all silhouette edges in the image plane. Since this cannot be done reliably in image space, we computed the visible silhouette edges in object space analytically and calculated the length of their projected versions. The ranking of some views by this descriptor are shown in Figure 4.
Fig. 4 Four top-ranking (left to right) views among candidate views according to the silhouette length descriptor. Black dots indicate a three-quarter view (otherwise it is a normalclustered view).
Silhouette entropy. A more sophisticated silhouette-based descriptor uses silhouette entropy instead of total length, where the entropy of a curve is defined as the entropy of its curvature distribution, as proposed by Page et al [20]. In the discrete version, we compute the entropy of all turning angles between adjacent silhouette edges. In some cases, spurious silhouette edge crossings can make the result quite unstable. The ranking of some views by this descriptor are shown in Figure 5. Topological complexity. Another approach was motivated by the fact that the critical points of a 3D surface are highly informative. These may be considered features of the surface. Assuming that the boundary of the object is a smooth closed manifold surface S in R3 , we may use the height function hn along any direction n and compute the number of its critical points (i.e., minima, maxima, and saddles) on S. A classical theorem from differential topology [19] states that the alternate sum of the number of minima, maxima, and saddles is constant, and is related to the Euler characteristic χ of S, namely: maxima − saddles + minima = 2(1 − g) = χ,
(2)
where g is the genus of S. However the total number of critical points (maxima+saddles+minima) depends on the direction n, this quantity could be useful for discriminating among different view directions (when used as n). The direction that maximizes this number seems to be the most informative. The result (2) is valid not only for Morse functions on the surface, but also for C 0 functions, using the extension proposed in [3]. Therefore, it can be applied even if the height function has degenerate critical points. The ranking of some views by this descriptor are shown in Figure 6.
What’s in an Image ?
Fig. 5 Four top-ranking (left to right) views among candidate views according to the silhouette entropy descriptor. Black dots indicate a three-quarter view (otherwise it is a normal-clustered view).
Surface entropy of semantic parts. It is possible to apply the surface area entropy method to geometric elements larger than the primitive elements (e.g. vertices, faces) of a 3D mesh. One way to achieve this is to use semantically important segments of the model. The probability of each segment is defined to be the visible projected area of this segment relative to the visible projected area of the entire model. There exist many mesh segmentation algorithms and the descriptor will depend critically on the segmentation method. In our experiments, we used the method proposed by Dey et al. [9], which seems to be able to identify parts of the model which are semantically meaningful (e.g. nose, ears, neck, etc for a head model). The ranking of some views by this descriptor are shown in Figure 7.
4 Sampling the view space Given a view descriptor measuring the “goodness” of a view as a function of viewing direction, the problem is then to find the global, or even local, maximum of this function over the viewing sphere. Since the search space is a continuum containing an infinite number of points, we have used two different strategies to reduce the search to an exhaustive search on a small but reasonable set of candidate views. In this section, we describe two methods to generate these candidate views. For many inputs, nature dictates an “up” direction, which should be respected in any view, certainly in the best one. So, for example, an animal should not be rendered upside down, rather standing on its feet. Noticing that the best view has a degree of freedom of 2D rotation in the image plane (since this will not change the value of any of the descriptors), it is possible to exploit this de-
5
Fig. 6 Four top-ranking (left to right) views among candidate views according to the topological complexity descriptor. Black dots indicate a three-quarter view (otherwise it is a normal-clustered view).
gree of freedom to cause all views to have the correct 2D orientation after the optimal view has been computed. Three-quarter views. Palmer et al. [21] experimentally observed the existence of what they call “canonical views” of an object. These are views that most humans prefer to look at the object from, and they seem to be quite well defined in practice. Inspired by the structural description theories, Blanz et al. [7] state that these canonical views are typically “three-quarter views” of the objects. Gestalt psychologists explain that this is a view where the front, top, and side of the object are simultaneously visible. This also explains why these views are preferred by humans: we simply prefer to see simultaneously all three dimensions of the shape. In particular, Marr [18] states that the object’s “primary axis of elongation” should be clearly visible. We use three-quarter views as candidate views. We start by approximating the shape by an oriented box, thus establishing a local Cartesian frame defined by the three axes of the box. Three-quarter views then correspond to the vectors whose components are the eight combinations of (±1, ±1, ±1) in this coordinate system. As pointed out by Weinshall and Werman [27], these views are the most stable views of the box approximating the object, thus hopefully a good approximation for stable views of the object itself. To compute an approximating box for the object, we use the three principle directions generated by PCA of the object geometry, relative to the centroid of the point cloud. The PCA method has some nice properties, such as robustness and stability; furthermore, it has been successfully used in computer graphics for object matching and aligning and normalization purposes (e.g., see [10,
6
Polonsky, Patan´e, Biasotti, Gotsman and Spagnuolo
in Section 3, and ranked them in decreasing order (from left to right), as depicted in Figures 1 – 7. The objective was to see whether those views which ranked highest according to some descriptors were indeed those which are most informative to a human observer. The three-quarter view and normal clustering sample the view space by considering the geometry and normals respectively. The main difference between these two methods is the number of candidates generated. This is constant (i.e., eight) for the first method and essentially unbounded for the second method. In practice, we choose the 15 to 30 most significant clusters to emerge from the PCA. Three-quarter views are marked by a black dot in Figures 1 – 7. It seems that all the view descriptors prefer mostly the normal clustered views over the three-quarter views.
6 Conclusions and Discussion Fig. 7 Four top-ranking (left to right) views among candidate views according to the surface entropy of semantic parts descriptor. Black dots indicate a three-quarter view (otherwise it is a normal-clustered view).
11]). Finally, we note that the eight vectors are computed ignoring occlusion, which will be taken into account later by the descriptors. Normal clustering. Another way to compute candidate views of an object is to detect clusters in the set of vertex normals. Again we ignore occlusions. This effectively defines the “sides” of the object to be those directions that a large number of normals point towards. This is motivated by the assumption that the more the normals point in some direction, the more the object’s surface is visible from that direction. More precisely, for each vertex v we approximate its unit normal by averaging the normal vectors of the triangles incident on v; each normal vector defines a point on the unit sphere (i.e., the Gauss map). Then, we cluster the points on the unit sphere using an iterative version of PCA [14], thus achieving a set of clusters. An interesting view is defined as the center of mass of these points (or equivalently, normal vectors) of each cluster. The resulting view directions seem to be quite stable.
5 Experimental Results To compare the performance of the various descriptors, we applied them to a set of 3D objects which seem to be representative. For each object we computed a relatively small number of candidate views based on the two methods described in Section 4 and for each such view, computed the value of the various descriptors described
The problem of finding a good view for an object seems to be quite difficult. It is becoming painfully obvious that there is no panacea. No one descriptor does a perfect job. It is probably possible to improve the descriptors described here and fine-tune them a little more, but we do not believe that this will be significant. However, since each descriptor does a reasonably good job on a majority of inputs, we are confident that it is possible to combine them to amplify the advantage that each has. Possible combinations are linear, where the optimal weights will have to be determined by some learning process, or nonlinear, e.g. by a voting process. Once the descriptors have been decided on, an efficient algorithm must compute the view on the unit sphere which optimizes this measure. At first glance, this seems to be a difficult problem, since there exists a continuum of possible viewpoints. A gradient-descent optimization over the viewing sphere could work, but it would be very slow and not guarantee a global maximum. Hence we reduce the problem to a search over a (possibly large but) finite set of candidate viewpoints but, consequently, we might miss the best view. It would be useful to be able to prove that the particular measure we use can be maximal only at the candidate views. As we have shown, possible candidates are three-quarter views or normals, but it is not obvious that the optimal view must indeed be one of these. A very recent paper by Lee et al. [17] defines the most informative view as that which maximizes the visible saliency of an object. The saliency is defined using a multiscale curvature measure. A gradient-descent algorithm is used to optimize this measure over the viewing sphere. Using a multiscale measure (as opposed to single scale) seems to be useful, and it might be possible to enhance our descriptors to accommodate this type of information as well.
What’s in an Image ?
Acknowledgements We would like to thank our colleagues at the Max-Planck-Institut f¨ ur Informatik (MPII) who contributed to this paper. Thanks also to Tamal Dey for making available his segmentation software for our experiments.
References 1. Arbel, T., Ferrie, F.P.: Viewpoint selection by navigation through entropy maps. In: Proceedings of the International Conference on Computer Vision, vol. I, pp. 248–254 (1999) 2. Barral, P., Dorme, G., Plemenos, D.: Scene understanding techniques using a virtual camera. In: A. de Sousa, J.C. Torres (eds.) Proceedings of Eurographics 2000, vol. 19 (2000) 3. Biasotti, S.: Computational topology methods for shape modelling applications. Ph.D. thesis, Universit´ a degli Studi di Genova (2004) 4. Bierderman, I.: Recognition-by-components: A theory of human image understanding. Psychological Review 94(2), 115–147 (1987) 5. Birkhoff, G.D.: Aesthetic measure. Harvard University Press, Cambridge, Massachusetts (1933) 6. Birkhoff, G.D.: Mathematics of aesthetics. In: J.R. Newman (ed.) The World of Mathematics, vol. 4. Simon and Schuster, N.Y. (1956) 7. Blanz, V., Tarr, M., B¨ ulthoff, H.: What object attributes determine canonical views? Perception 28, 575–599 (1999) 8. B¨ ulthoff, H.H., Edelman, S.Y., Tarr, M.J.: How are threedimensional objects represented in the brain? Cerebral Cortex 5(3), 247–260 (1995) 9. Dey, T.K., Giesen, J., Goswami, S.: Shape segmentation and matching with flow discretization. In: Proceedings of the Workshop on Algorithms and Data Structures, pp. 25–36 (2003) 10. Elad, M., Tal, A., Ar, S.: Directed search in a 3D objects database using SVM. Tech. Rep. HPL-2000-20R1, HP Labs (2000) 11. Elad, M., Tal, A., Ar, S.: Content based retrieval of VRML objects: an iterative and interactive approach. In: Proceedings of the sixth Eurographics workshop on Multimedia, pp. 107–118 (2001) 12. G´ omez, F., Hurtado, F., Sellar`es, J.A., Toussaint, G.T.: Nice perspective projections. Visual Communication and Image Representation. 12, 387–400 (2001) 13. Gooch, B., Reinhard, E., Moulding, C., Shirley, P.: Artistic composition for image creation. In: Proceedings of Eurographics Workshop on Rendering Techniques, pp. 83–88 (2001) 14. Jolliffe, I.: Principal Component Analysis. SpringerVerlag (1986) 15. Kamada, T., Kawai, S.: A simple method for computing general position in displaying three-dimensional objects. Computer Vision, Graphics and Image Processing 41(1), 43–56 (1988) 16. Koenderink, J.J., van Doorn, A.J.: The internal representation of solid shape with respect to vision. Biological Cybernetics 32(4), 211–216 (1979) 17. Lee, C.H., Varshney, A., Jacobs, D.: Mesh saliency. In: Proceedings of ACM SIGGRAPH (2005) 18. Marr, D.: Vision: A computational investigation into the human representation and processing of visual information. W. H. Freeman and Company, NY (1982) 19. Milnor, J.: Morse Theory. Princeton University Press, New Jersey. (1963)
7
20. Page, D.L., Koschan, A., Sukumar, S.R., Roui-Abidi, B., Abidi, M.A.: Shape analysis algorithm based on information theory. In: Proceedings of the IEEE International Conference on Image Processing, vol. I, pp. 229– 232 (2003) 21. Palmer, S.E., Rosch, E., Chase, P.: Canonical perspective and the perception of objects. Attention and Performance IX, 135–151 (1981) 22. Plemenos, D., Benayada, M.: Intelligent display in scene modeling. New techniques to automatically compute good views. In: Proceedings of GraphiCon (1996) 23. Roberts, D.R., Marshall, A.D.: Viewpoint selection for complete surface coverage of three dimensional objects. In: Proceedings of the British Machine Vision Conference, vol. II, pp. 740–750 (1998) 24. Stoev, S.L., Straßer, W.: A case study on automatic camera placement and motion for visualizing historical data. In: Proceedings of IEEE Visualization, pp. 545– 548 (2002) 25. Tarr, M., Kriegman, D.: What defines a view? Vision Research 41(15), 1981–2004 (2001) 26. V´ azquez, P.P., Feixas, M., Sbert, M., Heidrich, W.: Viewpoint selection using viewpoint entropy. In: Proceedings of VMV, pp. 273–280 (2001) 27. Weinshall, D., Werman, M.: On view likelihood and stability. IEEE Transactions on Pattern Analysis and Machine Intelligence 19(2), 97–108 (1997)
Oleg Polonsky received a B.Sc. in Computer Science in 2000 from the Technion — Israel Institute of Technology. Currently he is a graduate student in the same department and a member of the Technion Center for Graphics and Geometric Computing (CGGC). His research interests include 3D computer graphics and visualization.
Giuseppe Patan´ e received a Ph.D. in ”Mathematics and Applications” from the University of Genova (2005) and a Post-Laurea Degree Master in ”Application of Mathematics to Industry” from the ”F. Severi National Institute for Advanced Mathematics” - University of Milano (2000). Currently, he is a Research Fellow in the Shape Modelling Group at IMATI-CNR, Genova, Italy. His research interests include numerical linear algebra, surface approximation, parameterization, and analysis.
8
Polonsky, Patan´e, Biasotti, Gotsman and Spagnuolo
Silvia Biasotti graduated in Mathematics from the University of Genova in 1998. Since then, she has been on the staff of the Shape Modelling Group at IMATI-CNR Genova. She received a Ph.D. in Mathematics and Applications at the University of Genova in May 2004. Her research interests include computational topology, shape abstraction and skeleton representation of polyhedral surfaces.