Jan 1, 2011 - Average over sources of application time reflected maximum biological yield ..... Ecological Agriculture and Sustainable Development: volume.
Pak. J. Bot., 42(6): 4267-4279, 2010.
WHEAT NITROGEN INDICES RESPONSE TO NITROGEN SOURCE AND APPLICATION TIME MOHAMMAD TARIQ JAN1, MOHAMMAD JAMAL KHAN2, AHMAD KHAN1, MOHAMMAD ARIF1, MOHAMMAD SHAFI1 AND FARMANULLAH3 1
Department of Agronomy, 2Department of Soil and Environmental Sciences, 3 Department of Plant Protection, KPK Agricultural University, Peshawar, Pakistan Abstract The unnecessary inputs costs to farmers due to N losses can be optimized by developing a sound fertilizer strategy. The optimization for improved wheat productivity, N re-translocation, utilization and use efficiencies can be achieved through source and timing of N application. Thus, an experiment was carried out at the Research Farm of KPK Agricultural University Peshawar during 2005-06 to test the effects of sources and timing of N application on wheat biological yield and N indices. Nitrogen sources were ammonium (NH4-N) and nitrate (NO3-N) applied @ 100 kg ha-1 at three different stages i.e., at sowing (S1), tillering (S2) and boot stage (S3). Ammonium-N increased wheat biological yield and total N uptake whereas nitrogen utilization efficiency was increased with NO3-N. Split N at sowing, tillering and boot stages had increased the biological yield and apparent N re-translocation, whereas total-N uptake and N harvest index was higher for full application of N at boot stage. Nitrogen application had almost double the N uptake compared to control and increased 27% N retranslocation regardless of sources and application time. It was concluded from the experiment that split application of N had higher wheat productivity and re-translocation, whereas full and delayed N dose increased N harvest index compared to other treatments. Thus, split N application is recommended for improved biological yield, whereas for improved quality of grains the delayed application of N at boot stage is preferable in agro-climatic conditions of Peshawar.
Introduction The efficient utilization of nitrogen (N) helps in reducing the cost of cereal production. Nitrogen use efficiency (NUE) depends on source and timing of N fertilizer and other factors, thus NUE can be managed in cropping system components (Huggins & Pan, 1993) by adjusting a proper production technology for improving NUE. Improving NUE will be a way to produce high yields with low inputs of N (Limon-Ortega et al., 2000). The N application levels, types and times influenced N indices such as N uptake (Iqbal et al., 2005) and its translocations (Kichey et al., 2007). Fertilizers application timing had a significant role in determining uptake of fertilizer and its partitions to soil and plant (Limaux et al. 1999). Uptake, utilization efficiencies of N and its harvest index fell as N fertilizer rates increased, indicating poor N utilization, whereas N physiological efficiency had the opposite response (López-Bellido & López-Bellido 2001). LópezBellido et al., (2003) recorded total uptake of N in the range of 50 to 127 kg N ha-1 while seed N uptake between 34 and 107 kg N ha-1. Generally, the urea and NH4NO3 performed equally in neutral to slightly alkaline soil. Similarly, under warm soil or alkaline soil, urea performs equally to NH4NO3 by reducing N losses through volatilization (Mahler et al., 1994). Timing of N application had a significant role on the N indices and can help in reducing N losses, e.g., Mossedaq & Smith (1994) reported that N losses could be minimized if N application is made before the onset of stem elongation. When N was applied at first node stage, the total N uptake was greater than at planting time (LimonOrtega et al., 2000). Similarly, Tran & Tremblay (2000) reported that early application of N at planting and tillering had lower N fertilizer uptake than later application (shooting)
4268
MOHAMMAD TARIQ JAN ET AL.
in wheat. Split and latter application of N increased NUE through avoiding unnecessary vegetative growth and losses of N (Alcoz et al., 1993). Pan et al., (2006) reported that during grain filling, N remobilization from the leaves, stem and chaff depended on the curvilinear or linear decreases of the N concentrations. Fertilizer recovery was higher when N was applied at anthesis compared to N applied during planting (Wuest & Cassman 1992). Delayed application of N increased the management flexibility by providing the N when soil moisture is low and root uptake is minimum and thus farmer can adjust fertilizer rates for improved N uptake and productivity (Ellen & Spiertz, 1980). Published studies have addressed the optimal N fertilization rates and timing for improved use and uptake efficiencies of N and information regarding sources of N and its combination with time of application is limited in this area. Thus, an experiment was designed to determine the effects of different sources of N fertilizer and its application timings for improved N indices, in addition to biomass productions under agro-climatic conditions of Peshawar. Material and Methods Experimental site: An experiment to determine the effects of sources and timing of application of N on different nitrogen indices was carried out at Agricultural Research Farm of KPK Agricultural University Peshawar during Fall 2005. The experimental site has warm to hot, semi-arid subtropical continental climate with a mean annual rainfall of about 360mm. The soil was silty clay loam, well drained and strongly calcareous, with a pH of 8.2. It was deficient in nitrogen and phosphorous but has adequate potassium. Treatments and materials: The experimental treatments consisted of two types of Nfertilizer (NH4-N & NO3-N) and three-application time i.e., at sowing, tillering and boot stage. Urea was used as mineral-N source for NH4-N and calcium nitrate (CaNO3) for NO3-N @ 100 kg ha-1. Combinations of the treatments, including no fertilizer (control) were replicated four times in a Randomized Complete Block (RCB) design. Details of the experimental treatments are given in Table 1. Table 1. Details of the experimental treatments and their levels. Type of fertilizer-N Application time of fertilizer-N ----------- (% of N dose) $ ---------(S1) (S2) (S3) (S1) (S2) (S3) T1 0 0 0 0 0 0 T2 NH4 0 0 100 0 0 0 0 100 0 0 T3 NO3 0 0 100 0 T4 0 NH4 T5 0 NO3 0 0 100 0 0 0 100 T6 0 0 NH4 0 0 100 T7 0 0 NO3 T8 NH4 NH4 0 50 50 0 0 NH4 50 0 50 T9 NH4 NH4 0 50 50 T10 0 NH4 T11 NO3 NO3 0 50 50 0 0 NO3 50 0 50 T12 NO3 NO3 0 50 50 T13 0 NO3 T14 NH4 NH4 NH4 33 33 33 NO3 NO3 33 33 33 T15 NO3 $ = 100 kg N ha-1, S1 = at sowing, S2 = at tillering, S3 = at boot stage
WHEAT NITROGEN INDICES RESPONSE TO NITROGEN SOURCE
4269
Field operations: Field was thoroughly prepared using a common cultivator at field capacity stage. Sowing was done in October 2005 in a plot size of 5 x 3m having 10 rows with 30cm inter-row distance. A tractor-mounted planter equipped with row cleaner wheels adjusted for 120 kg ha-1 seed rate was used for sowing. Basel dose of phosphorus @ 60 kg ha-1 as single super phosphate (SSP) was used. Uniform agronomic practices for raising a successful crop were followed for all the treatment. The field was irrigated after 21 days when the germination was completed in all plots. The field was then irrigated as and when needed. Observations and measurements: The six central rows were harvested, sun dried and weighed for the determination of biological yield. To determine the various N indices, plants were randomly sampled from a single position of 0.5m length from the rows located at the 3rd row from the edges at pre-awns emergence and maturity stages i.e., at code 49, and 94, respectively (Zadoks et al., 1974). The sampled plants were separated into chaffs and grain at maturity stage whereas no separation was practiced at pre-awns emergence stage. These components were dried for 36 hours in oven at 50°C. The dried samples chaffs and grains (12.7±0.2% moisture content) were ground by tissue grinder and sieved through 0.2mm sieve to get the fine powder for determination of N content. The grounded samples were stored until the completion of analyses following Kjeldahl procedure (Westerman, 1990). The following calculations were made from the analyzed samples. 1.
Total N uptake was recorded by using the formula: Total N uptake = Straw N + Grain N x Biological yield
2. Nitrogen use efficiency is the wheat grain yield (Gw) per unit of N supply (Ns), and was calculated by formula (Gw/ Ns). Nitrogen supply was calculated as N applied as fertilizer plus total nitrogen uptake in control plots (Huggins & Pan, 1993). 3.
Nitrogen utilization efficiency was recorded by the formula (Fiez et al., 1995) Nitrogen utilization efficiency =
Grain yield Total N uptake (plant N)
4. Apparent N re-translocation was determined according to the procedure described by Cox et al., (1986) using the formula: Apparent N re-translocation = N assimilation prior to anthesis – N yield at maturity (chaffs)
5. Nitrogen harvest index was determined according to the procedure described by Cox et al., (1986) by the formula: Nitrogen harvest index =
Grain nitrogen Total N assimilation
x 100
4270
MOHAMMAD TARIQ JAN ET AL.
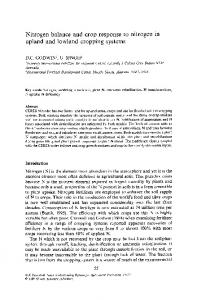
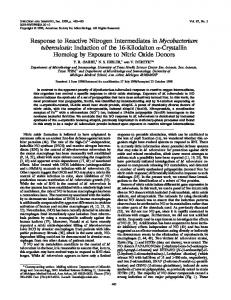
Statistical analysis: The collected data was analyzed according to the procedure relevant to RCB design and the mean were separated using least significance difference (LSD) test. In addition to LSD, planned mean comparisons were also used to achieve the specific objectives of the research (Jan et al., 2009). Results Biological yield: Plots received NH4-N had increased biological yield over NO3-N (Table 2). Generally, the split application increased the biological yield when NO3-N was used, whereas the full dose of NH4-N application improved the biological yield. Average over sources of application time reflected maximum biological yield (7398 kg ha-1) when N was used in split application compared to full dose. Control plots had produced minimum biological yield compared to fertilized plots (Fig. 1). Nitrogen applied as full dose increased the biological yield when applied later than to earlier sole dose application. The overall impact of full and split N application remained the same for biological yield. Similarly, within split N application (two or three split), no significant differences were observed for biological yield. Total N uptake: Uptake of N by wheat from NH4-N source of fertilizer was greater than NO3-N. Split application of N increased the N uptake in NO3-N compared to NH4-N. Average over sources, total N uptake was higher (111 kg ha-1) when full dose of N was used at boot stage compared to other earlier stages (Table 3). Nitrogen fertilization had increased the uptake of N compared to control plots (Fig. 2.). Delayed N application increased N uptake as compared to earlier application of N. Generally differences were noted for N uptakes between full or splits applications of N as well as within number of split applications. Nitrogen use efficiency: Nitrogen use efficiency (NUE) was not affected by sources of N application. Within both sources, split applications of N had improved the NUE. Average over N sources, greater NUE (19.44%) was recorded when N was applied as split dose i.e., half at tillering and other half at boot stage (Table 4). Among planned mean comparisons (Fig. 3.), NUE was higher for control plots compared to fertilized plots. Early or delayed N application as a full dose had no effect on NUE. Nitrogen applied as split had increased the NUE compared to full dose; however, increasing the splitting of N had not affected the NUE. Nitrogen utilization efficiency: Higher utilization efficiency of N (NUtE) was observed when NO3-N was used as source of N compared to the NH4-N source (Table 5). Average over sources, the maximum NUtE (29.31%) was observed when N was applied as split doses of 50 kg N ha-1 at planting time and other half at boot stages of the wheat. Among planned mean comparison, control plots had effectively utilized the N compared to the fertilized plots. Nitrogen applied either earlier or latter, as a full dose of 100 kg N ha-1 had no impact on NUtE (Fig. 4). Generally, the split application of N increased the NUtE compared to full dose application. More specifically, three split doses of N had improved the NUtE over two-split dose of N.
WHEAT NITROGEN INDICES RESPONSE TO NITROGEN SOURCE
4271
Table 2. Biological yield (kg ha-1) of wheat as affected by source and timing of nitrogen application. Fertilizer source Application time Mean -1 (100 kg N ha ) NO3-N NH4-N Full S1 6556 6067 6311 Full S2 7022 6733 6878 Full S3 8111 6400 7256 1/2 S1 + 1/2 S2 7289 6733 7011 1/2 S1 + 1/2 S3 7156 6356 6756 1/2 S2 + 1/2 S3 7511 7267 7389 1/3 S1 + 1/3 S2 + 1/3 S3 7089 7411 7250 Mean 7248 6710 LSD(0.05) for N sources ** LSD(0.05) for N timing 575 Interaction (Sources x Timing) * S1= at sowing, S2= at tillering, S3= at boot stage, *, ** = Significant at 5% and 1% level of probability, respectively.
Table 3. Total nitrogen uptake by wheat (kg ha-1) as affected by source and timing of nitrogen application. Fertilizer source Application time Mean -1 (100 kg N ha ) NO3-N NH4-N Full S1 99 93 96 Full S2 108 104 106 Full S3 126 95 111 1/2 S1 + 1/2 S2 108 101 105 1/2 S1 + 1/2 S3 103 93 98 1/2 S2 + 1/2 S3 112 109 110 1/3 S1 + 1/3 S2 + 1/3 S3 106 114 110 Mean 109 101 LSD(0.05) for N sources ** LSD(0.05) for N timing 9 Interaction (Sources x Timing) ** S1= at sowing, S2= at tillering, S3= at boot stage, ** = Significant at 1% level of probability
Apparent nitrogen re-translocation: Sources of N had not affected the apparent N retranslocation. Higher apparent nitrogen re-translocation was observed for full dose of NH4-N at sowing or splits applications of NO3-N (Table 6). Average over sources, maximum apparent N re-translocation (7.94 g kg-1 DM) was observed when N was used in three equal splits application at sowing, tillering or boot stages. Planned mean comparisons revealed that control had lower apparent N re-translocation than fertilized plots (Fig. 5.). Full dose of N application either earlier or latter had not affected the apparent N re-translocation. Generally, the split application of N had higher apparent N re-translocation than full dose. More specifically, three splits application of N significantly increased the apparent N re-translocation over two splits.
MOHAMMAD TARIQ JAN ET AL. a
Two split dose
a
a
a
a
N split dose
4272 a
7000
6000
C1
C2
C3
Three split dose
Rest
2000
N Full dose
3000
Full late application
b
4000
Full early application
5000
Contol
Biological yield (kg ha-1)
b
C4
Planned mean comparisons (C)
Fig. 1. Planned mean comparisons for biological yield (kg ha-1) as affected by sources and timing of N. Bars having similar letter within each comparison are not significant. a
a
a
b
100
0
C1
C2
C3
Three split dose
20
Rest
40
N Full dose
b
Full late application
60
Full early application
80
Contol
Total nitrogen uptake (kg ha-1)
a
Two split dose
a
a
N split dose
120
C4
Planned mean comparisons (C)
Fig. 2. Planned mean comparisons for wheat total nitrogen uptake (kg ha-1) as affected by sources and timing of N. Bars having similar letter within each comparison are not significant.
Nitrogen harvest index: Nitrogen harvest index (NHI) was not affected by using NH4-N or NO3-N source (Table 7). Averaged over sources, NHI was higher (80.47%) when full dose of N was applied at boot stage compared to other treatments. Planned mean comparison (Fig. 6.) revealed that control had higher NHI than fertilized plots. Full dose (100 kg N ha-1) application of N at either tillering or boot stages achieved higher NHI than at sowing. No differences for NHI were observed when N was applied as full dose or in split doses.
WHEAT NITROGEN INDICES RESPONSE TO NITROGEN SOURCE
4273
Table 4. Nitrogen use efficiency (%) of wheat as affected by source and timing of nitrogen application. Fertilizer source Application time Mean -1 (100 kg N ha ) NH4-N NO3-N Full S1 18.56 17.57 18.06 Full S2 17.63 17.16 17.39 Full S3 17.16 17.82 17.49 1/2 S1 + 1/2 S2 18.63 19.94 19.28 1/2 S1 + 1/2 S3 19.36 18.20 18.78 1/2 S2 + 1/2 S3 19.75 19.14 19.44 1/3 S1 + 1/3 S2 + 1/3 S3 18.21 18.21 18.21 Mean 18.47 18.29 LSD(0.05) for N sources NS LSD(0.05) for N timing 1.38 Interaction (Sources x Timing) NS S1= at sowing, S2= at tillering, S3= at boot stage, NS= not significant
Table 5. Nitrogen utilization efficiency (%) of wheat as affected by source and timing of nitrogen application. Fertilizer source Application time Mean -1 (100 kg N ha ) NO3-N NH4-N Full S1 28.84 28.95 28.90 Full S2 24.96 25.66 25.31 Full S3 20.82 28.57 24.70 1/2 S1 + 1/2 S2 26.42 30.22 28.32 1/2 S1 + 1/2 S3 28.50 30.12 29.31 1/2 S2 + 1/2 S3 27.44 26.78 27.11 1/3 S1 + 1/3 S2 + 1/3 S3 26.24 24.63 25.44 Mean 26.17 27.85 LSD(0.05) for N sources * LSD(0.05) for N timing 3.04 Interaction (Sources x Timing) NS S1= at sowing, S2= at tillering, S3= at boot stage, NS= not significant, * = Significant at 5% level of probability
Discussion In the present study, the improved biomass with NH4-N might be the consequences of larger available N (Malhi et al., 2006) or minimum N leaching (Habtegebrial et al., 2007) compared to NO3-N. These results are in line with Brejda et al., (1995), who obtained greater wheat productivity from ammonium source of N than others. The increase in biomass with N application might be due to individual performance of the crop (Kibe et al., 2006), or might be due to efficient photosynthetic activity (LopezBellido et al., 1998). Our results are in line with the findings of Shafiq et al., (1994) and Geleto et al., (1995) who reported that fertilizer application increased wheat productivity over control. Split applications of N might have decreased the losses of N and better synchronization with plant demand resulting in increased in wheat biomass.
MOHAMMAD TARIQ JAN ET AL.
4274 a
C1
C2
a
C3
Three split dose
a
a
Two split dose
0
Rest
10
b
N split dose
20
a
N Full dose
b
a
Full late application
30
Full early application
40
Contol
Nitrogen use efficiency (%)
50
C4
Planned mean comparisons (C)
Fig. 3. Planned mean comparisons for nitrogen use efficiencies (%) in wheat as affected by sources and timing of N. Bars having similar letter within each comparison (C) are not significant. a
40
C1
C2
C3
a
Three split dose
b
Two split dose
N split dose
b
N Full dose
0
a
a Full late application
10
Rest
20
a Full early application
b
30
Contol
Nitrogen utilization efficiency (%)
50
C4
Planned mean comparisons (C)
Fig. 4. Planned mean comparisons for nitrogen utilizations efficiencies (%) in wheat as affected by sources and timing of N. Bars having similar letter within each comparison are not significant.
Application of N had increased the uptake of N (Dhillon et al., 1998), which might be attributed to higher N availability (Parmar & Sharma, 2001) for the crop. Split application of N had increased the availability of N for crop and thus more uptake was recorded from plots where N was applied in split application. Delayed application of N might have reduced the potential N losses from leaching or denitrification over winter (Ellen & Spiertz, 1980) and thus might have increased the N uptake. Our results are in agreement with findings of Mercedes et al., (1993) who reported that split fertilizer N application improved N uptake in wheat.
WHEAT NITROGEN INDICES RESPONSE TO NITROGEN SOURCE
4275
Table 6. Apparent nitrogen re-translocation (g kg-1 DM) of wheat as affected by source and timing of nitrogen application. Fertilizer source Application time Mean -1 (100 kg N ha ) NO3-N NH4-N Full S1 7.77 6.53 7.15 Full S2 7.17 6.73 6.95 Full S3 7.27 6.42 6.85 1/2 S1 + 1/2 S2 6.57 7.04 6.80 1/2 S1 + 1/2 S3 7.24 7.63 7.44 1/2 S2 + 1/2 S3 6.25 8.06 7.15 1/3 S1 + 1/3 S2 + 1/3 S3 7.68 8.20 7.94 7.14 7.23 Mean LSD(0.05) for N sources NS LSD(0.05) for N timing 0.47 Interaction (Sources x Timing) ** S1= at sowing, S2= at tillering, S3= at boot stage, NS= not significant, ** = Significant at 1% level of probability
Table 7. Nitrogen harvest index (%) of wheat as affected by source and timing of nitrogen application. Fertilizer source Application time Mean -1 (100 kg N ha ) NH4-N NO3-N Full S1 79.29 78.52 78.90 Full S2 79.13 80.05 79.59 Full S3 80.51 80.44 80.47 1/2 S1 + 1/2 S2 80.44 79.68 80.06 1/2 S1 + 1/2 S3 78.86 78.90 78.88 1/2 S2 + 1/2 S3 78.78 79.77 79.28 1/3 S1 + 1/3 S2 + 1/3 S3 78.92 79.13 79.02 Mean 79.42 79.50 LSD(0.05) for N sources NS LSD(0.05) for N timing 0.80 Interaction (Sources x Timing) NS S1= at sowing, S2= at tillering, S3= at boot stage, NS= not significant
Control plots had efficiently utilized the available inherent N and thereby increased the NUE compared to fertilized plots. The full dose of N had resulted in less NUE than split applications, this might be attributed to the greater N losses as previously reported by many researchers. For example, Wuest & Cassman (1992) reported that pre-plant N applications might lead to losses or immobilization before uptakes by plant, thus greatly affecting NUE. Similarly, Rozas et al., (2004) reported that the NUE was greater when N was applied at 6 leaf stages than when N was applied at planting time. The other possible explanation for improved NUE due to split N application might be the consequences of lower N losses through denitrification or leaching (Jokela & Randall, 1997) or lower N immobilization in organic forms (Wells & Bitzer., 1984) and greater plant N uptake due availability of N at the time of need.
MOHAMMAD TARIQ JAN ET AL.
4276
b
N Full dose
C1
C2
b
Three split dose
Two split dose
N split dose
0
a
a
b
4
2
a
Full late application
a
Full early application
6
a
Rest
8
Contol
Apparent nitrogen re-translocation (g kg-1 DM)
10
C3
C4
Planned mean comparisons (C)
Fig. 5. Planned mean comparisons for Apparent nitrogen re-translocation (g kg-1 DM) in wheat as affected by sources and timing of N. Bars having similar letter within each comparison are not significant.
a
a
a
Two split dose
Full early application
a
N Full dose
b
Full late application
b
Rest
80
a
70
65
60
C1
C2
C3
Three split dose
75
Contol
Nitrogen harvest index (%)
a
N split dose
85
C4
Planned mean comparisons (C)
Fig. 6. Planned mean comparisons for Nitrogen harvest index (%) in wheat as affected by sources and timing of N. Bars having similar letter within each comparison are not significant.
Nitrogen fertilization had decreased the NUtE compared to control. Fertilization timings affect the NUtE by cereals (Ragheb et al., 1993), which might be the results of available N at the maximum plant demand (Bigiriego et al., 1979) or minimum N losses (Jokela & Randall, 1997). Split application of N had improved the photosynthetic capacity of the canopy (Frederick & Camberato, 1995) and thereby improved the NUtE compared to full dose of N. Our results are line with the findings of Rozas et al., (2004)
WHEAT NITROGEN INDICES RESPONSE TO NITROGEN SOURCE
4277
who reported greater utilization of N with split application of N compared to full dose. The other possible explanations for improved NUtE due to split application might be the greater individual performance of the crop during early period (Khan et al., 2009) and/or efficiently utilizations of N when it was available at later stage of plant growth (Jung et al., 1972; Rozas et al., 2004). Early N content in vegetative parts was higher in fertilized plots compared to control (Halvorson et al., 2000). The translocation of N to grain after grains filling (Cox et al., 1986) was not comparable to control plots and thus might have decreased the apparent N re-translocation (Gooding et al., 2007). Our results are supported by the findings of Kumar & Puri (2001). The continuous leaf activity plays a significant role in N assimilation that might be associated with re-translocation occurs through a process of protein degradation and remobilization of amino acids (Woodruff, 1972). The greater retranslocation of N from vegetative to reproductive parts due to split N applications might be due to greater source sink competitions (Lopez-Bellido et al., 2001) compared to control. In the same way, Vanderlip (1993) reported that N uptake in sorghum occur rapidly up to 35 days of emergence and thereafter re-translocation of N may occur. Control had higher NHI than fertilized plots, which might be associated with lesser uptake of N in control plots. Application of full dose at later stage had increased the mineral N availability or N uptake at physiological maturity and a proportional increase in grain yield to the plant and thereby increased NHI (Rozas et al., 1999) compared to early application of N. The higher grain yield be obtained when N is applied at six leaf stages due to lesser gaseous N losses or NO3 leaching (Rozas et al., 1999) and thereby increased the N content in grain and hence NHI. In the same way, Benziger et al., (1982) reported greater photosynthetic accumulation in wheat by late N application. Conclusions and Recommendations Ammonium N had increased the biological yield compared to NO3-N, but has no effects on N indices. Increased N had increased the biological yield and total N uptake, whereas NUE, NUtE and NHI were decreased. Split application of N had increased the wheat productivity and N indices. Thus, for improved wheat productivity and efficient N utilization and uptakes the splits application of N at later stage of the crop should be practiced in agro-climatic conditions of Peshawar. Acknowledgement Funds for the research were provided by Pakistan Agricultural Research Council under ALP project. References Alcoz, M.M., F.M. Hons and V.A. Haby. 1993. Nitrogen fertilization timing effect on wheat production, nitrogen uptake efficiency and residual soil nitrogen. Agron. J., 85: 1198-1203. Banziger, M., B. Feil and P. Stamp. 1982. Competition between nitrogen accumulation and grain growth for carbohydrates during grain filling of wheat. Crop Sci., 34: 440-446. Bigiriego, M., R.D. Hauck and R.A. Olson. 1979. Uptake, trans-location and utilization of N– depleted fertilizer in irrigated corn. Soil Sci. Soc. Am. J. 43: 528-533. Brejda, J.J., J.R. Brown and C.L. Hocnshell. 1995. India grass and caucasian blucstem responses to different nitrogen sources and rates in the Ozarks. J. Range Manag. 48: 172-180.
4278
MOHAMMAD TARIQ JAN ET AL.
Cox, M.C., C.O. Qualset and D.W. Rains. 1986. Genetic variation for nitrogen assimilation and translocation in wheat. III. Nitrogen translocation in relation to grain yield and protein. Crop Sci. J., 26: 737-740. Dhillon, N.S., B.S. Brar, G.S. Dhaliwal, R. Arora, N.S. Randhawa and A.K. Dhawan. 1998. Integrated management of farmyard manure and inorganic fertilizers in rice-wheat cropping system in North Western India. Ecological Agriculture and Sustainable Development: volume 1. P.604-612. Proceedings of Intern. Conf. Ecol. Agric: Towards Sust. Dev., 15-17 November 1997. Chandigarh, India. Ellen, J. and J.H.J. Spiertz. 1980. Effects of rate and timing of nitrogen dressings on grain yield formation of winter wheat (T. aestivum L.). Fert. Res. 1: 177-190. Fiez, T.E., W.L. Pan, B.C. Miller. 1995. Nitrogen use efficiency of winter wheat among landscape positions. Soil Sci. Soc. Am. J., 59: 1666-1671. Fischer, R.A. 1993. Irrigated spring wheat, timing, and amount of nitrogen fertilizer. II. Physiology of grain yield response. Field Crops Res., 33: 57-80. Geleto, T., D.G. Tanner, T. Mamo and G. Gebeyehu. 1995. Response of rainfed bread and Durum wheat to source, level, and timing of nitrogen fertilizer on two Ethiopian vertisols. 1. yield and yield components. Commun. Soil Sci. and Pl. Anal. 26(11-12): 1773-1794. Gooding, M.J., P.J. Gregory, K.E. Ford and R.E. Ruske. 2007. Recovery of nitrogen from different sources following applications to winter wheat at and after anthesis. Field Crop Res., 100: 143-154. Habtegebrial, K., B.R. Singh and M. Haile. 2007. Impact of tillage and nitrogen fertilization on yield, nitrogen use efficiency of tef (Eragrostis tef (Zucc.) Trotter) and soil properties. Soil and Tillage Res., 94: 55-63. Halvorson, A.D., A.L. Black, J.M. Krupinsky, S.D. Merril, B.J. Wienhold and D.L. Tanaka. 2000. Spring wheat response to tillage system and nitrogen fertilization within a crop–fallow system. Agron. J., 92: 288-294. Huggins D.R. and W.L. Pan. 1993. Nitrogen use efficiency component analysis: An evaluation of cropping system differences in productivity. Agron. J., 85: 898-905. Iqbal, M.M., J. Akhter, W. Mohammad, S.M. Shah, H. Nawaz and K. Mahmood. 2005. Effect of tillage and fertilizer levels on wheat yield, nitrogen uptake and their correlation with carbon isotope discrimination under rainfed conditions in north-west Pakistan. Soil and Tillage Res., 80: 47-57. Jan, M.T., P. Shah, P.A. Hoolinton, M.J. Khan and Q. Sohail. 2009. Agriculture Research: Design and Analysis. Deptt. of Agronomy, KPK Agric. Uni. Peshawar, Pakistan. Jokela, W.E. and G.W. Randall. 1997. Fate of fertilizer nitrogen as affected by time and rate of application on corn. Soil Sci. Soc. Am. J., 61: 1695-1703. Jung, Jr., I.A. Perterson and I.E. Schrader. 1972. Response of irrigated corn to time, rate and source of applied N on sand soils. Agron. J., 64: 668-670. Khan, A., M.T. Jan, K.B. Marwat and M. Arif. 2009. Organic and inorganic nitrogen treatments effects of plant and yield attributes of maize in a different tillage system. Pak. J. Bot., 41: 99108. Kibe, A.M., S. Singh and N. Kalra. 2006. Water–nitrogen relationships for wheat growth and productivity in late sown conditions. Agric. Water Manage, 84: 221-228. Kichey, T., B. Hirel, E. Heumez, F. Dubois and J. Le-Gouis. 2007. In winter wheat, post-anthesis nitrogen uptake and remobilization to the grain correlates with agronomic traits and nitrogen physiological markers. Field Crop Res., 102: 22-32. Kumar, P. and U.K. Puri. 2001. Effect of nitrogen and farmyard manure application on maize varieties. Ind. J. Agron., 46: 255-259. Limaux, F., S. Recous, J.M. Meynard and A. Guckert. 1999. Relationship between rate of crop growth at date of fertiliser N application and fate of fertiliser N applied to winter wheat. Plant Soil, 214: 49-59. Limon-Ortega, A., K.D. Sayre and C.A. Francis. 2000. Wheat nitrogen use efficiency in a bed planting system in northwest Mexico. Agron. J., 92: 303-308.
WHEAT NITROGEN INDICES RESPONSE TO NITROGEN SOURCE
4279
López-Bellido, L., M. Fuentes, J.E. Castillo and F.J. López-Garrido. 1998. Effects of tillage, crop rotation and nitrogen fertilization on wheat-grain quality grown under rainfed Mediterranean conditions. Field Crop Res., 57: 265-276. López-Bellido, L., R.J. López-Bellido, J.E. Castillo and F.J. López-Bellido. 2001. Effects of longterm tillage, crop rotation and nitrogen fertilization on bread-making quality of hard red spring wheat. Field Crop Res., 72: 197-210. López-Bellido, R.J. and L. López-Bellido. 2001. Efficiency of nitrogen in wheat under Mediterranean conditions: effect of tillage, crop rotation and N fertilization. Field Crop Res., 71: 31-46. López-Bellido, R.J., L. López-Bellido, J.E. Castillo and F.J. López-Bellido. 2003. Nitrogen uptake by sunflower as affected by tillage and soil residual nitrogen in a wheat–sunflower rotation under rainfed Mediterranean conditions. Soil and Tillage Res., 72: 43-51. Mahler, R.L., F.E. Koehler and L.K. Lutcher. 1994. Nitrogen source, timing of application, and placement: Effects on winter wheat production. Agron. J., 86: 637-642. Malhi, S.S., R. Lemke, Z.H. Wang and B.S. Chhabra. 2006. Tillage, nitrogen and crop residue effects on crop yield, nutrient uptake, soil quality, and greenhouse gas emissions. Soil and Tillage Res., 90: 171-183. Mercedes M.A., M.H. Frank and A.H. Vincent. 1993. Nitrogen fertilization timing effect on wheat production, nitrogen uptake efficiency, and residual soil nitrogen. Agron. J., 85(11-12): 11981203. Mossedaq, F. and D.H. Smith. 1994. Timing nitrogen application to enhance spring wheat yields in Mediterranean climates. Agron. J., 86: 221-226. Pan, J., Y. Zhu, D. Jiang, T. Dai, Y. Li and W. Cao. 2006. Modeling plant nitrogen uptake and grain nitrogen accumulation in wheat. Field Crop Res., 97: 322-336. Parmar, D.K. and V. Sharma. 2001. Nitrogen requirement of single hybrid maize (Zea mays) wheat (Triticum aestivum) system under rainfed conditions. Ind. J. Agric. Sci., 71(4): 252-254. Ragheb, H.M., R.A. Dawood and K.A. Kheiralla. 1993. Nitrogen uptake and utilization by wheat cultivars grown under saline stress. Aust. J. Agric. Sci., 24: 97-117. Rozas, S., H.E. Echeverria and G.A. Studdert. 1999. No-tillage maize nitrogen uptake and yield: Effect of urease inhibitor and application time. Agron. J., 91: 950-955. Rozas, S., H.E. Echeverria and P.A. Barbieri. 2004. Nitrogen balance as affected by application time and nitrogen fertilizer rate in irrigation No-tillage Maize. Agron. J., 92: 1622-1631. Shafiq, M., A. Hassan, N. Ahmad and A. Rashid. 1994. Crop yields and nutrient uptake by rainfed wheat and mungbean as affected by tillage, fertilization, and weeding. J. Pl. Nutr., 17(4): 561-577. Tran, T.S. and G. Tremblay. 2000. Recovery of N-15-labeled fertilizer by spring bread wheat at different N rates and application times. Can. J. Soil Sci., 80: 533-539. Vanderlip, R.L. 1993. How a sorghum plant develops. Coop. Ext. Serv. Contrib. 1203, Kansas Agric. Exp. Stn., Manhattan, KS. Wells, K.L., W.O. Thoms and H.B. Rice. 1992. Response of no-till corn to nitrogen source, rate, and time of application. J. Prod. Agric., 5: 607-610. Westerman, R.L. 1990. Soil testing and plant analysis. P. 534-587. In: (Eds.): D.R. Keeney and K.A. Smith. 3rd ed. SSSA, Madison, WI. Wuest, S.B. and K.G. Cassman. 1992. Fertilizer-nitrogen use efficiency of irrigated wheat: I. Uptake efficiency of preplant versus late-season application. Agron. J., 84: 682-688. Zadoks, J.C., T.T. Chang and C.F. Konzak. 1974. A decimal code for the growth stages of cereals. Weed Res., 14: 415-421.
(Received for publication 22 May 2009)