various forms of technical debt occur in software projects. [12]. .... adoption of good Object-Oriented coding practices
When and Why Your Code Starts to Smell Bad Michele Tufano∗ , Fabio Palomba† , Gabriele Bavota‡ , Rocco Oliveto§ , Massimiliano Di Penta¶ , Andrea De Lucia† , Denys Poshyvanyk∗ ∗ The
College of William and Mary, Williamsburg, VA, USA - † University of Salerno, Fisciano (SA), Italy ‡ Free University of Bozen-Bolzano, Italy - § University of Molise, Pesche (IS), Italy ¶ University of Sannio, Benevento, Italy
Abstract—In past and recent years, the issues related to managing technical debt received significant attention by researchers from both industry and academia. There are several factors that contribute to technical debt. One of these is represented by code bad smells, i.e., symptoms of poor design and implementation choices. While the repercussions of smells on code quality have been empirically assessed, there is still only anecdotal evidence on when and why bad smells are introduced. To fill this gap, we conducted a large empirical study over the change history of 200 open source projects from different software ecosystems and investigated when bad smells are introduced by developers, and the circumstances and reasons behind their introduction. Our study required the development of a strategy to identify smellintroducing commits, the mining of over 0.5M commits, and the manual analysis of 9,164 of them (i.e., those identified as smellintroducing). Our findings mostly contradict common wisdom stating that smells are being introduced during evolutionary tasks. In the light of our results, we also call for the need to develop a new generation of recommendation systems aimed at properly planning smell refactoring activities.
I. I NTRODUCTION Technical debt is a metaphor introduced by Cunningham to indicate “not quite right code which we postpone making it right” [18]. The metaphor explains well the trade-offs between delivering the most appropriate but still immature product, in the shortest time possible [12], [18], [27], [31], [42]. While the repercussions of “technical debt” on software quality have been empirically proven, there is still noticeable lack of empirical evidence related to how, when, and why various forms of technical debt occur in software projects [12]. This represents an obstacle for an effective and efficient management of technical debt. Bad code smells (shortly “code smells” or “smells”), i.e., symptoms of poor design and implementation choices [20], represent one important factor contributing to technical debt, and possibly affecting the maintainability of a software system [27]. In the past and, most notably, in recent years, several studies investigated the relevance that code smells have for developers [37], [50], the extent to which code smells tend to remain in a software system for long periods of time [3], [15], [32], [40], as well as the side effects of code smells, such as increase in change- and fault-proneness [25], [26] or decrease of software understandability [1] and maintainability [43], [49], [48]. The research community has been also actively developing approaches and tools for detecting smells [11], [34], [36], [44], [33], and, whenever possible, triggering refactoring operations. Such tools rely on different types of analysis techniques, such as constraint-based reasoning over
metric values [33], [34], static code analysis [44], or analysis of software changes [36]. While these tools provide relatively accurate and complete identification of a wide variety of smells, most of them work by “taking a snapshot” of the system or by looking at recent changes, hence providing a snapshot-based recommendation to the developer. Hence, they do not consider the circumstances that could have caused the smell introduction. In order to better support developers in planning actions to improve design and source code quality, it is imperative to have a contextualized understanding of the circumstances under which particular smells occur. However, to the best of our knowledge, there is no comprehensive empirical investigation into when and why code smells are introduced in software projects. Common wisdom suggests that urgent maintenance activities and pressure to deliver features while prioritizing time-to-market over code quality are often the causes of such smells. Generally speaking, software evolution has always been considered as one of the reasons behind “software aging” [38] or “increasing complexity” [28][35][47]. Broadly speaking, smells can also manifest themselves not only in the source code but also in software lexicons [29], [4], and can even affect other types of artifacts, such as spreadsheets [22], [23] or test cases [9]. In this paper we fill the void in terms of our understanding of code smells, reporting the results of a large-scale empirical study conducted on the evolution history of 200 open source projects belonging to three software ecosystems, namely Android, Apache and Eclipse. The study aimed at investigating (i) when smells are introduced in software projects, and (ii) why they are introduced, i.e., under what circumstances smell introductions occur and who are the developers responsible for introducing smells. To address these research questions, we developed a metric-based methodology for analyzing the evolution of code entities in change histories of software projects to determine when code smells start manifesting themselves and whether this happens suddenly (i.e., because of a pressure to quickly introduce a change), or gradually (i.e., because of medium-to-long range design decisions). We mined over 0.5M commits and we manually analyzed 9,164 of those that were classified as smell-introducing. We are unaware of any published technical debt, in general, and code smell study, in particular, of comparable size. The results achieved allowed us to report quantitative and qualitative evidence on when and * Michele Tufano and Denys Poshyvanyk from W&M were partially supported via NSF CCF-1253837 and CCF-1218129 grants. † Fabio Palomba is partially funded by the University of Molise.
TABLE I C HARACTERISTICS OF ECOSYSTEMS UNDER ANALYSIS . Ecosystem Apache Android Eclipse Overall
#Proj.
#Classes
KLOC
#Commits
#Issues
100 70 30 200
4-5,052 5-4,980 142-16,700 -
1-1,031 3-1,140 26-2,610 -
207,997 107,555 264,119 579,671
3,486 1,193 124 4,803
Mean Story Length 6 3 10 6
Min-Max Story Length 1-15 1-6 1-13 1-15
why smells are introduced in projects as well as implications of these results, often contradicting common wisdom. II. S TUDY D ESIGN The goal of the study is to analyze change history of software projects, with the purpose of investigating when code smells are introduced by developers, and the circumstances and reasons behind smell appearances. More specifically, the study aims at addressing the following two research questions: • RQ1 : When are code smells introduced? This research question aims at investigating to what extent the common wisdom suggesting that “code smells are introduced as a consequence of continuous maintenance and evolution activities” [20] applies. Specifically, we study “when” code smells are introduced in software systems, to understand whether smells are introduced as soon as a code entity is created, whether smells are suddenly introduced in the context of specific maintenance activities, or whether, instead, smells appear “gradually” during software evolution. To this aim, we investigated the presence of possible trends in the history of code artifacts that characterize the introduction of specific types of smells. • RQ2 : Why are code smells introduced? The second research question aims at empirically investigating under which circumstances developers are more prone to introducing code smells. We focus on factors that are indicated as possible causes for code smell introduction in the existing literature [20]: the commit goal (e.g., is the developer implementing a new feature or fixing a bug?), the project status (e.g., is the change performed in proximity to a major release deadline?), and the developer status (e.g., a newcomer or a senior project member?). A. Context Selection The context of the study consists of the change history of 200 projects belonging to three software ecosystems, namely Android, Apache, and Eclipse. Table I reports for each of them (i) the number of projects analyzed, (ii) size ranges in terms of the number of classes and KLOC, (iii) the overall number of commits and issues analyzed, and (iv) the average, minimum, and maximum length of the projects’ story (in years) analyzed in each ecosystem. All the analyzed projects are hosted in Git repositories and have associated issue trackers. The Android ecosystem contains a random selection of 70 open source apps mined from the f-droid1 forge. The Apache ecosystem consists of 100 Java projects randomly selected among those available2 . Finally, the Eclipse ecosystem consists of 30 projects randomly mined from the list of GitHub repositories managed by the
Eclipse Foundation3 . The choice of the ecosystems to analyze is not random, but rather driven by the motivation to consider projects having (i) different sizes, e.g., Android apps are by their nature smaller than projects in Apache’s and Eclipse’s ecosystems, (ii) different architectures, e.g., we have Android mobile apps, Apache libraries, and plug-in based architectures in Eclipse projects, and (iii) different development bases, e.g., Android apps are often developed by small teams whereas several Apache projects are carried out by dozens of developers [7]. Also, we limited our study to 200 projects since, as it will be shown later, the analysis we carried out is not only computationally expensive, but also requires manual analysis of thousands of data points. To sum up, we mined 579,671 commits and 4,803 issues. We focus our study on the following types of smells: 1) Blob Class: a large class with different responsibilities that monopolizes most of the system’s processing [13]; 2) Class Data Should be Private: a class exposing its attributes, violating the information hiding principle [20]; 3) Complex Class: a class having a high cyclomatic complexity [13]; 4) Functional Decomposition: a class where inheritance and polymorphism are poorly used, declaring many private fields and implementing few methods [13]; 5) Spaghetti Code: a class without structure that declares long methods without parameters [13]. While several other smells exist in literature [13], [20], we need to limit our analysis to a subset due to computational constraints. However, we carefully keep a mix of smells related to complex/large code components (e.g., Blob Class, Complex Class) as well as smells related to the lack of adoption of good Object-Oriented coding practices (e.g., Class Data Should be Private, Functional Decomposition). Thus, the smells considered are representative of the categories of smells investigated in previous studies (see Section V). B. Data Extraction and Analysis This subsection describes the data extraction and analysis process that we followed to answer our research questions. 1) When are code smells introduced?: To answer RQ1 we firstly clone the 200 Git repositories. Then, we analyze each repository ri using a tool that we developed (named as HistoryMiner), with the purpose of identifying smellintroducing commits. Our tool mines the entire change history of ri , checks out each commit in chronological order, and runs an implementation of the DECOR smell detector based on the original rules defined by Moha et al. [34]. DECOR identifies smells using detection rules based on the values of internal quality metrics4 . The choice of using DECOR is driven by the fact that (i) it is a state-of-the-art smell detector having a high accuracy in detecting smells [34]; and (ii) it applies simple detection rules that allow it to be very efficient. Note that we 3 https://github.com/eclipse
1 https://f-droid.org/ 2 https://projects.apache.org/indexes/quick.html
4 An example of detection rule exploited to identify Blob classes can be found at http://tinyurl.com/paf9gp6.
TABLE II Q UALITY METRICS MEASURED IN THE CONTEXT OF RQ1 . Metric Description Lines of Code (LOC) The number of lines of code excluding white spaces and comments Weighted Methods per Class (WMC) [16] The complexity of a class as the sum of the McCabe’s cyclomatic complexity of its methods Response for a Class (RFC) [16] The number of distinct methods and constructors invoked by a class Coupling Between Object (CBO) [16] The number of classes to which a class is coupled Lack of COhesion of Methods (LCOM) [16] The higher the pairs of methods in a class sharing at least a field, the higher its cohesion Number of Attributes (NOA) The number of attributes in a class Number of Methods (NOM) The number of methods in a class
ran DECOR on all source code files contained in ri only for the first commit of ri . In the subsequent commits DECOR has been executed only on code files added or modified in each specific commit to save computational time. As an output, our tool produces, for each source code file fj ∈ ri the list of commits in which fj has been involved, specifying if fj has been added, deleted, or modified and if fj was affected, in that specific commit, by one of the five considered smells. Starting from the data generated by the HistoryMiner we compute, for each type of smell (smellk ) and for each source code file (fj ), the number of commits performed on fj since the first commit involving fj and adding the file to the repository, up to the commit in which DECOR detects that fj as affected by smellk . Clearly, such numbers are only computed for files identified as affected by the specific smellk . When analyzing the number of commits needed for a smell to affect a code component, we can fall into two possible scenarios. In the first scenario (the least expected according to the “software aging” theory [38]) smell instances are introduced during the creation of source code artifacts, i.e., in the first commit involving a source code file. In the second scenario, smell instances are introduced after several commits and, thus as result of multiple maintenance activities. For the latter scenario, besides running the DECOR smell detector for the project snapshot related to each commit, the HistoryMiner also computes, for each snapshot and for each source code artifact, a set of quality metrics (see Table II). As done for DECOR, quality metrics are computed for all code artifacts only during the first commit, and updated at each subsequent commit for added and modified files. The purpose of this analysis is to understand whether the trend followed by such metrics differ between files affected by a specific type of smell and files not affected by such a smell. For example, we expect that classes becoming Blobs will exhibit a higher growth rate than classes that are not going to become Blobs. In order to analyze the evolution of the quality metrics, we need to identify the function that best approximates the data distribution, i.e., the values of the considered metrics computed in a sequence of commits. We found that the best model is the linear function (more details are available in our technical report [45]). Having identified the model to be used, we compute, for each file fj ∈ ri , the regression line of its quality metric values. If file fj is affected by a specific smellk , we compute the regression line considering the quality metric values computed for each commit involving fj from the first commit (i.e., where the file was added to the versioning system) to the commit where the instance of
smellk was detected in fj . Instead, if fj is not affected by any smell, we consider only the first nth commits involving the file fj , where n is the average number of commits required by smellk to affect code instances. Then, for each metric reported in Table II, we compare the distributions of regression line slopes for cleanly and smelly files. The comparison is performed using a two-tailed Mann-Whitney U test [17]. The results are intended as statistically significant at α = 0.05. We also estimate the magnitude of the observed differences using the Cliff’s Delta (or d), a non-parametric effect size measure [21] for ordinal data. We follow the guidelines in [21] to interpret the effect size values: small for d < 0.33 (positive as well as negative values), medium for 0.33 ≤ d < 0.474 and large for d ≥ 0.474. Overall, the data extraction for RQ1 (i.e., the smells detection and metric computation at each commit for the 200 systems) took eight weeks on a Linux server having 7 quadcore 2.67 GHz CPU (28 cores) and 24 Gb of RAM. 2) Why are code smells introduced?: One challenge arising when answering RQ2 is represented by the identification of the specific commit (or also possibly a set of commits) where the smell has been introduced (from now on referred to as a smellintroducing commit). Such information is crucial to explain under which circumstances these commits were performed. A trivial solution would have been to use the results of our RQ1 and consider the commit cs in which DECOR detects for the first time a smell instance smellk in a source code file fj as a commit-introducing smell in fj . However, while this solution would work for smell instances that are introduced in the first commit involving fj (there is no doubt on the commit that introduced the smell), it would not work for smell instances that are the consequence of several changes, performed in n different commits involving fj . In such a circumstance, on one hand, we cannot simply assume that the first commit in which DECOR identifies the smell is the one introducing that smell, because the smell appearance might be the result of several small changes performed across the n commits. On the other hand, we cannot assume that all n commits performed on fj are those (gradually) introducing the smell, since just some of them might have pushed fj toward a smelly direction. Thus, to identify the smell-introducing commits for a file fj affected by an instance of a smell (smellk ), we use the following heuristic: •
•
if smellk has been introduced in the commit c1 where fj has been added to the repository, then c1 is the smellintroducing commit; else given C = {c1 , c2 , . . . , cn } the set of commits involving fj and leading to the detection of smellk in
TABLE III TAGS ASSIGNED TO THE SMELL - INTRODUCING COMMITS . Tag
Description COMMIT GOAL TAGS The commit aimed at fixing a bug The commit aimed at implementing an enhancement in the system The commit aimed at implementing a new feature in the system The commit aimed at performing refactoring operations PROJECT STATUS TAGS The commit was performed [value] before the issuing of a major release The commit was performed [value] after the starting of the project DEVELOPER STATUS TAGS The developer had a [value] workload when the commit has been performed The developer was the owner of the file in which the commit introduced the smell The developer was a newcomer when the commit was performed
Bug fixing Enhancement New feature Refactoring Working on release Project startup Workload Ownership Newcomer
600
[true,false] [true,false] [true,false] [true,false] [one day, one week, one month, more than one month] [one week, one month, one year, more than one year] [low,medium,high] [true,false] [true,false]
introducing commits in the example depicted in Fig. 1 are: c3 , c5 , and c7 . Overall, we obtained 9,164 smell-introducing commits in the 200 systems, that we used to answer RQ2 .
500
LOC
Values
400 300 200 100 c1
c2
c3
c4
c5
Commits
c6
c7
c8
Fig. 1. Example of smell-introducing commit identification.
cn we use the results of RQ1 to select the set of quality metrics M allowing to discriminate between the groups of files that are affected and not affected in their history by smellk . These metrics are those for which we found statistically significant difference between the slope of the regression lines for the two groups of files accompanied by at least a medium effect size. Let s be the slope of the regression line for the metric m ∈ M built when considering all commits leading fj to become affected by a smell and si the slope of the regression line for the metric m built when considering just two subsequent commits, i.e., ci−1 and ci for each i ∈ [2, ..., n]. A commit ci ∈ C is considered as a smell-introducing commit if |si | > |s|, i.e., the commit ci significantly contributes to the increment (or decrement) of the metric m. Fig. 1 reports an example aimed at illustrating the smellintroducing commit identification for a file fj . Suppose that fj has been involved in eight commits (from c1 to c8 ), and that in c8 a Blob instance has been identified by DECOR in fj . Also, suppose that the results of our RQ1 showed that the LOC metric is the only one “characterizing” the Blob introduction, i.e., the slope of the LOC regression line for Blobs is significantly different than the one of the regression line built for classes which are not affected by the Blob smell. The black line in Fig. 1 represents the LOC regression line computed among all the involved commits, having a slope of 1.3. The gray lines represent the regression lines between pairs of commits (ci−1 , ci ), where ci is not classified as a smellintroducing commit (their slope is lower than 1.3). Finally, the red-dashed lines represent the regression lines between pairs of commits (ci−1 , ci ), where ci is classified as a smell-introducing commit (their slope is higher than 1.3). Thus, the smell-
After having identified smell-introducing commits, with the purpose of understanding why a smell was introduced in a project, we classify them by assigning to each commit one or more tags among those reported in Table III. The first set of tags (i.e., commit goal tags) aims at explaining what the developer was doing when introducing the smell. To assign such tags we firstly download the issues for all 200 projects from their J IRA or B UGZILLA issue trackers. Then, we check whether any of the 9,164 smell-introducing commits were related to any of the collected issues. To link issues to commits we used (and complemented) two existing approaches. The first one is the regular expression-based approach by Fischer et al. [19] matching the issue ID in the commit note. The second one is a re-implementation of the ReLink approach proposed by Wu et al. [46], which considers the following constraints: (i) matching the committer/authors with issue tracking contributor name/email; (ii) the time interval between the commit and the last comment posted by the same author/contributor on the issue tracker must be less than seven days; and (iii) Vector Space Model (VSM) [6] cosine similarity between the commit note and the last comment referred above greater than 0.7. R E L INK has been shown to accurately link issues and commits (89% for precision and 78% for recall) [46]. When it was possible to identify a link between one of the smellintroducing commits and an issue, and the issue type was one of the goal-tags in our design (i.e., bug, enhancement, or new feature), such tag was automatically assigned to the commit and its correctness was double checked by one of the authors, which verified the correctness of the issue category (e.g., that an issue classified as bug actually was a bug). This happens in 471 cases, i.e., for a small percentage (5%) of the commits, which is not surprising and in agreement with previous findings [5]. In the remaining 8,693 cases, two of the authors manually analyzed the commits, assigning one or more of the goal-tags by relying on the analysis of the commit message and of the unix diff between the commit under analysis and its predecessor. Concerning the project-status tags (see Table III), the Working on release tag can assume as possible values one day, one week, one month, or more than one month before issuing
●
of a major release. The aim of such a tag is to indicate whether, when introducing the smell, the developer was close to a project’s deadline. We just consider major releases since those are the ones generally representing a real deadline for developers, while minor releases are sometimes issued just due to a single bug fix. To assign such tags, one of the authors identified the dates in which the major releases were issued by exploiting the GIT tags (often used to tag releases), and the commit messages left by developers. Concerning the Project startup tag, it can assume as values one week, one month, one year, or more than one year after the project’s start date. This tag can be easily assigned by comparing the commit date with the date in which the project started (i.e., the date of the first commit). This tag can be useful to verify whether during the project’s startup, when the project design might not be fully clear, developers are more prone to introducing smells. Note that the Project startup tag can be affected by the presence of projects migrated to git and with a partially available history. For this reason we check whether the first release tagged in the versioning system were either 0.1 or 1.0 (note that this might be an approximation since projects starting from 1.0 could have a previous 0.x history). Based on this analysis, we exclude from the Project startup analysis 31 projects, for a total of 552 smell-introducing commits. Finally, we assign developer-status tags to smell-introducing commits. The Workload tag measures how busy a developer was when introducing the bad smell. In particular, we measure the Workload of each developer involved in a project using time windows of one month, starting from the date in which the developer joined the project (i.e., performed the first commit). The Workload of a developer during one month is measured in terms of the number of commits she performed in that month. We are aware that such a measure (i) is approximated because different commits can require different amount of work; and (ii) a developer could also work on other projects. When analyzing a smell-introducing commit performed by a developer d during a month m, we compute the workload distribution for all developers of the project at m. Then, given Q1 and Q3 , the first and the third quartile of such distribution, respectively, we assign: low as Workload tag if the developer performing the commit had a workload less than Q1 , medium if Q1 ≤ workload < Q3 , high if the workload was higher than Q3 . The Ownership tag is assigned if the developer performing the smell-introducing commit is the owner of the file on which the smell has been detected. As defined by Bird et al. [10], a file owner is a developer responsible for more than 75% of the commits performed on the file. Lastly, the Newcomer tag is assigned if the smell-introducing commit falls among the first 3 commits in the project for the developer performing it. After assigning all the described tags to each of the 9,164 smell-introducing commits, we analyze the results by reporting descriptive statistics of the number of commits to which each tag type have been assigned. Also, we discuss several qualitative examples helping to explain our findings.
Android 100
●
75
0
● ● ● ● Blob
Eclipse 100 75 50 25
100 ● ● ● ● ● ● ● ● ● ● ●
●
50 25
Apache ● ●
● ● ● ● ● ● ● ● ● ● ● ● ● ● ● ● ● ● ● ● ●
0 Blob
● ● ● ● ● ● ● ● ● ● ● ● ● ● ●
CDSBP
CC
75 50 25
● ● ● ●
FD
●
0
SC
● ● ● ● ● ● ● ● ● ● ● ● ● ● ● ● ● ● Blob
Overall
●
100
● ●
● ● ● ● ● ● ● ● ● ● ●
● ● ● ● ● ● ● ● ● ● ● ● ● ● ● ● ● ● ● ● ●
CDSBP
CC
● ● ● ● ● ● ● ● ● ● ● ● ● ● ●
FD
75 50 25 0
SC
● ● ● ● ● ● ● ● ● ● ● ● ● ● ● ● ● ● ● ●
CDSBP
● ● ● ● ● ● ●
● ● ● ● ● ● ● ● ● ● ● ● ● ●
CC
FD
● ● ● ●
SC
● ● ● ● ● ● ● ● ● ● ● ● ● ● ● ● ● ● ● ● ● ● ● ● ● ● ●
Blob
● ● ● ● ● ● ● ● ● ● ● ● ● ● ● ● ● ● ● ● ● ● ● ● ● ● ● ● ●
●
CDSBP
CC
● ● ● ● ● ● ● ● ● ● ● ● ● ● ● ● ● ●
● ● ● ● ● ● ● ● ● ● ● ● ● ● ● ● ● ●
● ● ● ● ● ● ●
FD
SC
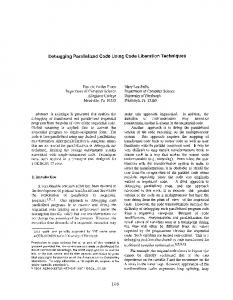
Fig. 2. Number of commits required by a smell to manifest itself.
III. A NALYSIS OF THE R ESULTS This section reports the analysis of the results achieved aiming at answering our two research questions. A. When are code smells introduced? Fig. 2 shows the distribution of the number of commits required by each type of smell to manifest itself. The results are grouped by ecosystems; also, we report the Overall results (all ecosystems together). As we can observe in Fig. 2, in almost all the cases the median number of commits needed by a smell to affect code components is zero, except for Blob on Android (median=3) and Complex Class on Eclipse (median=1). In other words, most of the smell instances (at least half of them) are introduced when a code entity is added to the versioning system. This is quite a surprising finding, considering the common wisdom that smells are generally the result of continuous maintenance activities [20]. However, the analysis of the box plots also reveals (i) the presence of several outliers; and that (ii) for some smells, in particular Blob and Complex Class, the distribution is quite skewed. This means that besides smell instances introduced in the first commit, there are also several smell instances that are introduced as a result of several changes performed on the file during its evolution. In order to better understand such phenomenon, we analyzed how the values of some quality metrics change during the evolution of such files. Table IV presents the descriptive statistics (mean and median) of the slope of the regression line computed, for each metric, for both smelly and clean files. Also, Table IV reports the results of the Mann-Whitney test and Cliff’s d effect size (Large, Medium, or Small) obtained when analyzing the difference between the slope of regression lines for clean and smelly files. Column cmp of Table IV shows a ↑ (↓) if for the metric m there is a statistically significant difference in the m’s slope between the two groups of files, with the smelly ones exhibiting a higher (lower) slope; a ”−” is shown when the difference is not statistically significant. The analysis of the results reveals that for all the smells, but Functional Decomposition, the files affected by smells show a higher slope than clean files. This suggests that the files that will be affected by a smell exhibit a steeper growth in terms of
TABLE IV RQ1 : SLOPE AFFECTED vs SLOPE NOT AFFECTED - M ANN -W HITNEY TEST ( ADJ . P - VALUE ) AND C LIFF ’ S D ELTA (d). Ecosys.
Smell
Blob
CDSP
Android
CC
FD
SC
Blob
CDSP
Apache
CC
FD
SC
Blob
CDSP
Eclipse
CC
FD
SC
Blob
CDSP
Overall
CC
FD
SC
Affected NO YES p-value Cliff’s d NO YES p-value Cliff’s d NO YES p-value Cliff’s d NO YES p-value Cliff’s d NO YES p-value Cliff’s d NO YES p-value Cliff’s d NO YES p-value Cliff’s d NO YES p-value Cliff’s d NO YES p-value Cliff’s d NO YES p-value Cliff’s d NO YES p-value Cliff’s d NO YES p-value Cliff’s d NO YES p-value Cliff’s d NO YES p-value Cliff’s d NO YES p-value Cliff’s d NO YES p-value Cliff’s d NO YES p-value Cliff’s d NO YES p-value Cliff’s d NO YES p-value Cliff’s d NO YES p-value Cliff’s d
LOC mean med 0.68 0 32.90 12.51