When Do Older Patients Change Primary Care Physicians? James W. Mold, MD, MPH, George E. Fryer, PhD, and A. Michelle Roberts, BA Background: Concerns have been raised about changes in the health care system that may disrupt continuity of care and thereby reduce the quality of that care. The purpose of this study was to look at the reasons that older patients give for changing primary care physicians (PCPs) and to look at relationships between the duration of the PCP-patient relationship and the perceived quality of primary care received. Methods: We analyzed data collected during the first 2 years of a longitudinal study of primary care patients 65 years of age and older. Variables included sociodemographic characteristics, duration of relationship with current PCP, reasons for leaving last PCP, estimated numbers of visits to PCP, other clinics, and emergency departments, and admissions to hospitals and nursing homes in the last year, self-rated health, 2 measures of health-related quality of life, and the Components of Primary Care Index (CPCI). Results: 799 patients of 23 PCPs were enrolled in year 1 of the longitudinal study, and 579 were reevaluated in year 2. The mean and median PCP-patient relationship durations were 10.27 and 8 years, respectively. Duration of the PCP-patient relationship was associated with greater patient age, income, level of education, and frequency of visits to the PCP. Longer relationship duration was also associated with higher scores on all 8 CPCI subscales. The distribution of reasons for changing PCP was associated with duration of relationship; those with a longer relationship were more likely to change involuntarily. Insurance-related reasons for changing PCP were more common in those who had changed more recently. One hundred and fourteen (14%) changed PCP during the first year of the study. Three CPCI subscale scores predicted PCP change, accumulated knowledge, communication, and family orientation. Eighty-seven percent changed involuntarily, 44% for insurance-related reasons and 40% because their doctors had moved, retired, or died. Conclusions: Older patients, particularly those who are older and have more education and income, tend to stay with their PCPs until they are forced to change. The longer they stay in the relationship, the better they feel about the quality of the primary services they receive. Changes in the health care system may have increased the number of patients forced to change PCP. (J Am Board Fam Pract 2004;17: 453– 60.)
One of the defining principles of primary care is “a sustained partnership with patients.”1 Continuity of care is associated with:
● ● ●
● ●
improved patient,2,3 physician, and staff satisfaction4 – 6 increased adherence to medications7–9 and appointments10,11
● ● ● ● ● ●
Submitted, revised, 7 June 2004. From the Department of Family and Preventive Medicine, University of Oklahoma Health Sciences Center, Oklahoma City (JWM, MR), and The Robert Graham Center, American Academy of Family Physicians, Washington DC (GEF). Address correspondence to James W. Mold, MD, MPH, Department of Family and Preventive Medicine, 900 NE 10th Street, Oklahoma City, OK 73104 (email:
[email protected]).
http://www.jabfp.org
● ●
increased patient disclosure of emotional problems12 greater patient trust in physicians13 decreased use of laboratory tests14 better recognition of medical problems15 increased receipt of preventive services and comprehensiveness of care16 –20 better coordination of care21 improved chronic illness care22 decreased preventable adverse medical events14,23 decreased use of emergency rooms24 –25 fewer and shorter hospitalizations16,25–28 decreased cost of care26,29
Patients who are forced to change primary care physicians are likely to have gaps in care lasting months or years.17
When Do Older Patients Change Primary Care Physicians?
453
A sustained, continuous relationship ought to be particularly important for older patients, who are more likely to have multiple, complex, chronic health conditions. Breslau30 showed that continuity was more important for chronically disabled children than for healthy children. Wasson et al,16 in the only randomized, controlled trial of continuity of care published to date, showed that greater continuity of care over an 18-month period resulted in fewer and shorter hospitalizations among veterans 55 years of age and older. Weiss and Blustein,26 using linked data from the 1991 Medicare Current Beneficiary Survey and Medicare claims submitted to the Health Care Financing Administration (now the Medicare and Medicaid Services), demonstrated a “dose-response” relationship between duration of the primary care physician-patient relationship and reduced hospitalizations, Medicare Part A and Medicare Part B claims, and an increased likelihood of influenza vaccination for patients 65 years of age and older. In the present study, we have analyzed 2 years of data from the Oklahoma Longitudinal Assessment of the Health Outcomes of Mature Adults (OKLAHOMA) Studies. Our objectives were to estimate how long older patients stay with the same primary care physician, how often they change primary care physicians, the reasons they change, and whether those rates and reasons have changed over the years. We also examined patient characteristics associated with duration of relationship with a primary care physician and whether components of the primary care process are associated with either duration or voluntary termination of the relationship.
Methods The OKLAHOMA Studies The OKLAHOMA Studies is a dataset derived from a cohort of patients drawn from the active rolls of family physicians in central Oklahoma evaluated once a year since 1999. The original purpose of the OKLAHOMA Studies project was to determine the impact of primary care services on health outcomes in the elderly. Between January 1, 1999, and December 31, 2000, 799 patients aged 65 years and older were recruited from the practices of 23 family physician members of the Oklahoma Physicians Resource/ Research Network (OKPRN), a primary care
454 JABFP November–December 2004
Vol. 17 No. 6
practice-based research network in Oklahoma. Participating physicians were members of 9 primary care practices within a 50-mile radius of Oklahoma City. Each physician generated a list of all patients aged 65 years and older seen by them within 18 months. They deleted persons who were no longer their patients, who were currently in nursing homes, who were too confused to sign informed consent, or who were dead. A letter was sent from the practices to those remaining on the lists explaining the study and inviting them to participate. This was followed in 2 weeks by a phone call from the project coordinator. Patients who agreed to participate were asked to complete a questionnaire sent to them 2 weeks before their enrollment visit. The questionnaire included demographic information, habits, medical conditions, symptoms, functional status, self-rated health, and 3 measures of health related quality of life: the Quality of Well-Being Self-administered Scale (QWB-SA),31 the Health Utilities Index (HUI-3),32 and the Medical Outcomes Study Short Form 36 (SF-36).33 The questionnaire also contained the Components of Primary Care Index (CPCI), a 47-item instrument designed to measure perceived quality of primary care services in 8 domains: comprehensiveness of care, physician’s accumulated knowledge about the patient, communication between patient and physician, patient preference for regular doctor, coordination of care, physician advocacy for the patient, family orientation, and community orientation.32 Additional related questions included duration of the participants’ relationships with their current primary care physicians, duration of their relationships with the practices/clinics, estimated number of visits to the primary care doctors over the last year, visits to other doctors in the same office, visits to other doctors outside of that office, emergency department visits, hospitalizations, and admissions to a nursing home. The following open-ended question concerning change of primary care physician was included in the year 1 questionnaire: “When you last changed primary care physicians, why did you do so?” Space was provided for participants to write in an answer. The investigative team categorized responses to this question by consensus. In year 2, based on this initial categorization, participants were given the following options for reason for changing physician: “(1) insurance change; (2) I moved or changed
http://www.jabfp.org
the location of my work; (3) my doctor retired, died, moved, or closed his/her practice; (4) I was asked by my doctor not to return; (5) I had problems with the doctor; (6) a family member requested that I change; (7) I had problems with the office staff; and (8) ‘other.’” After analyzing the “other” responses from year 2, we added a category for those who changed doctors because of the distance from their home to the doctor’s office or hospital and an expansion of the “family member recommended” category to include recommendations of friends and doctors. Nonresponses to the year 1 (open-ended) question were completed when possible from responses in years 2 or 3 if no doctor change had occurred since year 1. We put “other” responses into an appropriate category whenever possible. Response options 1 to 4 were categorized as involuntary, and 5 to 7 were considered voluntary. The new “distance” category was considered to be involuntary. All patients were enrolled in their own family physicians’ offices by 1 of 2 research nurses. At the enrollment visit, the nurses reviewed the study protocol and obtained informed consent. They then reviewed the patient questionnaire for missing data and conducted a focused physical examination including vital signs, neurosensory function, and cognitive assessment. Members of the initial cohort of OKLAHOMA Studies participants were reenrolled 1 year later using essentially the same process. Those who declined to participate both initially and subsequently were asked to provide information about why they weren’t interested, their current age, race, their self- perceived state of health, and whether they had changed primary care physicians in the past year. Statistical Analyses Data collected in the first year of the OKLAHOMA Studies was used to estimate the duration of relationship between participants and their primary care physicians. Duration of relationship was categorized into the following subgroups: ⱖ10 years, 5 to 9 years, ⬍5 years. Linear regression was used to identify associations between demographic variables (age, gender, race, education, income), health status (self-rated health on a scale of 0 to 100, QWB-SA, HUI-3, and MOS SF-36), health care utilization variables (number of visits to primary care physician, number of visits to other physicians, number of emergency department visits,
http://www.jabfp.org
number of hospitalizations), and duration of relationship with a primary care physician. We used analysis of variance to examine the associations between CPCI subscale scores and duration of relationship, using the actual (uncategorized) duration. Data collected in the second year of the study were used to identify patients who had changed physicians in the 1-year interval between assessments. Mean CPCI subscale scores for those who changed physicians during the first year of the study were calculated from questionnaires completed during year 1. Associations between initial CPCI subscale scores and subsequent change or no change was examined using the Student’s t test for independent samples. Logistic regression models were constructed for associations between sociodemographic, health status, and utilization variables and voluntary and involuntary change of physicians. Independent variables were first considered within each of the 3 variable groups. The best group representatives (P ⬍ .2) were then considered in the full model and eliminated one at a time based on p value until the most parsimonious model was identified.
Results Patient Population The number of patients included on the physicians’ original lists, before applying exclusion criteria, was 4025. Three hundred and twenty-six were known to have died, 209 were currently in nursing homes, 149 were felt to be too confused to sign consent, and 778 had switched physicians, leaving 2563 potentially eligible patients. Of these, 728 were unreachable by telephone after at least 3 attempts. One thousand and twenty-six declined to participate; of these, 87 cited transportation problems, 21 cited out-of-state travel plans, 245 cited personal illness or illness of spouse, and 406 cited lack of interest. Another 267 said that they were just too busy. Of the 809 who agreed to participate, 10 were excluded by the project coordinator because they seemed to be unable to understand the telephone instructions. Thus 799 (32% of eligible patients) were enrolled. Participants were more likely than nonparticipants to be male (P ⫽ .002), younger (P ⬍ .0001), better educated (P ⬍ .0001), and in better (self-rated) health (P ⬍ .0001). African Americans tended to be less willing to participate (P ⫽ .06).
When Do Older Patients Change Primary Care Physicians?
455
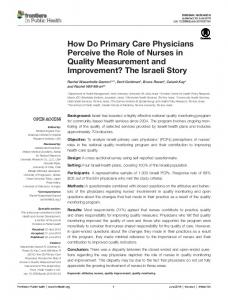
Table 1. CPCI Subtest Scores* by Duration of Primary Care Physician-Patient Relationship Duration of Relationship CPCI Scores
0 to 4 years
5 to 9 years
ⱖ10 years
P value†
Comprehensiveness Accumulated knowledge Communication Preference for reg doctor Coordination Advocacy Family context Community context Total score
4.76 (0.74) 4.22 (0.93) 4.41 (0.85) 4.85 (0.67) 4.62 (0.86) 4.75 (0.70) 3.31 (1.37) 3.87 (1.33) 34.74 (5.42)
5.04 (0.64) 4.73 (0.79) 4.89 (0.75) 5.04 (0.69) 4.91 (0.88) 4.70 (0.52) 4.07 (1.46) 4.28 (1.41) 37.77 (5.15)
5.18 (0.60) 5.09 (0.70) 4.90 (0.78) 5.18 (0.66) 4.94 (0.86) 4.81 (0.48) 4.69 (1.08) 4.86 (1.02) 39.63 (4.48)
⬍.0001 ⬍.0001 ⬍.0001 ⬍.0001 .001 ⬍.0001 ⬍.0001 ⬍.0001 ⬍.0001
* Data are presented as mean (SD). † Analysis of variance based upon actual duration of relationship (not categorized).
The participants had a mean age of 73.4 years (SD, 5.9; range, 64 to 94) (1 patient aged 64 was inadvertently included). Fifty-six percent (56%) were female, and 86% were white. There were relatively few participants 85 years of age or older, and most participants were high-functioning and in relatively good health. The urban/suburban/rural mix of physicians was 13/7/4 and of participants was 210/398/191. A number of the urban clinicians were faculty with less than full-time practices. Of the original 799 participants, 222 (28%) did not re-enroll in year 2. Their reasons included: declined (N ⫽ 195), died (N ⫽ 17), moved to a nursing home (N ⫽ 3), incapacitated (N ⫽ 4), and unreachable (N ⫽ 3). Those who declined gave the following reasons: not interested in continuing to participate (N ⫽ 64), ill or spouse ill (N ⫽ 53), no transportation (N ⫽ 5), traveling (N ⫽ 1), and other (N ⫽ 72). Those who dropped out after 1 year were more likely to have less education (P ⬍ .0001), and, on average, they had been seeing their primary care provider for a shorter period of time (8.49 vs 10.84 years; P ⫽ .001). They were also more likely to have changed primary care physicians since the beginning of the study (21% vs. 14%; P ⫽ .005). They did not differ with respect to age, gender, race, or self- rated health status. Duration of Relationship with Primary Care Physician The mean (SD) duration of current primary care physician- patient relationship in this population on initial enrollment was 10.27 years (8.8 years). The median was 8 years, and the range was ⬍1 to 456 JABFP November–December 2004
Vol. 17 No. 6
40 years. Slightly more than 47% had seen the same primary care physician for 10 or more years, 14% for 5 to 9 years, and 38% for 4 or less years. Longer duration of relationship with the primary care physician, after controlling for all other sociodemographic, health status, and utilization-related variables, was associated with greater patient age (r ⫽ 0.11, P ⬍ .01), higher income (r ⫽ 0.10, P ⬍ .01), and higher level of education (r ⫽ 0.08, P ⫽ .03), and with more frequent visits to the office of the patient’s primary care physician (r ⫽ 0.08, P ⫽ .03). However, these 4 variables accounted for only 4.8% of the overall variability (R2 ⫽ 0.048). Duration of relationship was also associated with PCP location. Participations with rural PCPs were more likely to have longer relationships with their PCP (P ⬍ .0001). Participants with longer relationships rated their physicians higher on all 8 subscales of the CPCI as shown in Table 1. Reasons Given for Changing Physicians The reasons given for changing primary care physicians, by duration of relationship, are shown in Table 2. A statistically significant association was found between reason for changing and duration of the relationship (F ⫽ 12.14; df ⫽ 7; P ⬍ .001). There was also a significant relationship between voluntary or involuntary change of physician and duration of relationship. Those with a longer duration of relationship more often listed an involuntary reason for changing, most often having to do with the doctor dying or retiring (P ⫽ .002). One hundred and fourteen participants (14%) changed physicians during year 1 of the study (Ta-
http://www.jabfp.org
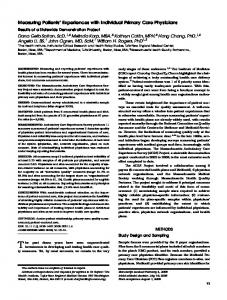
Table 2. Reasons for Changing Primary Care Physician by Duration of Relationship Duration of Relationship Reason Insurance/cost issues Patient moved Doctor left/died/retired Distance to doctor/hospital Dissatisfied with doctor Family/friend/doctor recommendation Problems with staff Other
ⱖ10 years 379 (47%)
5 to 9 years 115 (14%)
⬍5 years 305 (38%)
Year 1* 114 (14%)
10% 17% 62% 3% 4% 2% 0% 2%
17% 23% 38% 2% 15% 2% 2% 2%
32% 9% 25% 6% 16% 2% 1% 8%
44% 3% 40% 0% 5% 2% 0% 3%
* Patients who changed physicians during the first year of the study. (These same patients are included in one of the other columns as well.)
ble 2). Reasons for changing were available for 62 of them, those who remained in the study. After controlling for sociodemographic, health status, and utilization-related variables, the only variable associated with changing was the duration of the relationship. Those who changed were more likely to have been with the same PCP for a shorter period of time (mean duration of relationship 4.82 vs 11.16 years; P ⬍ .001). This was particularly true for those who changed voluntarily (mean duration of relationship, 5.09 vs 10.50 years; P ⬍ .001). Location of PCP (urban, suburban, rural) was also associated with reason for changing (P ⬍ .0001). Participants with urban PCPs were more likely to have changed for insurance reasons, and they were less likely to have changed because their PCP retired, died, or moved. Urban participants were probably more likely to have changed voluntarily (P ⫽ .056). Three CPCI subtest scores at the time of initial enrollment were also significantly different between those who changed doctors during the first year and those who did not. Those who changed had rated their PCPs lower on accumulated knowledge (P ⬍ .0001), communication (P ⫽ .001), and family orientation (P ⬍ .0001).
Discussion Researchers have, for the most part, examined the potential importance of continuity of care with a primary care physician by looking at associations of various outcomes and costs with variations in continuity. We, on the other hand, have examined the importance of continuity of care to older patients
http://www.jabfp.org
by looking at how likely they are to change primary care physicians voluntarily and by examining the associations between various measures of primary care quality with duration of the relationship. Our analyses also contribute new and alarming information about the reasons and frequency at which older people are forced to change involuntarily, including instability in the primary care physician workforce. Very little information has been published about the average duration of the relationship between older patients and their primary care physicians and whether it has changed over time. Weiss and Blustein found that 35.8% of Medicare beneficiaries 65 years of age and older had changed their usual source of care 10 or more years ago, 19.6% between 5 and 10 years, 15.5% between 3 and 5 years ago, 18.7% between 1 and 3 years ago, and 10.5% within the past year.26 These percentages are remarkably similar to ours. We were able to show that when older patients change their PCPs, they usually do so involuntarily. Since the recent health care reform initiative and advent of health maintenance organizations (HMOs), there have been concerns about the discontinuity of care that results from changes in insurance plans and their provider panels.34 The Medical Expenditures Panel Survey found that 25% of adults who changed their usual source of care in 1996 did so because of changes in their insurance coverage.31 The impact on the elderly has been related primarily to Medicare HMOs, which have often enticed healthier patients to join by covering the usual Medicare copayments and
When Do Older Patients Change Primary Care Physicians?
457
deductibles and providing prescription medication coverage. Many of these plans have subsequently increased their premiums, reduced benefits, and/or underpaid physicians, forcing them to withdraw from the preferred provider pool. The result has been disruption and discontinuity of care.35 There are a variety of other reasons why older patients may be forced to change PCPs. Some move to be closer to family. Others are admitted to nursing homes or assisted living facilities to which their doctor may not go. Still others lose their source of transportation or have trouble traveling as far as they once did. Physicians also move, retire, and die. During 1999, the initial enrollment year for the OKLAHOMA Studies, Pacificare, the major Medicare HMO provider in central Oklahoma, reduced its capitation to physicians and hospitals, and many physicians could no longer afford to accept it. This caused many older patients to have to choose whether to leave their primary care physician, or go back to regular Medicare. The HMO product offered medication coverage as well as low or no deductibles and copayments and lower premiums. In addition, one of the participating physicians left the practice because of the high overhead and low reimbursement rates associated with seeing a rural, largely Medicare- and Medicaid-insured population. In the second year, another participating physician moved his practice and stopped accepting patients insured by the Medicare HMO, and a third moved his practice to another town. In an unpublished analysis of the American Medical Association’s Physician Masterfiles, Fryer found that between 2000 and 2002, 4.5% of US physicians retired and another 4.7% moved to a different state to practice, suggesting that our experience of physician instability was somewhat higher than the national average (17% vs. 9% over a 2-year period). This may have falsely diminished the apparent effects of dissatisfaction as a reason for changing physicians during the first year of the study. The duration of relationship with the PCP was strongly associated with higher CPC1 subscale scores. Although this may, in part, be a reflection of selection bias, it supports the belief that longitudinal relationships are an important component of the primary care function. It could also simply reflect the fact that patients who like their PCPs tend to stay with them. Lower CPCI subscale scores on PCP accumulated knowledge, communication skills, and family orientation in patients who
458 JABFP November–December 2004
Vol. 17 No. 6
changed PCP in year 1 of the OKLAHOMA Studies suggests that these may be particularly valued characteristics of the relationship between older patients and their PCPs. Our findings support the notion that rural elders are less likely to be forced to change PCPs for insurance or cost reasons. They had longer relationships with their PCPs and had more often changed only when the PCP retired, moved, or died. On the other hand, urban participants more often changed PCPs voluntarily, perhaps because they had more choices, and more often had to change PCPs for insurance reasons. Very little information has been published about the reasons older patients voluntarily change their PCP. In a study of adult patients of all ages, Safran et al36 found that, for the 20% of primary care patients who changed physicians over a 3-year period, the quality of the physician-patient relationship was the most important determinant of voluntary disenrollment. In a study of patients aged 20 to 75 being seen in several academically affiliated primary care internal medicine practices, dissatisfaction with visit duration and failure of the physician to listen to the patient’s concerns were the most significant predictors of intention to change physicians.37 A qualitative study of adult patients in England found that the most common reasons for voluntary change of primary care physician were accessibility, physician attitude, clinical issues, and personal characteristics of the physician. In most cases, the reasons for change were multifactorial.38 In contrast to this study, a postal survey of British primary care patients who had not changed their address found that the most frequent reasons for changing doctors were distance issues (41%), dissatisfaction with care (35%), and dissatisfaction with practice organization (36%).39 Safran40 has identified reasons to be concerned about deterioration in the quality of doctor-patient relationship over the past several years. Our study has some obvious weaknesses. First, it is a study of a selected subset of the active patients of private family physicians, members of a practicebased research network, from central Oklahoma, during a specific period of time. Second, there was a considerable amount of selection bias at the time of enrollment, both intended (exclusion of those living in nursing homes and those with significant cognitive impairment) and unintended (a majority of those invited declined to participate). There was
http://www.jabfp.org
also a relatively high (28%) drop-out rate after the first year. Sampling active patients of family physicians could be expected to bias our results toward longer patient-PCP relationships. However, a significant majority of older patients has a usual source of care, and in most cases, this is a primary care physician.41 There is ample evidence now that the patients of physician members of practice-based research networks are not significantly different from primary care patients in general.42– 44 Oklahoma City is considered one of the 10 most representative markets by private industry. However, it has a relatively low penetration by Medicare HMOs. The percentage of patients in our sample insured by Medicare HMOs decreased from 18.6% in the first year to 13.3% in the second year and 6.3% in the third year, approximating the average rates in Oklahoma during those years. The selection bias introduced by initial nonparticipation could have biased the results in the direction of longer physician-patient relationships and lower rates of change. Likewise, the exclusion of nursing home patients, who are often forced to change physicians at the time of institutionalization, and the cognitively impaired, who sometimes change doctors in search of better care, could have skewed the results in the same direction. Therefore, our estimates of duration of relationship may be higher and rate of change lower than for the general population of older patients. If a long-term relationship with a primary care physician is especially important to the elderly, as clinical experience and the literature seem to indicate, then this study should raise concerns about changes in the health care system in recent years, including insurance and physician workforce instability. Given a choice, it seems that most older patients stay with their primary care physician until the physician dies or retires or the patient moves. The strongest predictor of continuance of the relationship is the duration of the current relationship. This is particularly true for those who have higher income and more education, factors likely to be associated with greater ability to adapt to health care system changes. That 14% of our study sample changed physicians in a single year (1999), is alarming, especially because 87% of those who changed did so involuntarily, either because their insurance required it or their physicians moved, retired, or died.
http://www.jabfp.org
Current proposals for reform and expansion of the Medicare program, particularly those that promote privatization, could potentially increase the rate of involuntary discontinuity because of insurance coverage changes and further instability in the physician workforce. This would probably have a significant negative impact on the quality of primary health care services available to the elderly.
References 1. Donaldson M, Yordy K, Vanselow N. Primary care: America’s health in a new era. Washington DC: Institute of Medicine; 1996. 2. Hjortdahl P, Laerum E. Continuity of care in general practice: effect on patient satisfaction. BMJ 1992;304:1287–90. 3. Shortell SM. Continuity of medical care: Conceptualization and measurement. Med Care 1976;14: 377–91. 4. Caplan EK, Sussman MB. Rank order of important variables for patient and staff satisfaction with outpatient service. J Health Hum Behav 1966;7:133–7. 5. Shortell SM, Richardson WC, LoGerfo LP, Diehr P, Weaver B, Green KE. The relationships among dimensions of health services in two provider systems: a causal model approach. J Health Soc Behav 1977;18:139 –59. 6. Woolley FR, Kane RL, Hughes CC, Wright DD. The effects of doctor-patient communication on satisfaction and outcome of care. Soc Sci Med 1978;12: 123– 8. 7. Charney E, Bynum R, Eldredge D, et al. How well do patients take oral penicillin? A collaborative study in private practice. Pediatrics 1967;40:188 –95. 8. Becker MH, Drachman RH, Kirscht JP. Predicting mothers’ compliance with pediatric medical regimens. J Pediatr 1972;81:843–54. 9. Boethius G. The treatment of hypertension–an analysis of drug prescription data. Acta Med Scand Suppl 1976;602:120 –3. 10. Alpert JJ. Broken appointments. Pediatrics 1964;34: 127–32. 11. Poland ML. The effects of continuity of care on the missed appointment rate in a prenatal clinic. JOGN Nurs 1976;5:45–7. 12. Becker MH, Drachman RH, Kirscht JP. Continuity of pediatrician: new support for an old shibboleth. J Pediatr 1974;84:599 – 605. 13. Mainous AG 3rd, Baker RL, Love MM, Gray DP, Gill JM. Continuity of care and trust in one’s physician: evidence from primary care in the United States and the United Kingdom. Fam Med 2001;33: 22–7. 14. Hjortdahl P, Borchgrevink CF. Continuity of care: influence of general practitioners’ knowledge about
When Do Older Patients Change Primary Care Physicians?
459
15.
16.
17.
18.
19.
20.
21.
22.
23.
24.
25.
26.
27.
28.
29.
their patients on use of resources in consultations. BMJ 1991;303:1181– 4. Starfield BH, Simborg DW, Horn SD, Yourtee SA. Continuity and coordination in primary care: their achievement and utility. Med Care 1976;14:625–36. Wasson JH, Sauvigne AE, Mogieinicki RP, Frey WG, Sox CH, Gaudette C, Rockwell A. Continuity of outpatient medical care in elderly men. JAMA 1984;252:2413–7. Burstin HR, Swartz K, O’Neil AC, Orav EJ, Brennan TA. The effect of change of health insurance on access to care. Inquiry 1998 –99;35:389 –97. Sturmberg JP, Schattner P. Personal doctoring. Its impact on continuity of care as measured by comprehensiveness of care score. Aust Fam Physician 2001;30:513– 8. Ettner SL. The relationship between continuity of care and the health behavior of patients: does having a usual physician make a difference? Med Care 1999; 37:547–55. Ettner SL. The timing of preventive services for women and children: the effect of having a usual source of care: Am J Public Health 1998;88:135– 6. Christakis DA, Wright JA, Zimmerman FJ, Bassett AL, Connell FA. Continuity of care is associated with wellcoordinated care. Ambul Pediatr 2003;3:82– 6. Parchman ML, Burge SK, Residency Research Network of South Texas Investigators. Continuity and quality of care in type 2 diabetes: a Residency Research Network of South Texas Study. J Fam Pract 2002;51:619 –24. Petersen LA, Brennan TA, O’Neil AC, Cook EF, Lee TH. Does housestaff discontinuity of care increase the risk for prevents adverse events? Ann Intern Med 1994;121:866 –72. Gill JM, Mainous AG 3rd, Nsereko M. The effect of continuity of care on emergency department use. Arch Fam Med 2000;9:333– 8. Christakis DA, Mell L Koepsell TD, Zimmerman FJ, Connell FA. Association of lower continuity of care with greater risk of emerge department use and hospitalization in children. Pediatrics 2001;107:524 –9. Weiss LJ, Blustein J. Faithful patients: the effect of long-term physician-patient relationships on the costs and use of health care by older Americans. Am J Public Health 1996;86:1742–7. Mainous AG 3rd, Gill JM. The importance of continuity of care in the likelihood of future hospitalization: is site of care equivalent to a primary clinician? Am J Public Health 1998;88:1539 – 41. Gill JM, Mainous AG 3rd. The role of provider continuity in preventing hospitalizations. Arch Fam Med 1998;7:352–7. Dietrich AJ, Marton KI. Does continuous care from a physician make a difference? J Fam Pract 1982;15: 929 –37.
460 JABFP November–December 2004
Vol. 17 No. 6
30. Breslau N. Continuity re-examined: differential impact on satisfaction with medical care for disabled and normal children. Med Care 1982;20:347– 60. 31. Andresen EM, Rothenberg BM, Kaplan RM. Performance of self-administered mailed version of the quality of well-being (QWB-SA) questionnaire among older adults. Med Care 1998;16:1349 – 60. 32. Torrance GW. Measurement of health state utilities for economic appraisal. J Health Econ 1986;5:1–30. 33. Ware JE, Snow KK, Kosinski M, Gandek B. SF-36 health survey manual interpretation guide. Boston: New England Medical Center, The Health Institute; 1993. 34. Flocke SA, Stange KC, Zyzanski SJ. The impact of insurance type and forced discontinuity on the delivery of primary care. J Fam Pract 1997;45:129 –35. 35. Morgenstern NE, Gonzales R, Anderson RJ. Involuntary disenrollment from a Medicare managed care plan at an academic medical center: effect on patients. J Am Geriatr Soc 2000;48:1151– 6. 36. Safran DG, Montgomery JE, Chang H, Murphy J, Rogers WH. Switching doctors: predictors of voluntary disenrollment from a primary physician’s practice. J Fam Pract 2001;50:130 – 6. 37. Federman AD, Cook EF, Phillips RS, Puopolo AN, Haas JS, Brennan TA, et al. Intention to discontinue care among primary care patients. Influence of physician behavior and process of care. J Gen Intern Med 2001;16:668 –74. 38. Gandhi IG, Parle JV, Greenfield SM, Gould S. A qualitative investigation into why patients change their GPs. Fam Pract 1997;14:49 –57. 39. Billinghurst B, Whitfield M. Why do patients change their general practitioner? A postal questionnaire study of patients in Avon. Br J Gen Pract 1993;43:336 – 8. 40. Safran DG. Defining the future of primary care: what can we learn from patients. Ann Intern Med 2003;138:248 –55. 41. Mold JW, Fryer GE, Phillips RL Jr, Dovey SM, Green LA. Family physicians are the main source of primary health care for the Medicare population. Am Fam Physician 2002;66:2032 42. Nutting PA, Baier M, Werner JJ, Cutter G, Reed FM, Orzano AJ. Practice patterns of family physicians in practice-based research networks: a from ASPN. Ambulatory Sentinel Practice Network. J Am Board Fam Pract 1999;12:278 – 84. 43. Green LA, Miller RS, Reed FM, Iverson DC, Barley GE. How representative of typical practice are practice-based research networks report from the Ambulatory Sentinel Practice Network Inc. (ASPN). Arch Fam Med 1993;2:939 – 49. 44. Gilchrist V, Miller RS, Gillanders WR, Scheid DC, Logue EE, Iverson DC, et al. Does family practice at residency teaching sites reflect community practice? J Fam Pract 1993;37:555– 63.
http://www.jabfp.org