103
British Journal of Social Psychology (2013), 52, 103–121 © 2011 The British Psychological Society www.wileyonlinelibrary.com
When scoring algorithms matter: Effects of working memory load on different IAT scores Florian Schmitz1∗ , Sarah Teige-Mocigemba1 , Andreas Voss2 and Karl C. Klauer1 1 2
Albert-Ludwigs-Universit¨at Freiburg, Germany Ruprecht-Karls-Universit¨at Heidelberg, Germany In most process accounts of the Implicit Association Test (IAT), it is assumed that compatible and incompatible IAT blocks require different amounts of working memory capacity (WMC) and recruit executive functions such as task switching and inhibition to different extents. In the present study (N = 120), cognitive load during the completion of an IAT was experimentally manipulated by means of an oral random-number generation secondary task. Cognitive load led to slower latencies and more errors, especially in the incompatible block. However, different IAT scores, including conventional scores and D-scores, were affected differentially by the load manipulation: scores based on raw data of task performance such as latencies and errors were increased whereas scores that use transformations such as log-latency scores and D-scores were decreased. A number of analyses shed light on the reasons for the unexpected dissociation between scoring algorithms. Remarkably, external correlations of the IAT scores were not affected by the experimental manipulation.
Implicit and explicit attitudes usually show correlations of medium size, and a number of factors have been identified that moderate their relationship (Hofmann, Gawronski, Gschwendner, Le, & Schmitt, 2005). In particular, theories of implicit–explicit relationships have emphasized the moderating role of available control on explicit attitude measures (Fazio & Olson, 2003; Hofmann, Gschwendner, Nosek, & Schmitt, 2005; Ranganath, Smith, & Nosek, 2008). For example in measuring prejudice, an adjustment of explicit self-reports may take place in line with the motivation to control prejudiced reactions (Hofmann, Gschwendner, & Schmitt, 2005). Accordingly, control may exert an influence on the implicit–explicit relationship via its impact on explicit attitudes. However, not only measures for the assessment of explicit attitudes, but also measures designed to assess implicit attitudes such as speeded classification tasks are likely to be influenced by control processes (Gawronski, Deutsch, LeBel, & Peters, 2008). The present paper focuses on the potential role of control resources on one of the
∗ Correspondence
should be addressed to Florian Schmitz, Institut f¨ur Psychologie, Albert-Ludwigs-Universit¨at Freiburg, D-79085 Freiburg, Germany (e-mail:
[email protected]).
DOI:10.1111/j.2044-8309.2011.02057.x
104
Florian Schmitz et al.
most popular implicit measures, namely the Implicit Association Test (IAT; Greenwald, McGhee, & Schwartz, 1998). The IAT involves two tasks, a concept task and an attribute task. For example, in a political attitudes IAT, the concept task requires one to classify stimuli as belonging to a left or right political standpoint, respectively, and the attribute task requires one to classify stimuli as either positive or negative. In the critical IAT blocks, both tasks are alternating from trial to trial. As the same two response buttons are used for both tasks, a compatible or incompatible mapping is expected to result as a function of the participants’ political attitudes. The performance difference between the compatible and the incompatible IAT phase is called the IAT effect. Note that alternating between the IAT’s concept and attribute tasks requires the activation, maintenance, and shielding of relational representations (for a description of these requirements see Wilhelm & Oberauer, 2006). Accordingly, most process accounts of the IAT predict an impact of executive control factors, such as task switching (Klauer & Mierke, 2005; Mierke & Klauer, 2001, 2003), inhibition (Conrey, Sherman, Gawronski, Hugenberg, & Groom, 2005; Sherman et al., 2008), and to a lesser extent working memory capacity (WMC; Klauer, Schmitz, Teige-Mocigemba, & Voss, 2010). Irrespective of the particular executive functions specified in the different theories, all process accounts emphasize that completion of the incompatible IAT block draws more heavily on executive control than completion of the compatible block (for more details, see Klauer et al., 2010). Consequently, availability of control resources should contribute to IAT effects, with low control leading to larger IAT effects. In support of this assumption, it was shown that content-unrelated IATs share method variance (Back, Schmukle, & Egloff, 2005; Mierke & Klauer, 2003), which in turn could be predicted by stable individual differences in executive functions (Klauer et al., 2010). More recently, attempts have been undertaken to dissociate controlled and automatic components in the IAT in order to make more specific and less-biased predictions. One of the most prominent approaches is the Quadruple Process Model (Quad Model; Conrey et. al., 2005; Sherman et al., 2008) that has been used to distinguish between controlled and automatic processes in the IAT. Situational availability of control resources Available control resources can also vary as a function of situational factors, such as noise, distractors capturing attention, or other ‘aversive’ test conditions. This issue is obviously of practical relevance for IAT assessments in the field, such as, for instance, testing implicit product preferences in a noisy shopping mall. However, the same problem may also arise in laboratory settings with suboptimal working conditions (e.g., group or classroom testing, or a noisy test location). Additionally, a number of other situational factors and states of the participants may affect task performance directly or indirectly by their effects on available WMC, attention, and control resources (Eysenck, 1985; Eysenck, Derakshan, Santos, & Calvo, 2007; Frantz, Cuddy, Burnett, Ray, & Hart, 2004; Govorun & Payne, 2006; Hillier, Alexander, & Beversdorf, 2006; Matthews & Campbell, 2010; Steinhauser, Maier, & H¨ ubner, 2007). For example, a major requirement in the IAT is cognitive flexibility (i.e., task switching, see Klauer et al., 2010), because of the trial-to-trial changes in the relevance of stimulus features. In previous studies it has been shown that induced stress can
When Scoring Algorithms Matter
105
impair task-switching performance, as demonstrated for auditory stress (Hillier et al., 2006) and cognitive depletion (Steinhauser et al., 2007). In a similar vein, WMC was shown to have a certain influence on IAT performance (Klauer et al., 2010), which, in turn, is influenced by a number of situational variables. This was demonstrated for state stress (Matthews & Campbell, 2010) and state anxiety (Eysenck, 1985). Additionally, there is evidence that effects of anxiety become greater as the overall task demands on executive functions increase (cf. Eysenck et al., 2007). Finally, it was shown that ego depletion (e.g., Baumeister, 2002) impairs control resources in the IAT (Govorun & Payne, 2006). Additionally, stereotype threat (Frantz et al., 2004) was shown to affect IAT performance, most likely as control resources are used for emotion regulation, and are, hence, less available for the demanding classification task (cf. Johns, Inzlicht, & Schmader, 2008). To conclude, a number of situational factors as well as states within the person can affect WMC and control functions. However, according to most process accounts of the IAT, the incompatible block draws more heavily on executive control functions than does the compatible block. Because of this asymmetry, it is assumed that a depletion of control resources should have a more detrimental effect on the participant’s performance in the incompatible IAT block. The IAT effect, which is the performance difference between compatible and the incompatible IAT block, should therefore be increased, when control resources are depleted. The present study was designed to test this prediction by means of an experimental manipulation. We applied the dual-task paradigm (e.g., Baddeley, Emslie, Kolodny, & Duncan, 1998; Baddeley & Hitch, 1974) in order to investigate the effects of cognitive load on performance in the compatible and incompatible IAT phases, and on the resulting IAT effect. We are aware of one other study in which attention was depleted during IAT administration by means of a secondary task (Devine, Plant, Amodio, Harmon-Jones, & Vance, 2002, Exp. 3). In that study participants listened to an audio-taped stream of letters and were instructed to say ‘now’ whenever a ‘T’ was presented (which requires that only one active S-R rule is additionally activated). The authors report a main effect of attention depletion on both IAT blocks, but no information on a possible interaction effect of depletion and compatibility was provided. For our purposes, we needed a task that requires active and flexible manipulations of stimuli (like in the IAT), and thus draws more heavily on executive control functions while being applicable as a secondary task during IAT administration. Random number generation (RNG) Appeared to meet these requirements, as it has been postulated to draw heavily on executive functions (Baddeley et al., 1998; Towse, 1998). Dual-task studies have shown that RNG and other tasks known to tap executive functions mutually interfere and thus seem to share common resources. This was demonstrated, for example, for complex problem solving (Robbins et al., 1996), attention and timing (Brown, 2006), and – most importantly for the present study – for flexibly alternating between tasks (Baddeley et al., 1998, Exp. 5 and 6). RNG was found to impair performance in the primary tasks substantially, both in terms of latencies and errors, and this effect was robust throughout a series of test blocks. Another advantage of the RNG task is that a number of algorithms exist that can be used to assess different aspects of task performance in the secondary task (e.g., Attneave, 1959; Evans, 1978; the algorithms are described in more detail below).
106
Florian Schmitz et al.
Potential effects of cognitive load in the IAT A most important question is whether cognitive load taps the same processes as those relevant for the IAT effect. A number of alternative scenarios are possible: (1) if cognitive load has a symmetrical effect on performance in the compatible as well as the incompatible IAT phase, the IAT effect (the performance difference between both phases) would be largely unaffected; (2) if load has an asymmetrical effect on performance in both combined IAT phases, the IAT effect would be biased. For instance, if the load effect was more pronounced in the generally more difficult incompatible IAT phase, the IAT effect would be increased. If the load effect should contribute as an independent factor comparably across participants, it is even possible that IAT scores are shifted for the entire sample to a comparable extent, so that the rank order of participants’ scores remains largely unchanged; (3) in contrast, if the load manipulation has a moderating effect on the contribution to the IAT effect driven by attitude-incompatibility, scores of some participants would be shifted more strongly than those of others. In consequence, the rank order of participants’ IAT scores would be distorted. Aim of the study and predictions The present study was designed to test the impact of available control resources on IAT performance. In line with process accounts of the IAT, we assumed that additional cognitive load should compromise performance especially in the incompatible phase of an IAT, thereby leading to larger IAT effects. But as it is largely unknown how exactly cognitive load may exert its effect (either as an independent factor or as a moderating factor), it is an open question to what extent predictive validity of the IAT may be affected under load. For instance, cognitive load may generally shift the response time (RT) distribution or transform its shape (e.g., by increasing the proportion of outliers). Additionally, the perceived difficulty may affect the choice of speed–accuracy settings (for a discussion of factors that could contribute to group differences in reaction-time measures, see also Salthouse & Hedden, 2002). The issue is further complicated by the fact that different scoring algorithms are used in the IAT literature that differently weigh the available information in RTs and errors. In some scores, non-linear transformations or a calibration for individual variability are applied. Finally, one of the most striking differences between conventional latencybased IAT scores and the so-called D-scores is the choice of outlier criteria (details of the scoring algorithms will be provided in the methods section). Therefore, scores may differ in their susceptibility to the load manipulation. This may potentially affect their size, reliability, and predictive validity. So, in the present study we were particularly interested in whether different scoring algorithms are differently affected by the load manipulation. To test for possible effects on predictive validity, we decided to rely on self-reports as a validity criterion (cf. Hofmann, Gschwendner, Nosek, et al., 2005). Therefore, the domain of political attitudes seemed to be suitable, as there are usually moderate implicit–explicit correlations (Greenwald, Poehlman, Uhlmann, & Banaji, 2009), whereas correspondence of implicit and explicit attitudes can be poor in other domains (Perugini, 2005). Moderate correlations avoid ceiling or floor effects, and thus allow for possible moderator effects of cognitive load to emerge. Additionally, self-reported political attitude can serve as a good proxy variable of actual voting behaviour, as both are substantially inter-correlated (Roccato & Zogmaister, 2010).
When Scoring Algorithms Matter
107
Method Participants Participants were N = 120 volunteers (68 female) with a mean age of 24.0 years (SD = 5.5, range 18–44). Most of them were students with various majors who received € 3.50 or partial course credit as compensation.
Materials Description of political attitudes Political attitudes are usually referred to as ‘left’ or ‘right’. In the present study, the political dimensions were labelled red versus black to avoid spatial Simon effects (Simon, 1969; see also Hommel, 1998, for interference effects between response side and the oral response labels ‘left’ and ‘right’). The terms red and black are interchangeably used in Germany for the left and right political spectrum, respectively. All participants were presented with standardized descriptions of the red and black political attitude (see Klauer, Voss, Schmitz, & Teige-Mocigemba, 2007).
Self-report measures Three indicators of explicit political attitudes were obtained. First, participants were asked to indicate their political position on a 10-point scale (‘very black’ to ‘very red’). Second, two 10-point thermometer scales were presented that assessed how warm participants felt towards the red and black political spectrum; both ratings were transformed into a difference score (cf. Greenwald, Nosek, & Banaji, 2003). Third, valence of all red and black stimuli used in the IAT was rated on a 10-point scale. All three measures were z-transformed, and the average of the three z-scores was the explicit measure of political attitude (Cronbach‘s ␣ = .90). Political attitudes IAT Implicit political attitudes were assessed with an IAT designed to measure associations between a red and black political attitude and their respective evaluations. Examples of concept stimuli for the red political attitude included the German equivalents for ‘multicultural’, ‘ecology’, or ‘SPD’ (name of the major center-left party in Germany); stimuli for the black political spectrum included ‘authority’, ‘conservative’, or ‘CDU’ (name of the major center-right party in Germany). Examples for positive attribute stimuli were ‘joy’, ‘health’, and ‘gift’; examples for negative stimuli were ‘disaster’, ‘illness’, and ‘stink’ (see Klauer et al., 2007, for further details of the political attitudes IAT).
RNG Oral RNG was used as a secondary task. Participants were instructed to imagine that the numbers from one to nine were mixed in a bowl. They were to imagine of picking out one number, saying it aloud, and putting it back into the bowl. There was a 1-min exercise block prior to the IAT in which the secondary task was practiced alone. In this block, a ‘ + ’ sign was presented in the center of the screen every 2 s to indicate the pace at which participants were expected to produce a number. The generated random numbers were recorded during completion of the IAT blocks for later off-line analyses.
108
Florian Schmitz et al.
Procedure First, explicit attitudes were assessed. Then, both experimental groups engaged in the practice phase of RNG. Next, participants completed the political attitudes IAT. Demographic information was collected last. The order of explicit and implicit measures was kept constant across participants as previous studies did not find an effect of the order of questionnaires and IATs on the size of the implicit–explicit correlation (see Hofmann, Gawronski, et al., 2005, for a meta-analysis). Half of the sample executed the RNG task concurrently with the IAT administration (load condition), while the rest completed the IAT without secondary task (control group). RNG (load vs. control) and the order of concept category mappings in the IAT (red-positive first vs. black-positive first) were counterbalanced across participants. RNG in the load condition was only required in the combined IAT blocks. Unlike in the practice phase of RNG, there were no signs indicating pace of number production during the IAT, and instructions emphasized that the secondary task was less important than the IAT classifications.
Analyses RNG As trade-off effects between first and secondary task can compromise the interpretation of results, both speed and quality of RNG were analysed (cf. Jahanshahi, Saleem, Ho, Dirnberger, & Fuller, 2006). Speed was computed as the mean number of utterances per second. Quality was conceptualized as low redundancy of generated numbers. According to information theory (Attneave, 1959), first-order redundancy refers to a deviation from a uniform distribution of all digits. Second-order redundancy (Evans, 1978) refers to a deviation from a uniform distribution of pairwise digit transitions, indicative of chunking or repetition of digit sequences.
IAT scores IAT performance was also assessed in terms of mean latencies and of accuracy. Both bits of information are differentially weighted in alternative IAT scores. Three conventional scores (based on latencies, log-transformed latencies, and errors, respectively) as well as two so-called D-scores (D2, D6) were computed. In the following, the most important characteristics of these scores are described; further details can be obtained from Greenwald et al. (2003). For conventional latency-based scores, reaction times below 300 ms or above 3,000 ms were set to these boundaries. The latency score was computed as the mean difference in reaction times between the compatible and incompatible IAT condition. For the logarithmic score, all individual latencies were log-transformed before collapsing. This procedure is common practice in experimental research, and seeks to reduce the potential impact of a few long outliers that could otherwise bias the computation of arithmetic means. The error score was calculated as the difference of error rates between the compatible and incompatible IAT blocks. Possible effects in errors are informative, because they are the only information used by the influential Quad Model (Conrey et al., 2005; Sherman et al., 2008) to dissociate controlled and automatic influences in the IAT.
When Scoring Algorithms Matter
109
For D-scores, all trials with latencies outside the interval of 400–10,000 ms were excluded from the analyses. To cope with possible speed–accuracy trade-offs, D-scores transform latencies and errors into a common metric. For D2, latencies in erroneous trials are recorded to the time at which the correct response is given. For D6, a fixed error penalty of 600 ms is added to the mean latency of correct trials in the given block. D-scores are computed similar to Cohen’s measure of effect size d: Differences of the adapted latency scores between the compatible and incompatible IAT blocks (here referred to as the delta) are divided by the standard deviation of all trials in the combined blocks (referred to as the inclusive SD). All of these scores are frequently reported in the IAT literature. Latency and error information are non-redundant (as is obvious in case of speed–accuracy trade-offs). In addition to the score based on raw latencies, statistical tests are often reported for the more robust log-transformed measure. D2 is popular for its intuitive error penalty, whereas D6 can be conveniently computed even if correction times are not recorded. IAT effects may yield positive or negative values as a function of attitude. In the present study, IAT scores were transformed into absolute values whenever mere size of the effect was of interest. Only for implicit–explicit correlations, ‘raw’ IAT scores entered the analyses.
Results and Discussion Preliminary analyses None of our participants responded earlier than 300 ms after target onset in more than 10% of all trials, a criterion that was used to exclude participants who only seek to finish the experiment as soon as possible (cf. Greenwald et al., 2003). Most participants reported a preference for the red political spectrum (80.8% indicated their own political position on the red side of the 10-point scale), and a similar picture arose for implicit attitudes (87.1% of the latency-based and 76.7% of the error-based IAT effects). RNG performance of the load group was analysed separately for both IAT blocks. Compatibility of the IAT blocks was determined by self-reported political attitude, that is, by whether participants indicated their own political position to fall on the red or the black side of the political spectrum. The production speed in RNG was reduced in the incompatible relative to the compatible block as reflected in a lower production rate per second (.54 vs. .67, t(59) = 8.15, p < .001). Furthermore, the quality of random numbers produced was lower in the incompatible block both in terms of higher first-order redundancy (4.0 vs. 3.3, t(59) = 2.95, p < .01) and second-order redundancy (0.35 vs. 0.32, t(59) = 4.17, p < .001). The observed performance decrements in the secondary task were in the predicted direction, supporting the notion that the incompatible IAT phase is generally more resource-depleting than the compatible IAT phase. A related finding was that the RT distributions in the load group were generally shifted towards higher values. As a consequence, the proportion of slow responses meeting outlier criteria of conventional IAT scores was more than six times higher in the load group than in the control group (6.9% and 1.1%, respectively) – on average, but especially trials from the incompatible IAT phase were affected. As asymmetries in the proportion of trials receiving extreme-value treatment will also influence the size of the IAT score, we shifted the upper outlier criterion in the load group upwards so that an identical
110
Florian Schmitz et al.
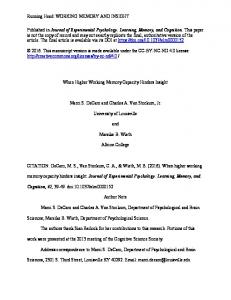
Relative Effect Size
2.5
CONT LOAD
2.0 1.5 1.0 0.5 0.0 LAT
LOG
ERR IAT scores
D2
D6
Figure 1. Changes in IAT scores as a function of cognitive load. IAT effects of the control group (CONT; black bars) are set at 1; for the load group (LOAD; white bars) relative changes are presented. Error bars indicate 1 SE.
proportion of outliers was excluded as in the control group (i.e., 1.1% at a fixed criterion of 5257 ms).1 In the following, we will report findings related to the two major questions raised in the present study: First, we will report to what extent the size of alternative IAT scores is affected by cognitive load. We will also present some additional analyses that will shed light on why certain scores were differently affected than others. Second, we will present findings concerning effects of cognitive load on reliability and validity of the alternative scores in terms of implicit–explicit correlations. Finally, we will briefly summarize findings from fine-grained analyses on the impact of including RT outliers on the validity of the alternative IAT scores. Size of the IAT scores As can be seen in Figure 1, cognitive load had an influence on the size of the IAT effect. Interestingly, the direction of the effect depended on the scoring algorithm. In line with predictions from process accounts of the IAT, load increased IAT effects for scores based on raw latencies [t(118) = 2.27, p < .05] as well as errors [t(118) = 3.71, p < .001]. Note that effects in the primary and in the secondary task had the same direction for participants in the load group, ruling out possible effects of a trade-off between both tasks. However, not all IAT scores were increased in the load group: The effect in the log-transformed latencies was descriptively reduced [t(118) = −1.11, p = .27], and there was a significant reduction for both D-scores [t(118) = −2.82, p < .01 for D2, t(118) = −2.97, p < .01 for D6]. To summarize, effects of cognitive load on the IAT vary in size and – contrary to our expectation – even in direction as a function of the scoring 1 We
also applied a number of alternative outlier criteria, such as treating the upper 5% of trials in both experimental groups as outliers, or variants of a criterion derived from the box-plots logic, according to which trials are identified as outliers that are more extreme than 1.5 or 3 times the inter-quartile range on top of the 75 percentile of the response time distribution (see Tukey, 1977, for details). Additionally, we also tested individual criteria that were adapted to the participants’ specific response time distributions following the above described outlier criteria. The pattern of significant findings was always identical. So, we chose the alternative described in the text in order to stay as close as possible to the original IAT scoring algorithm for the control group that completed the IAT under standard conditions and only adjusted criteria for the load group in order to avoid problems associated with asymmetric proportions of outliers.
When Scoring Algorithms Matter
111
algorithm applied. Two findings were striking and deserved further investigation: First, IAT scores based on raw latencies and on log-transformed latencies revealed a load effect in opposite direction (although insignificant for the log-transformed latencies), despite the fact that the same individual latencies were entered into the formulas of the two scores. Second, D-scores were shown to be decreased in the load condition while at the same time their constituents, raw latencies and errors, were increased. Explanations for both effects will be offered in the following. First, consider the discrepancy in the latency and log-latency scores. The logtransformation is a non-linear transformation that compresses latencies more strongly the longer they are. This is usually desirable in order to reduce the impact of a few exceptionally long latencies that would otherwise bias the computation of block means. However, in the present study, the entire RT distributions were shifted towards larger values (by about 500 ms) in the load group. As a consequence of the negative acceleration of the log-function, latencies of the load group were generally compressed more strongly than in the control group. This compression effect was even more pronounced in the slow incompatible IAT phase, thus resulting in smaller log-latency IAT scores in the load group. The decrease in the D-scores under load deserves further investigation, because the D-scores algorithms only use information from non-transformed latencies in correct trials (in about 95% of all trials) and additionally some information from error trials. In fact, both latency and error IAT scores were shown to be increased under cognitive load. Recall that the D-scores differ in three important aspects from the conventional scores that could potentially account for the observed differences: (1) There is a different outlier treatment in the D-scores: the upper criterion is more extreme, and outliers are excluded, not set to the boundaries. (2) The D-scores integrate information from latencies and errors into a common metric (the delta), seeking to reduce possible speed–accuracy trade-offs. (3) Finally, an individual variability calibration (division by the inclusive SD) is applied in the D-scores. (1) The outlier treatment was shown not to cause the inversion of the IAT effect between both groups. When we applied conventional outlier criteria, both D-scores were also found to be reduced in size in the load condition [t(118) = 2.59, p < .05 for D2; t(118) = 3.54, p < .01 for D6]. (2) All D-scores integrate information from latencies and errors into a common metric. They only differ in how exactly information from both sources of raw performance data is used. We found convergent evidence of an increase in the deltas according to both, the D2 and the D6 scoring algorithms [t(118) = 2.08 p < .05 and t(118) = 2.56 p < .05, for D2 and D6, respectively, see Figure 2] prior to the individual variability calibration. So, irrespective of the actual weighting of available performance data, findings in the deltas confirmed the increase in the IAT score under load in line with what was found for the latency and the error score. (3) However, at the same time, cognitive load strongly increased the inclusive SD [t(118) = 2.19, p < .05], and this increase was far more pronounced than the one observed in the deltas: Cognitive load increased the deltas by the factor 1.8 (D2) and 1.5 (D6), but it increased the inclusive SD by the factor 2.8. As a consequence the resulting D-scores were significantly reduced under cognitive load, despite the fact that latency and error effects were both increased. So in terms of absolute effects, the division by the inclusive SD seems to be an over-correction, because it completely inverts the direction of the load effect as compared to the raw data of task performance that are entered into the deltas according to the D2 or D6 algorithms.
112
Florian Schmitz et al. CONT LOAD Relative Effect Size
3.0
2.0
1.0
0.0 Score
Delta D2
SD
Score
Delta D6
SD
Figure 2. D scores and their constituents as a function of cognitive load. D scores are decomposed into their constituents: Delta refers to the difference in performance between compatible and incompatible IAT blocks according to the D2 and D6 scoring algorithms, respectively. Delta is entered as the numerator into the D-score formula. SD stands for the inclusive standard deviation of all trials from the compatible and incompatible IAT blocks that is used as a denominator in the formula. Scores and their constituents of the control group (CONT, black bars) are set at 1; relative changes are presented for the load group (LOAD; white bars). Error bars indicate 1 SE.
To conclude, the above described findings highlight that some of the IAT scores frequently reported in the IAT literature are differently susceptible to cognitive load during IAT administration. Scores based on raw performance data were found to be increased under load, whereas the D-scores were reduced after applying the individual variability calibration. These findings point to two important caveats when interpreting IAT scores, particularly when individual differences are to be inferred (rather than patterns of covariance in a sample). First, cognitive load can increase or decrease the absolute size of an IAT score, depending on the choice of the scoring algorithm. This should be taken into consideration when means of IAT effects are compared across studies in which different IAT scores are reported or in which populations are investigated that may differ in cognitive control functions. Second, even when cognitive load can be assumed to be comparable across participants, it may generally shift the level of the IAT effects. Hence, the absolute size of the IAT effect is difficult to interpret (see also Fiedler, Messner, & Bluemke, 2006), but individual differences may still be predictive in this case.
Reliability and validity of the IAT scores The other major concern of the present study was to address the question to what extent cognitive load during IAT administration can affect reliability and predictive validity of the IAT scores. Findings concerning both aspects are graphically depicted in Figure 3 (internal consistencies in the upper panel, implicit–explicit correlations in the lower panel). As can be seen, IAT scores were reliable to the extent that is usually observed for the respective scores. Internal consistencies of both latency-based conventional scores were as high as those obtained for the two D-scores, and all can be considered highly satisfactory. Importantly, reliabilities were only marginally smaller in the load group than
Relability (Cronbach’s Alpha)
When Scoring Algorithms Matter
113
CONT LOAD
1.00 0.80 0.60 0.40
Implicit–Explicit Correlation (r)
0.20 0.60
0.40
0.20
0.00 LAT
LOG
ERR
D2
D6
IAT scores
Figure 3. Reliability and validity of IAT scores as a function of cognitive load. Internal consistencies (Cronbach’s Alphas) based on six ‘parcels’ of 12 trials each are given in panel 1 for the five investigated IAT scores. Corresponding correlation coefficients of the implicit–explicit relationship are displayed below in panel 2. The height of the bars corresponds with the size of the consistencies and correlation coefficients. Results are displayed for the IAT scores based on raw latencies (LAT), on log-transformed latencies (LOG), and on errors (ERR), as well as for two D scores (D2, D6). Results are displayed separately for the control group (CONT; black bars) and the load group (LOAD; white bars).
in the control group. Note that for the usually less-reliable error score, Cronbach’s alpha more than doubled in the load group as compared to the control group. Validity of the IAT scores was conceptualized as the implicit–explicit correlation at the same measurement occasion (i.e., concurrent validity; see Greenwald et al., 2009; Roccato & Zogmaister, 2010, for the adequacy of self-reports in the domain of political attitudes). It turned out that for the control group, virtually all scores had moderate- to medium-sized correlations (see Figure 3), ranging from a notable correlation of r = .40 for the error-based score to a substantial correlation of r = .62 for the D2-score. Correlations obtained for the latency-based conventional scores were only slightly smaller (r = .54 for log-transformed latencies) than those for the D-scores. Importantly, cognitive load had hardly any effect on the validity of the IAT score: Implicit–explicit correlations within the load group were highly comparable with those obtained within the control group (formal tests of significant differences are given in Appendix). Descriptively, correlation coefficients were even higher for the load group in case of latency-based conventional scores, whereas correlations for the D-scores were
114
Florian Schmitz et al.
slightly reduced in the load group. Interestingly, the error score was far less valid in the load group even though its size and reliability was substantially increased. The pattern can be most parsimoniously accounted for by a contribution of a cognitive factor that confounds the IAT score (e.g., Klauer et al., 2010; McFarland & Crouch, 2002) and which exerts a two-sided effect: On the one hand, it adds systematic variance that increases the size and the reliability of the IAT score. On the other hand, it decreases its predictive validity. In contrast, latency-based IAT scores were found largely unaffected by the load manipulation in terms of reliabilities and correlations – despite the fact that latency-based IAT scores were generally increased in the load group. The latter finding indicates that cognitive load must have an asymmetric effect on task performance in the compatible and incompatible IAT phases. Therefore, the overall pattern of findings can be best reconciled with the view that cognitive load imposed an asymmetrical shift in the RT distributions that was generally more pronounced in the incompatible IAT phase than in the compatible IAT phase. However, this shift seems to have been relatively homogenous across participants, as it apparently did not distort participants’ rank order of IAT effects. Additionally, cognitive load was not found to have a moderating effect on the implicit–explicit relationship.2 Following additive factors logic (Sternberg, 1969, 1998), this indicates that cognitive load does not distort the specific mechanism that drives the attitude-related IAT effect. This may imply that RNG taps a control system different from that relevant in the generation of the IAT effect. Alternatively, it could mean that both tasks tap the same mechanism, but that they do so sequentially and therefore impose independent effects.
How D-scores may cope with a cognitive skill confound It is noteworthy that D-scores were found highly predictive of explicit attitudes, because according to their algorithms quite extreme non-transformed latencies (of up to 10,000 ms) are included in the score. In fact, applying the same outlier criterion to conventional latency-based IAT scores descriptively reduces their correlation coefficients by about 13 points in the load group and by about four points in the control group. The same was found for the deltas of both D-scores: When the upper outlier criterion was increased from 3,000 ms to the 10,000 ms, the correlation coefficients dropped by about 10 points in both groups, resulting in correlation coefficients in the order of .4. This means when the usual outlier criteria for D-scores are employed, the correlation coefficients for the deltas are about 20 points lower than those of the final D-scores when the individual variability calibration is applied. This suggests that the D-scores’ predictive superiority is not grounded in the integration of latencies and errors into a common metric (which is already done in the deltas). Instead, it seems to be that the D-scores especially profit
2 We
conducted a series of moderated regression analyses: (1) with the different IAT scores as the dependent variable and explicit attitude ratings as the predictor, and cognitive load as a binary (between groups) moderator factor. Results conceptually confirmed findings obtained in the previous analyses: There was always a clear main effect of explicit attitude, there was usually a main effect of the cognitive load factor (with the exception of the analyses of the log-transformed latency score), but never was there any interaction effect between both factors. (2) Next, we computed a number of moderated regressions within the RNG group, with explicit attitude as the dependent variable. As predictors, we entered the different IAT scores, mean redundancy in the RNG task during IAT blocks and their interaction as predictors (independently for all combinations of the five IAT scores and both redundancy scores). In none of these analyses was the implicit–explicit relationship moderated by redundancy in the RNG task.
When Scoring Algorithms Matter
115
from the division by the inclusive SD (which is the only difference between the deltas and the final D-scores). The following paragraphs seek to shed light on why dividing the deltas by the inclusive SD might improve validity of the D-scores. First, we will focus briefly on characteristics of the reaction time distribution and their relationships with cognitive abilities. Then, we will return to the computation of the D-scores and how they may cope with a cognitive skill confound. The relation of mean RT, SD, and cognitive ability RT distributions in psychological tasks usually share a number of characteristics: they are skewed to the right, the skew increases as a function of task difficulty, and the spread increases with the mean (Ratcliff, 2002; Wagenmakers & Brown, 2007). Interestingly, in a number of psychological classification tasks, the standard deviation was shown to possess a clear linear relationship with the arithmetic mean (r ≈ .9; Wagenmakers & Brown, 2007). In part, long latencies in the right tail of the RT distribution may contribute to that finding: a pronounced positive skew in the RT distribution will simultaneously increase its SD and its arithmetic mean, thus contributing to their correlation. Individual differences in control functions as well as situational depletion of control functions can affect the proportion of long outliers as explained in the following. For instance, lapses in attention are likely to contribute to slow latencies and errors. Lapses were theoretically explained in terms of failures of controlled attention, that is, the inability to maintain information active in the presence of interference (Kane & Engle, 2002), or in terms of a neglect of the task goal (Duncan, Emslie, Williams, Johnson, & Freer, 1996). Related to both, the role of temporary relational representations was stressed (Wilhelm & Oberauer, 2006). In fact, the ability to establish, maintain, and shield temporary S-R bindings was made responsible for the observed correlations between WMC, fluid intelligence, and choice RT in paradigms with arbitrary response mappings (Wilhelm & Oberauer, 2006). Note that lapses in attention would increase the right tail of the RT distribution. In fact, when decomposing the reaction time distributions into a number of underlying parameters, especially parameters reflecting the right tail of the latency distribution were shown to be selectively related to WMC and fluid intelligence (Schmiedek, Oberauer, Wilhelm, Suess, & Wittmann, 2007). These results are well in line with the so-called worst performance rule that describes the replicated finding that mental ability correlates more highly with slow than with fast latencies (Larson & Alderton, 1990; see also Coyle, 2003, for a review). Rationale of the D-score fraction As turned out in the previously reported analyses, the D-scores’ deltas were still affected by the inclusion of long latencies. Only when they were divided by the inclusive SDs, they retained their predictive validity. Given that cognitive lapses or cognitive failures contribute to long latencies, they will simultaneously bias means and SDs, thereby contributing to a correlation of the latter. Therefore, individual standard deviations may serve as predictors of cognitive failures and thereby help estimate to which extent the arithmetic means are inflated by cognitive failures. In turn, dividing the means by the SDs may statistically remove the extent to which the mean was inflated by cognitive failures.
116
Florian Schmitz et al.
In the D-score fraction, the delta is divided by the inclusive SD as an ‘individualvariability calibration’ (Greenwald et al., 2003). As the inclusive SD is computed on the bases of trials from both IAT conditions, the D-divisor is directly related to the size of the difference between IAT conditions (the larger the difference, the larger SD). Implicitly, the assumption seems to be made that the larger the IAT effect, the higher the cognitive confound that needs to be removed. An alternative or complementary explanation why the D-score treatment improves implicit–explicit correlations may be that it functions like an ipsatization. This treatment is used in psycholexical personality research to remove the impact of individual differences in the idiosyncratic use of rating scales (Ten Berge, 1999). In the IAT, it would transform the compatibility effect across participants onto a common metric by eliminating individual differences in the strength of the compatibility effect.3 Of course, this view can be reconciled with the suggested notion that the D-score treatment removes individual differences unrelated to the attitude-related effect. In any case, the D-score treatment was empirically supported in the large-scale correlative studies reported by Greenwald and colleagues (2003). These results are complemented by the findings obtained in the present study in which it was shown that the beneficial effects of the variability calibration are also present when the IAT is administered under load conditions: The division by the inclusive SD was shown to work comparably well under heavy cognitive load as well as a standard assessment condition, making it appear like a treatment that proves suitable to IAT data collected in a range of different assessment situations.
General Discussion The present study investigated the impact of situational load on IAT performance. Executive functions were experimentally depleted with a RNG task during IAT administration. Raw performance data As predicted by process accounts of the IAT, a situational depletion of executive control resources led to performance decrements, especially in the incompatible IAT phase. This effect occurred both in raw latencies and errors. Performance decrements under load were also observed in the deltas of the D-scores that use alternative ways to integrate information from both sources of raw performance data (latencies and errors) into a common metric. The results of the present study thereby contribute to the evidence that available control resources have an impact on IAT scores. This may equally hold for individual differences in executive control as well as for the indirect effects of situational states such as ego depletion or stereotype threat mediated by their impact on executive resources.
3 We
thank one of the anonymous reviewers for pointing this out and for suggesting how to partly test an account on the basis of ipsatization against one on the basis of removing a cognitive confound: In particular, the cognitive failures account predicts that failures increase errors as well as response times, and that implicit–explicit correlations are reduced in case of increased cognitive failures. In order to test this prediction, we computed a moderated regression analysis with explicit attitude as the dependent variable, the latency-based IAT effect as a predictor, and mean number of errors as a moderator. In support of the cognitive failures account, we found that the implicit–explicit correlation was reduced when error frequency was high. The moderation effect was significant in the load group in which cognitive failures should be more likely because of the higher task load, but it was not significant in the control group.
When Scoring Algorithms Matter
117
Scores using transformations In contrast, IAT effects were decreased in the load group when non-linear transformations were applied to the raw data in order to control for the impact of extreme values, as done in the log-transformation or when applying the individual variability calibration of the D-score algorithm. For the log-transformed scores, an explanation based on the generally slowed reaction times under load and their non-linear transformation was suggested. The demanding RNG secondary task shifted the whole RT distribution upwards. Because of the negatively accelerated log-function, individual latencies were more strongly compressed, especially in the slower incompatible block. The decreases in the D-scores were explained by a differential impact of load on both constituents of the D-score fraction. Whereas the difference between IAT conditions (the deltas) showed the predicted significant increase (in line with latencies and errors), the increase in the inclusive SDs used as divisors was by far more pronounced. As a result, the final D-scores were decreased in the load condition. No effects on correlations Implicit–explicit correlations were in the range of what is typically found in the domain of political attitudes (cf. Greenwald et al., 2009; Klauer et al., 2007). More importantly, for the latency-based as well as D-scores it turned out that neither reliabilities nor correlations with explicit scores were affected by cognitive load. This seems to imply that the experimental load manipulation apparently did not distort the rank order of participants’ IAT scores within experimental groups. The results seem to indicate that IATs can be comparably predictive when the entire sample is collected under ‘aversive’ test conditions, such as in a noisy or distracting environment or in the form of group testing. As it turned out in the present analyses, D-scores profited especially from the division by the inclusive SD that was what made them as robust as they are in face of outliers. The effect of RNG It is noteworthy that cognitive load had an effect on the size of the IAT score on the group level while the scores retained predictive validity within groups. These findings imply that (1) RNG has differential effects on both combined IAT phases, leading to more pronounced impairments in the incompatible condition, as indicated by the raw performance data. (2) However, the effect of load seems to cause a general shift in RTs that does not distort the rank order of participants’ IAT scores. This can be inferred from the absence of a group difference in implicit–explicit correlations as well as from the absence of a moderation effect by RNG group as a moderator in the additionally conducted regression analyses. Following additive factors logic (Sternberg, 1969, 1998), this implies that both effects contribute to the IAT effect independently of each other. RNG therefore seems to affect processes that contribute to the size of the IAT score, but it does not seem to tap the specific locus relevant for attitude-related effects. Conclusion Available control resources can affect both explicit as well as implicit attitude measures (Fazio & Olson, 2003; Hofmann, Gschwendner, et al., 2005; Ranganath et. al., 2008). The present study provides evidence for control requirements in the IAT that are particularly pronounced in the incompatible IAT phase (Klauer et al., 2010; McFarland & Crouch, 2002): A situational load manipulation led to more pronounced increases in latencies and errors in the incompatible IAT phase. IAT scores that directly use these raw
118
Florian Schmitz et al.
data of task performance were increased, whereas scores in which transformations are employed were found to be decreased under load. However, reliabilities of the scores and their correlations with explicit attitude ratings remained unaffected by the load manipulation. Findings in the present study can be best reconciled with the interpretation that the RNG task successfully depleted cognitive control functions (see also Baddeley et al., 1998; Towse, 1998). This led to an upward shift of the latencies in the incompatible IAT phase. This effect was rather independent of and did not distort the attitude-driven contribution to the IAT effect. Results further suggest that the IAT is a relatively robust measure of attitudes that retains its predictive validity even when assessment takes place under aversive (resource depleting) conditions.
Acknowledgements The research reported in this paper was supported by grants Kl 617/29–2 and Kl 614/31–1 from the Deutsche Forschungsgemeinschaft to Karl Christoph Klauer.
References Attneave, F. (1959). Applications of information theory to psychology: A summary of basic concepts, methods, and results. Oxford, England: Henry Holt. Back, M., Schmukle, S., & Egloff, B. (2005). Measuring task-switching ability in the Implicit Association Test. Experimental Psychology, 52(3), 167–179. doi:10.1027/1618-3169.52.3.167 Baddeley, A. D., Emslie, H., Kolodny, J., & Duncan, J. (1998). Random generation and the executive control of working memory. The Quarterly Journal of Experimental Psychology A: Human Experimental Psychology, 51A(4), 819–852. Baddeley, A. D., & Hitch, G. J. (1974). Working memory (Vol. 8). New York: Academic Press. doi:10.1016/S0079-7421(08)60452-1 Baumeister, R. F. (2002). Ego depletion and self-control failure: An energy model of the self’s executive function. Self and Identity, 1(2), 129–136. doi:10.1080/152988602317319302 Brown, S. W. (2006). Timing and executive function: Bidirectional interference between concurrent temporal production and randomization tasks. Memory & Cognition, 34(7), 1464– 1471. doi:10.3758/BF03195911 Conrey, F. R., Sherman, J. W., Gawronski, B., Hugenberg, K., & Groom, C. J. (2005). Separating multiple processes in implicit social cognition: The Quad model of implicit task performance. Journal of Personality and Social Psychology, 89(4), 469–487. doi:10.1037/0022-3514.89.4. 469 Coyle, T. R. (2003). A review of the worst performance rule: Evidence, theory, and alternative hypotheses. Intelligence, 31(6), 567–587. doi:10.1016/S0160-2896(03)00054-0 Devine, P. G., Plant, E. A., Amodio, D. M., Harmon-Jones, E., & Vance, S. L. (2002). The regulation of explicit and implicit race bias: The role of motivations to respond without prejudice. Journal of Personality and Social Psychology, 82(5), 835–848. doi:10.1037//0022-3514.82.5.835 Duncan, J., Emslie, H., Williams, P., Johnson, R., & Freer, C. (1996). Intelligence and the frontal lobe: The organization of goal-directed behavior. Cognitive Psychology, 30(3), 257– 303. doi:10.1006/cogp.1996.0008 Evans, F. J. (1978). Monitoring attention deployment by random number generation: An index to measure subjective randomness. Bulletin of the Psychonomic Society, 12(1), 35–38. Eysenck, M. W. (1985). Anxiety and cognitive-task performance. Personality and Individual Differences, 6(5), 579–586. doi:10.1016/0191-8869(85)90007-8 Eysenck, M. W., Derakshan, N., Santos, R., & Calvo, M. G. (2007). Anxiety and cognitive performance: Attentional control theory. Emotion, 7(2), 336–353. doi:10.1037/1528-3542.7.2.336
When Scoring Algorithms Matter
119
Fazio, R. H., & Olson, M. A. (2003). Implicit measures in social cognition research: Their meaning and uses. Annual Review of Psychology, 54, 297–327. doi:10.1146/annurev.psych.54.101601. 145225 Fiedler, K., Messner, C., & Bluemke, M. (2006). Unresolved problems with the ‘I’, the ‘A’, and the ‘T’: A logical and psychometric critique of the Implicit Association Test (IAT). European Review of Social Psychology, 17, 74–147. doi:10.1080/10463280600681248 Frantz, C. M., Cuddy, A. J. C., Burnett, M., Ray, H., & Hart, A. (2004). A threat in the computer: The race Implicit Association Test as a stereotype threat experience. Personality and Social Psychology Bulletin, 30(12), 1611–1624. doi:10.1177/0146167204266650 Gawronski, B., Deutsch, R., LeBel, E. P., & Peters, K. R. (2008). Response interference as a mechanism underlying implicit measures: Some traps and gaps in the assessment of mental associations with experimental paradigms. European Journal of Psychological Assessment, 24(4), 218–225. doi:10.1027/1015-5759.24.4.218 Govorun, O., & Payne, B. K. (2006). Ego-depletion and prejudice: Separating automatic and controlled components. Social Cognition, 24(2), 111–136. doi:10.1521/soco.2006.24.2.111 Greenwald, A. G., McGhee, D. E., & Schwartz, J. L. K. (1998). Measuring individual differences in implicit cognition: The Implicit Association Test. Journal of Personality & Social Psychology, 74(6), 1464–1480. doi:10.1037//0022-3514.74.6.1464 Greenwald, A. G., Nosek, B. A., & Banaji, M. R. (2003). Understanding and using the Implicit Association Test: I. An improved scoring algorithm. Journal of Personality & Social Psychology, 85(2), 197–216. doi:10.1037/0022-3514.85.2.197 Greenwald, A. G., Poehlman, T. A., Uhlmann, E., & Banaji, M. R. (2009). Understanding and using the Implicit Association Test: III. Meta-analysis of predictive validity. Journal of Personality and social Psychology, 97(1), 17–41. doi:10.1037/a0015575 Hillier, A., Alexander, J. K., & Beversdorf, D. Q. (2006). The effect of auditory stressors on cognitive flexibility. Neurocase, 12(4), 228–231. doi:10.1080/13554790600878887 Hofmann, W., Gawronski, B., Gschwendner, T., Le, H., & Schmitt, M. (2005). A Meta-Analysis on the correlation between the Implicit Association Test and explicit self-report measures. Personality and Social Psychology Bulletin, 31(10), 1369–1385. doi:10.1177/0146167205275613 Hofmann, W., Gschwendner, T., Nosek, B. A., & Schmitt, M. (2005). What moderates implicitexplicit consistency? European Review of Social Psychology, 16, 335–390. doi:10.1080/ 10463280500443228 Hofmann, W., Gschwendner, T., & Schmitt, M. (2005). On implicit-explicit consistency: The moderating role of individual differences in awareness and adjustment. European Journal of Personality, 19(1), 25–49. doi:10.1002/per.537 Hommel, B. (1998). Automatic stimulus-response translation in dual-task performance. Journal of Experimental Psychology: Human Perception and Performance, 24(5), 1368–1384. doi:10. 1037//0096-1523.24.5.1368 Jahanshahi, M., Saleem, T., Ho, A. K., Dirnberger, G., & Fuller, R. (2006). Random number generation as an index of controlled processing. Neuropsychology, 20(4), 391–399. doi:10.1037/0894-4105.20.4.391 Johns, M., Inzlicht, M., & Schmader, T. (2008). Stereotype threat and executive resource depletion: Examining the influence of emotion regulation. Journal of Experimental Psychology: General, 137(4), 691–705. doi:10.1037/a0013834 Kane, M. J., & Engle, R. W. (2002). The role of prefrontal cortex in working-memory capacity, executive attention, and general fluid intelligence: An individual-differences perspective. Psychonomic Bulletin & Review, 9(4), 637–671. doi:10.3758/BF03196323 Klauer, K. C., & Mierke, J. (2005). Task-set inertia, attitude accessibility, and compatibility-order effects: New evidence for a task-set switching account of the Implicit Association Test effect. Personality and Social Psychology Bulletin, 31(2), 208–217. doi:10.1177/0146167204271416 Klauer, K. C., Schmitz, F., Teige-Mocigemba, S., & Voss, A. (2010). Understanding the role of executive control in the Implicit Association Test: Why flexible people have small IAT effects. Quarterly Journal of Experimental Psychology, 63(3), 595–619. doi:10.1080/17470210903076826
120
Florian Schmitz et al.
Klauer, K. C., Voss, A., Schmitz, F., & Teige-Mocigemba, S. (2007). Process components of the Implicit Association Test: A diffusion-model analysis. Journal of Personality and Social Psychology, 93(3), 353–368. doi:10.1037/0022-3514.93.3.353 Larson, G. E., & Alderton, D. L. (1990). Reaction time variability and intelligence: A ‘worst performance’ analysis of individual differences. Intelligence, 14(3), 309–325. doi:10.1016/ 0160-2896(90)90021-K Matthews, G., & Campbell, S. E. (2010). Dynamic relationships between stress states and working memory. Cognition and Emotion, 24(2), 357–373. doi:10.1080/02699930903378719 McFarland, S. G., & Crouch, Z. (2002). A cognitive skill confound on the Implicit Association Test. Social Cognition, 20(6), 483–510. doi:10.1521/soco.20.6.483.22977 Mierke, J., & Klauer, K. C. (2001). Implicit association measurement with the IAT: Evidence for effects of executive control processes. Zeitschrift f¨ ur Experimentelle Psychologie, 48(2), 107–122. doi:10.1026//0949-3946.48.2.107 Mierke, J., & Klauer, K. C. (2003). Method-specific variance in the Implicit Association Test. Journal of Personality and Social Psychology, 85(6), 1180–1192. doi:10.1037/0022-3514.85.6.1180 Perugini, M. (2005), Predictive models of implicit and explicit attitudes. British Journal of Social Psychology, 44, 29–45. doi:10.1348/014466604X23491 Ranganath, K. A., Smith, C. T., & Nosek, B. A. (2008). Distinguishing automatic and controlled components of attitudes from direct and indirect measurement methods. Journal of Experimental Social Psychology, 44(2), 386–396. doi:10.1016/j.jesp.2006.12.008 Ratcliff, R. (2002). A diffusion model account of response time and accuracy in a brightness discrimination task: Fitting real data and failing to fit fake but plausible data. Psychonomic Bulletin & Review, 9(2), 278–291. doi:10.3758/BF03196283 Robbins, T. W., Anderson, E. J., Barker, D. R., Bradley, A. C., Fearneyhough, C., Henson, R., (1996). Working memory in chess. Memory & Cognition, 24(1), 83–93. doi:10.3758/BF03197274 Roccato, M., & Zogmaister, C. (2010). Predicting the vote through implicit and explicit attitudes: A field research. Political Psychology, 31(2), 249–274. doi:10.1111/j.1467-9221.2009.00751.x Salthouse, T. A., & Hedden, T. (2002). Interpreting reaction time measures in between-group comparisons. Journal of Clinical and Experimental Neuropsychology, 24(7), 858–872. doi:10.1076/jcen.24.7.858.8392 Schmiedek, F., Oberauer, K., Wilhelm, O., Suess, H.-M., & Wittmann, W. W. (2007). Individual differences in components of reaction time distributions and their relations to working memory and intelligence. Journal of Experimental Psychology: General, 136(3), 414–429. doi:10. 1037/0096-3445.136.3.414 Sherman, J. W., Gawronski, B., Gonsalkorale, K., Hugenberg, K., Allen, T. J., & Groom, C. J. (2008). The self-regulation of automatic associations and behavioral impulses. Psychological Review, 115(2), 314–335. doi:10.1037/0033-295X.115.2.314 Simon, J. R. (1969). Reactions toward the source of stimulation. Journal of Experimental Psychology, 81(1), 174–176. doi:10.1037/h0027448 Steinhauser, M., Maier, M., & H¨ ubner, R. (2007). Cognitive control under stress: How stress affects strategies of task-set reconfiguration. Psychological Science, 18(6), 540–545. doi:10.1111/j. 1467-9280.2007.01935.x Sternberg, S. (1969). The discovery of processing stages: Extensions of Donder’s method. Acta Psychologica (Amsterdam), 30, 276–315. doi:10.1016/0001-6918(69)90055-9 Sternberg, S. (1998). Discovering mental processing stages: The method of additive factors. In D. Scarborough & S. Sternberg (Eds.), Methods, models, and conceptual issues: An invitation to cognitive science (Vol. 4, pp. 703–863). Cambridge, MA: The MIT Press. Ten Berge, J. M. F. (1999). A legitimate case of component analysis of ipsative measures, and partialling the mean as an alternative to ipsatization. Multivariate Behavioral Research, 34, 89–102. doi:10.1207/s15327906mbr3401 4 Towse, J. N. (1998). On random generation and the central executive of working memory. British Journal of Psychology, 89(1), 77–101. doi:10.1111/j.2044-8295.1998.tb02674.x Tukey, J. W. (1977.) Exploratory data analysis. Reading, MA: Addison-Wesley.
When Scoring Algorithms Matter
121
Wagenmakers, E.-J., & Brown, S. (2007). On the linear relation between the mean and the standard deviation of a response time distribution. Psychological Review, 114(3), 830–841. doi:10. 1037/0033-295X.114.3.830 Wilhelm, O., & Oberauer, K. (2006). Why are reasoning ability and working memory capacity related to mental speed? An investigation of stimulus-response compatibility in choice reaction time tasks. European Journal of Cognitive Psychology, 18(1), 18–50. doi:10.1080/ 09541440500215921 Received 15 December 2010; revised version received 14 June 2011
Appendix Means, standard deviations, and correlations of the IAT scores Score intercorrelations
Score LAT –Comp –Incomp –Score LOG –Comp –Incomp –Score ERR –Comp –Incomp –Score D2 –Delta –iSD –Score D6 –Delta –iSD –Score
IE Correlation
LAT
LOG
ERR
D2
CONT/ LOAD
CONT/ LOAD
CONT/ LOAD
CONT/ LOAD
M
SD
CONT/ LOAD
CONT/ LOAD
CONT/ LOAD
Z
p
735/1267 1027/1641 291/374
174/320 315/496 259/438
.47/.48
−0.07
.94
6.53/7.03 6.83/7.27 0.31/0.24
0.19/0.25 0.27/0.30 0.25/0.27
.55/.59
−0.32
.75
.96/.96
4.3/9.6 7.1/16.5 2.8/6.9
3.5/3.5 4.8/4.8 4.5/4.5
.40/.14
1.51
.13
.42/.15
.43/.15
364/629 461/1281 0.71/0.50
347/1163 237/2890 0.54/0.47
.64/.62
0.18
.86
.85/.80
.95/.88
.47/.37
371/509 461/1281 0.73/0.51
333/543 237/2890 0.54/0.46
.62/.61
0.09
.93
.84/.75
.93/.83
.48/.41
.99/.97
Note. Means, standard deviations, and correlations of the alternative IAT scores (LAT, LOG, ERR, D2, D6), separate for the control group (CONT) and for the load group (LOAD); Comp, compatible block; Incomp, incompatible block; Delta, numerator of the D-score fraction; iSD, inclusive standard deviation ( = denominator of the D-score fraction); Score, final IAT score; IE correlation, implicit– explicit correlation; Z, Fischer’s Z of the test of difference between correlation coefficients of the two groups; p, corresponding significance.