The high-temperature face- centered-cubic (fcc) δ-phase of plutonium can be retained to room temperature by the addition of a few atomic percent gallium.
Where Is the Gallium? Searching the plutonium lattice with XAFS Steven D. Conradson
T
he high-temperature facecentered-cubic (fcc) δ-phase of plutonium can be retained to room temperature by the addition of a few atomic percent gallium. Through processing, metallurgists can even control the overall distribution of the gallium within the parent plutonium metal to create alloys with desirable properties. Undoubtedly, the local distribution of the gallium, that is, the specific location of the gallium within the plutonium lattice, affects the delicate stability of the δ-phase as well as its transformation behavior to the low temperature monoclinic phase. However, we do not know where the gallium is located in the fcc lattice, nor do we know how it moves within the lattice as the material ages or as 356
it is subjected to other external influences. Moreover, we do not know where the gallium is trapped when the fcc lattice transforms into the monoclinic lattice or how it subsequently migrates. Because it provides a picture of the average structure of the coherent portions of crystalline materials, x-ray diffraction (XRD) has been the principal tool for studying plutonium solids. The extent of atomic displacements from ideal lattice sites is contained in the diffuse background, however, and is more difficult to analyze quantitatively. Thus, conventional laboratory-based XRD analysis cannot provide a detailed picture of local structure. With the availability of x-rays from synchrotron light sources, however, it is possible to study
the local structure surrounding atoms using x-ray absorption fine structure (XAFS) spectroscopy. For XAFS, the sample is probed with x-rays that are tuned to measure the absorption spectrum of the sample, typically from the energy of a core electron shell in the element of interest to approximately 1000 electron volts (eV) above it. A core electron in a target atom can absorb the x-ray energy and get liberated, but the probability that it does so depends on several factors, including the position, type, and number of nearby atoms, as well as the energy of the incoming x-rays. Thus, the x-ray absorption spectrum contains encoded information about the local environment, and precise measurement of the spectrum allows us to extract the distances between Los Alamos Science Number 26 2000
XAFS of Plutonium Gallium (wt %) 800
0
1
640
4
(b) 4.75
L+η η
ε
600
3 L
L+ε
700
Temperature (°C)
2
Am
ζ+η
ε+δ
500 483 463
δ′
δ′ + δ
δ + Pu3Gacubic
400 320
δ
300 γ+δ
215
200
4.65
4.60 Ve
ga
δ + Pu3Gatetragonal
β+δ
rd
's
fo
rG
a
α+δ 4.50
0
la
w
4.55
Ga
100
Ce
Al
125
4.70
Lattice constant (Å)
(a)
2
4
6 8 10 Gallium (at. %)
12
14
0
10
Pu3Ga
20 Atomic solute (%)
30
40
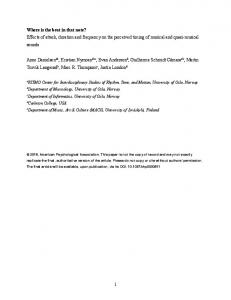
Figure 1. Plutonium-Gallium Alloys (a) Additions of very small amounts of gallium (between about 2 and 9 at. %) to plutonium metal stabilize the fcc δ-phase to room temperature. (b) The additions alter the size of the fcc-lattice. Gallium is smaller than plutonium, and the lattice parameter decreases with gallium concentration. The scaling is at odds with Vegard’s law, which assumes that solute atoms substitute in an ideal manner within the metal lattice. Aluminum additions also shrink the fcc δ-phase lattice, whereas additions of americium or cerium cause it to expand.
the absorber and its near-neighbor atoms. By tuning the x-ray energy, we can obtain this information for any element in the sample. In contrast to the difficulties of analyzing the diffuse x-ray scattering component of XRD, XAFS is well suited for the characterization of local atomic distortions present in solids. The information it provides is therefore complementary to the information obtained by x-ray diffraction. XAFS can also be used to probe molecular species in liquids or amorphous solids such as glass. For the past eight years, we have led a large, international, multicollaborator program at the Stanford Synchrotron Radiation Laboratory (SSRL) to apply XAFS to actinide chemistry and materials science. All our experiments were conducted with synchrotron radiation from the SPEAR ring at SSRL. Some of our results are presented in other articles in this volume, including “XAFS” on page 422. Number 26 2000 Los Alamos Science
Recent Evidence for Local Structure in δ-Phase Plutonium Alloys The commonly accepted Pu-Ga phase diagram indicates that the fcc δ-phase can be retained with additions of 2 to 9 atomic percent (at. %) gallium to room temperature, as shown in Figure 1(a). In fact, if great care is taken to ensure a microscopically uniform gallium concentration, the fcc δ-phase can be retained with as little as 1 at. % gallium and up to as much as 10 at. % gallium (see the article “Plutonium and Its Alloys” on page 290). However, the work of Timofeeva shows convincingly that the fcc phase is metastable even at room temperature and over all gallium concentrations. Only the very low diffusion rates of gallium through the plutonium lattice prevent the decomposition of the δ- to the α-phase plus Pu3Ga. Classical x-ray diffraction studies over the years indicate that the crystal
structure of the gallium-stabilized δ-phase is that of a single fcc lattice. From a combination of density measurements and x-ray determinations of the lattice parameter, it was concluded that the gallium atoms form a “substitutional solid solution” in plutonium, that is, the gallium atoms substitute for the plutonium atoms in the fcc lattice. As stated earlier, however, it is not possible to determine how the smaller gallium atoms fit into the plutonium lattice. We know that the gallium atoms do not arrange themselves with systematic long-range order because superlattice reflections (indicative of long-range order) have not been observed. As shown in Figure 1(b), the average lattice parameter of the δ-phase solid solution decreases linearly with increasing gallium concentration. The decrease is greater than that predicted by the linear rule of mixtures, called Vegard’s law, indicating that the δ-phase is not an ideal solid solution. 357
XAFS of Plutonium
1.7 2.3
3.7 3.0 2.3
4.7
3.0
Pu LIII χ (R)
6.5
3.7
1.7
4.7 6.5 2.9
3.1
3.3
3.5
3.5
3.7
R − φ (Å)
3.9
4.1
R − φ (Å)
1.7 at. % Ga 2.3 at. % Ga 3.0 at. % Ga 3.7 at. % Ga 4.7 at. % Ga 6.5 at. % Ga
0
1
2
3
4
5
6
7
8
R − φ (Å)
Figure 2. Fourier Transform Moduli of Pu-Ga δ-Phase Alloys The principal peaks of the Fourier transform moduli χ(R) correspond to shells of atoms surrounding a target atom. The height of a peak is proportional to the number of atoms in the shell but inversely proportional to the square of the distance away from the target atom. The height is also reduced by thermal and static disorder within the local structure. The raw XAFS data contain phase as well as amplitude information, so χ(R) is not a direct representation of the actual structure. Because of the phase shift φ, for example, the peak position in χ(R) is typically 0.1–0.5 Å below the true interatomic distance. (Main graph) The large peak near R – φ = 3.1 Å represents the first shell of plutonium atoms that surrounds each plutonium atom in the fcc δ-phase lattice. (The shell contains 12 atoms at 3.28 Å) The relatively small peak near R – φ = 4.4 Å corresponds to 6 atoms at 4.64 Å—the second shell of the fcc lattice. The peak at R – φ = 5.5 Å is due to 24 atoms in the third shell at 5.68 Å. The amplitude of this peak is typically the best figure of merit for the degree of extended local order. Peaks at R – φ = 6.4 and 7.2 Å correspond to the fourth and fifth shells, respectively. (Inset left) Detail of the first peak shows the variation with gallium concentration. (Inset right) Detail of the 3.8-Å region shows the height of this peak as indicative of the σ-structure.
The XAFS technique is suited precisely for this type of local-structure study. Unfortunately, for several years, we were not able to obtain wellcontrolled and well-characterized δ-phase plutonium alloy samples. Instead, we used what samples were available as we refined the XAFS technique for crystalline plutonium. 358
By analyzing dozens of alloys and hundreds of XAFS spectra (including plutonium alloyed with various amounts of gallium, cerium, indium, lead, and combinations thereof), we were able to make two overarching observations: (1) A definite local structure was apparent in solute-lean alloys. This local structure, which we will call
the σ-structure, is extraneous to the fcc structure of the δ-phase. (2) This superposed σ-structure tended to disappear with age over a decade or more. Regrettably, the great variability in sample chemistry and processing did not allow for unambiguous characterization of the σ-structure or an understanding of its stability. We recently completed the first systematic examination of carefully processed Pu-Ga alloys with gallium concentrations varying from 1.7 to 6.7 at. %. These samples were arcmelted from high-purity, zone-refined plutonium with appropriate amounts of high-purity gallium. The resulting purity was approximately 120 parts per million (ppm) by weight of uranium, with all other metallic impurities being less than 100 ppm total. The samples were rolled into thin sections (with intermediate annealing treatments), homogenized at 450°C for 48 hours, and electropolished to remove any surface oxides. X-ray diffraction measurements of the thin sections used for XAFS studies confirmed the lack of any discernible phases besides the fcc δ-phase. We have yet to confirm the microscopic uniformity of gallium but expect it to be reasonably uniform on a micrometer scale. Some of the measurements were made at 300 kelvins, although it is very difficult to get high-quality data at those temperatures because the high thermal softness of both α- and δ-phase plutonium gives rise to large lattice vibrations (see the article “Atomic Vibrations and Melting in Plutonium” on page 190). Most of the measurements were made at 90 and 35 kelvins to reduce the thermal vibrations and hence the diffuse thermal scattering. The low temperature also makes it easier to quantify the diffuse scattering that results from the structural arrangements of the plutonium and gallium atoms (rather than from thermal vibrations). The principal concern about making the measurements at low temperatures is that the δ-phase alloys may transform to the monoclinic α′-phase. Los Alamos Science Number 26 2000
XAFS of Plutonium
Figure 2 shows the Fourier transform modulus of some of our plutonium LIII edge spectra. (The Fourier transform modulus is an approximate representation of the average local structure around the absorbing atom. The steps involved in analyzing an XAFS spectrum are discussed more thoroughly in the article “XAFS” on page 422.) The most notable difference between the sample’s Fourier transform modulus and that of a calculated fcc δ-structure is the peak or resolved shoulder at R-φ ~ 3.75 angstroms. This peak is well fit by assuming a plutonium shell at about 3.8 angstroms, which is quite outside the range of any of the standard fcc neighbors. This feature was the first and best indication of the presence of the local σ-structure. Another feature is the Pu-Pu shell at 5.0 angstroms, which is similarly not found in the fcc structure of δ-plutonium. Interpretation of the 3.8 angstroms Pu-Pu distance has been a point of contention because it is very close to that in PuO2, a possible surface contaminant. However, searches of the XAFS data failed to find oxygen atoms at 2.35 angstroms, which must be present if the probed structure is PuO2. We also couldn’t find any of the more distant oxygen and plutonium shells indicative of PuO2. Lastly, the other features associated with the σ-structure are not associated with this oxide. The rightmost inset in Figure 2 shows that the amplitude of the feature around 3.75 angstroms (and presumably the fraction of plutonium atoms in this local structure) generally decreases with increasing gallium concentration, diminishing to near zero between 3.7 and 4.7 at. % Ga. These results are generally consistent with our earlier experiments, which indicated that the amount of local structure significantly decreased near or slightly above 3.3 at. % Ga. We were surprised, however, that the 1.7 at. % gallium sample exhibited very little local structure. Previous experiments had showed that this gallium concentration range exhibited the largest amount of the σ-structure. However, we also note that Number 26 2000 Los Alamos Science
this 1.7 at. % gallium sample showed some evidence of transforming to the α′-phase upon cooling to 35 kelvins. The amplitude of the first large peak in the data set shown in Figure 2 (corresponding to the first shell of atoms around a plutonium atom) also reveals the influence of gallium concentration on the fcc structure. Because the gallium is smaller than the plutonium, the Ga-Pu bond length is reduced. The gallium thus displaces nearby plutonium atoms from their lattice sites and disorders the Pu-Pu pair distribution in the material, with increasing disorder associated with increasing gallium concentration. This effect is observed in the spectra, with the height of the peak decreasing as the gallium concentration increases from 1.7 to 2.3 to 3.0 at. % gallium, and also from 3.7 to 4.7 to 6.5 at. % gallium. In fact, at the highest measured concentration (6.5 at. % gallium), the average number of gallium neighbors approaches unity, and the disrupting effect can even be seen to disorder the extended local structure involving the more distant shells. Interestingly, the peak height jumps higher as the gallium concentration increases from 3.0 to 3.7 at. %. This is also the concentration at which the σ-structure undergoes a rapid decrease to near zero. The transformation from a heterogeneous structure to a homogeneous fcc arrangement of atoms should be accompanied by an overall increase in the plutonium order and, hence, an increase in the height of the first peak. Thus, the behavior of the first peak generally corroborates the trend observed in the 3.75-angstrom region. We believe that our most recent XAFS results demonstrate that the uniform fcc structure deduced from x-ray diffraction measurements is not strictly all δ-phase. Instead, plutonium microstructures harbor an additional structure on the nanometer scale. The nature and amount of this local σ-structure appears to vary in a complex manner with increased gallium concentration. We must still reconcile the appearance of the σ-structure with
the fact that lattice parameters and densities (as well as other properties such as mechanical strength and resistivity) are consistent with the existence of a single fcc δ-phase structure. Clearly, our observations must be confirmed with additional experiments on wellcharacterized samples. But these recent experiments, combined with data from earlier experiments and from x-ray diffraction and transmission electron microscopy, may hold the key to understanding the nature of phase stability in plutonium alloys.
Gallium XAFS By changing the x-ray energy, we were also able to probe the environment surrounding the gallium atoms to determine how the Ga-Pu distances compare with the Pu-Pu distances. Faure et al. (1996) reported that the Ga-Pu nearest-neighbor distance was as much as 0.1 angstrom shorter than the nearest-neighbor Pu-Pu distance. Moreover, the Ga-Pu distance lengthens with increasing gallium concentration, but begins to shorten above 7.5 at. %. The Pu-Pu distance was very close to that expected from the XRD lattice parameter measurements and decreased with increasing gallium concentration. These results, if correct, would provide valuable insight into the effect of gallium on the stabilization of the δ-phase. However, we are very concerned that Faure et al. fit the nearest-neighbor contribution with a single plutonium shell, even when the average number of gallium nearest-neighbors is one. Under those circumstances, the plutonium distribution should be highly disordered. We investigated the interatomic distances using a very sensitive phasedifference method that is not subject to the same assumptions used by Faure et al. The gallium XAFS results from samples spanning the range of gallium concentrations presented before are shown in Figure 3. To compare the Pu-Pu and Ga-Pu distances to each other, we used phase differences. 359
XAFS of Plutonium
3.0 at. % Ga 4.7 at. % Ga
χ (R)
6.5 at. % Ga
0
1
2
3
4 R − φ (Å)
5
6
7
8
Figure 3. Fourier Transform Moduli of Gallium XAFS Comparison of the gallium XAFS for three alloys reveals little change in the Ga-Pu bond length with gallium concentration. All samples were probed at 35 K. The amplitudes of the Fourier Transform moduli are scaled identically.
In contrast to Faure et al., we found that the Pu-Pu distances varied by less than 0.008 angstrom over the range of gallium concentrations. The changes for the Ga-Pu distance were somewhat larger: We measured a contraction around the gallium atoms of 0.13 angstrom in the first shell, 0.05 angstrom around the second shell, and 0.01 angstrom around the third shell (this latter contraction is within our experimental uncertainties). Although we found that the average Pu-Pu distance was approximately 0.13 angstrom larger than the Ga-Pu distance, the plutonium and gallium XAFS measurements show that the nearest-neighbor distances are relatively unchanged with gallium concentration. The decrease in the lattice parameter reflects the fact that, as the gallium concentration is increased, the fraction of shorter Ga-Pu bonds increases. These results are very similar to those found by Mikkelson and Boyce (1983) for GaInAs solid solutions.
360
Tracking Gallium and Other Solutes during Aging Plutonium is radioactive—hence, the metal continually irradiates itself. As discussed in the article “Aging of Plutonium and Its Alloys” on page 238, the relentless deposition of energy in the material because of self-irradiation potentially alters the phase stability and behavior of plutonium alloys. For example, self-irradiation studies at cryogenic temperatures show a significant contraction (on the order of 15 percent over many thousands of hours) of the lattice parameter of δ-phase plutonium alloys at 4.2 kelvins. On the other hand, these alloys expand slightly (between 0.01 to 0.1 percent per year, at least for the first few years) at ambient temperature. We do not understand this behavior. We know that self-irradiation creates copious Frenkel pairs (plutonium selfinterstitials and vacancies), and the lattice damage, in turn, may influence
the distribution of δ-phase stabilizing elements such as gallium. Self-irradiation also creates transmutation products (such as helium, americium, neptunium, and uranium), which by themselves can potentially affect the thermodynamic long-term stability of the alloys. For example, it is well known that americium is a δ-phase stabilizer, whereas uranium destabilizes the δ-phase, and neptunium is the only known α-phase stabilizer. Moreover, the creation of vacancies and helium may affect the diffusion rates of plutonium and solutes in δ-phase alloys. We have examined a limited number of α- and δ-phase plutonium alloys aged at ambient temperature for up to 36 years. Figure 4(a) shows the XRD results from our synchrotron experiments for two of these samples. The aged Pu–3.3 at. % Ga δ-phase alloy exhibits only the expected fcc phase with sharp diffraction peaks, indicating very little disturbance to the crystalline lattice. The α-phase pure plutonium samples exhibit the expected monoclinic phase, also with excellent crystallinity. These results indicate that most of the self-irradiation damage in both α- and δ-phase plutonium is annealed out (or healed) at ambient temperature. There is no indication of the samples becoming amorphous. However, from XRD we cannot tell if any rearrangement of alloying elements takes place. Neither can we tell the location of the transmutation products in the crystal lattice. XAFS measurements comparing fresh and aged samples may provide a clue to changes in local structure with aging. We would particularly like to track the gallium as the plutonium ages. We have examined a limited number of aged plutonium alloys to date and compared them with newly prepared samples. Because some of the aged samples are decades old, we were not able to reproduce their processing histories. The new samples could only roughly match the chemical makeup of the aged alloys. However, the initial impurity content of these alloys was typically in excess of 1000 ppm by weight comLos Alamos Science Number 26 2000
XAFS of Plutonium
(a)
Figure 4. Probing Aged Plutonium Alloys (a) XRD experiments conducted at the SSRL achieve a very high momentum transfer Q, defined as Q = 4πsin(Θ)/λ , where Θ is the diffraction angle and λ is
S (Q)
the x-ray wavelength. The top curve in red (y-axis zero offset for clarity) represents a δ-phase Pu–-3.3 at. % Ga alloy aged at ambient temperature for 36 years. The bottom curve is an α-phase sample aged at ambient temperature for 32 years. The sharp diffraction peaks maintained out to very high Q indicate that excellent crystallinity is maintained during aging.
2
6
10
Note that classical XRD run in the labora-
14
Q (Å−1)
tory with a copper anode would be limited to Q ~ 8 A–1. (b) XAFS measurements reveal the σ-structure’s dependence with sample
(b) 2.4 at. % Ga
age. Several samples with the same com-
1.7 at. % Ga
position were probed to check reproducibility. The graph shows the dif-
1.7 at. % Ga
ference between the Fourier transform
3.3 at. % Ga
modulus of the data and a calculated fcc δ-phase alloy. The largest difference is in
∆ χ (R)
1.7 at. % Ga, aged
the region of R - φ = 3.75 Å, indicating the presence of the local σ-structure. Newly
3.3 at. % Ga, aged 3.3 at. % Ga, aged
prepared alloys with Ga concentrations less than 3.3 at. % have a large amount
2.3 at. % Ga, aged
of this structure. Decade-old alloys with Ga concentrations between 2.3 and 3.3 at. % show only negligible amounts. A low-purity Pu–1.7 at. % Ga alloy aged
3
4
5
6
7
R − φ (Å)
pared with the few hundred parts per million impurity levels of the new samples. (Additional impurities are also introduced during aging by transmutation of the plutonium atoms). We wish to share our preliminary observations. First, we find that the local σ-structure tends to disappear with age, as seen in Figure 4(b). We found no local structure in new or aged samples of the low-purity alloys for gallium concentrations in excess of 3.3 at. %. Second, while samples of low-purity, Pu–1.7 at. % Ga clearly exhibited substantial amounts of the local structure, Number 26 2000 Los Alamos Science
newer samples of higher purity showed far less structure. Our results lead to the tempting observation that aging may alter the local structure and have a stabilizing effect on the fcc δ-phase. However, these results are very preliminary. Los Alamos and Lawrence Livermore National Laboratories are planning a program to accelerate the aging process in plutonium samples. (The more radioactive plutonium-238 will be blended with plutonium-239 to accelerate the self-irradiation.) We hope that future XAFS studies using these samples will allow a direct comparison
for 15 years displays an intermediate quantity.
of aging effects. It would also be very informative to track the transmutation products helium, americium, uranium, and neptunium. Most likely, these elements are present at random in the plutonium lattice at the end of the collision cascade, but XAFS studies would allow us to determine how these elements rearrange with time and temperature. Unfortunately, helium is simply too light to track with x-rays, and it was not possible to observe americium because of interference from the strong signal of plutonium. We have not yet 361
XAFS of Plutonium
U; δ-Pu
U LIII χ (R)
U; α-Pu
0
2
4 R − φ (Å)
6
0
2
4 R − φ (Å)
6
8
Figure 5. Uranium LIII Edge Fourier Transform Modulus The two graphs show the XAFS for uranium atoms in different plutonium lattices (taken at ~80 K). The graph on the left shows an α-phase plutonium sample aged for 32 years at ambient temperature. The graph on the right represents a δ-phase Pu–3.3 at. % Ga alloy aged at ambient temperature for 36 years. The results show that the uranium atom substitutes for the plutonium atoms in both lattices—a surprising result considering that uranium has no equilibrium solid solubility in either phase of plutonium.
looked for neptunium because its small concentration would make the experiments extremely time-consuming. We were, however, able to make preliminary observations on the location of the uranium transmutation product in the aged samples. The uranium XAFS spectrum of aged samples is shown in Figure 5. The uranium was most likely introduced via the decay of the plutonium. The spectrum shows that the nearest neighbor U-Pu distance is only about 0.07 angstrom shorter than the average Pu-Pu length in the δ-phase alloy. Additional samples of aged α-plutonium show that, within the experimental uncertainty, the distance between uranium and plutonium atoms is nearly identical to that between plutonium atoms in the α-phase. This is a surprising result, given uranium’s low solubility in both of these plutonium phases and its propensity to form high362
density structures with small atomic volumes. It is possible that its immersion in the plutonium lattice modifies its electronic structure to match that of the plutonium host in both phases.
Gallium Migration in Transformed Structures Below room temperature or under high pressure, the low-gallium alloys readily transform by a martensitic transformation to a monoclinic α′-phase. (See the article “Plutonium and Its Alloys” on page 290.) The gallium atoms are trapped in the monoclinic α-lattice and result in a slight expansion to the α′-phase. Since there is no equilibrium solubility for gallium in the α-phase, there is a strong driving force to reject the gallium atoms from the lattice. As stated earlier, our XAFS samples
are typically cooled to cryogenic temperatures to yield the best measurements. Based on the transformation characteristics of δ-phase Pu-Ga alloys, we expect the Pu–1.7 at. % Ga samples to transform to approximately 25 to 30 percent α′-phase upon cooling. However, we have rarely seen any evidence of the α′-phase in our previously examined samples. We have recently examined a Pu–1.7 at. % Ga sample that was cooled in the laboratory to transform it to a mixture of δ- plus α′-phase. We then carefully examined the sample by XRD to confirm the mixture and then probed it by XAFS. The plutonium XAFS, seen in Figure 6(a), clearly shows the set of short Pu-Pu distances indicative of the α′-structure, as well as the prominent peak at the longer distance from the δ-component. This was the first time that XAFS had unambiguously seen the α′-phase in a sample. Figure 6(b) shows the gallium XAFS. Only the prominent peak of the δ-phase is apparent for the mixed δ- plus α′-phase sample. The height of the peak is reduced, however, because both phases are present. The figure also shows the newly prepared Pu–1.7 at. % Ga alloy that showed a small amount of σ-structure. Its peak height indicates some disordering of the δ-phase, most likely by the local strains resulting from the partial transformation to the α′-phase. The gallium XAFS results for the mixed-phase sample confirm that gallium atoms are initially trapped at random in the α′-lattice. This random trapping is expected because martensitic transformations allow no compositional changes from the parent phase during transformation. However, as these samples are returned to room temperature or above, there is a strong driving force to move the gallium out of the plutonium lattice. XAFS measurements offer the promise of allowing the tracking of the gallium atom motion in the transformed product as a function of time and temperature.
Los Alamos Science Number 26 2000
XAFS of Plutonium
(a)
Further Reading
(b)
1.7 at. % Ga
1.7 at. % Ga
α-Pu
4.7 at. % Ga
Conradson, S. D. 1999. Appl. Spec. 52:: 252.
1.7 at. % Ga, mixed
1.7 at. % Ga, mixed
Faure, P., B. Deslandes, D. Bazin, C. Tailland, ga. 1996. J. All. Compounds 244: 131.
Ga K χ (R)
Pu LIII χ (R)
R. Doukhan, J. M. Fournier, and A. Falan-
Hecker, S. S. 2000 (to be published). Plutonium Aging: From Mystery to Enigma. In Proceedings of the International Conference on Ageing Studies and Lifetime Extension Materials. Edited by L. G. Mallinson, 191. Dordrecht: Kluwer Academic Publisher. Mikkelsen, J. C., and J. B. Boyce. 1983. Phys.
0
2
4 R − φ (Å)
6
8
0
2
4 R − φ (Å)
6
8
Rev. B 28(12): 7130. Zachariasen, W. 1963. Acta Cryst. 16: 777.
Figure 6. Evidence for the α′-phase in XAFS Spectra (a) The green curve is the plutonium XAFS of a Pu–1.7 at. % Ga sample that was partially transformed (on purpose) to the α′-phase at low temperatures. In contrast to either the α- or δ-phase sample, the mixed δ + α′ sample shows two peaks. The peak on the left is consistent with the short Pu-Pu bonds of the α′-phase, whereas the peak
For a biography of Steven D. Conradson, see page 435.
on the right is consistent with the fcc δ-phase structure. (b) Gallium XAFS (from the gallium K edge) at 35 K from three samples: δ-phase samples of high-purity newly prepared Pu–1.7 at. % Ga and Pu–4.7 at. % Ga alloys and the mixed δ + α′ sample shown in (a). The reduced peak height for the mixed sample indicates the δ-phase is disordered as a result of transformation to the α′-phase. The absence of a distinct gallium peak at the shorter Pu-Pu distance characteristic of the α′-phase confirms that gallium atoms are trapped at random in the α′-lattice. The newly prepared Pu–1.7 at. % Ga sample shows features similar to the mixed sample, suggesting that it too partially transformed upon cooling.
Conclusions We have demonstrated the utility of XAFS for studying the local structure of plutonium alloys. The complexity of phase stability and phase transformations, particularly as they are affected by alloy chemistry and processing, has made it difficult to unambiguously interpret our results to date. Preliminary observations using XAFS to track solutes in plutonium during aging and as a result of phase transformations are very encouraging. We are convinced that additional studies of well-characterized plutonium alloy samples will help solve some of the long-standing puzzles of phase stability and phase transformations in plutonium, as well as provide new insight into the Number 26 2000 Los Alamos Science
mechanisms by which plutonium and its alloys age with time. �
Acknowledgments My thanks go to P. Villella, L. Cox, B. Martinez, R. Martinez, J. Lashley, L. Morales, A. Lawson, R. Pereyra, J. Terry and F. J. Espinosa for sample preparation, experimental assistance, and essential discussions. I would especially like to thank S. S. Hecker for discussions and assistance with this manuscript. XRD and EXAFS experiments were performed at the Stanford Synchrotron Radiation Laboratory, which is operated by the U.S. Department of Energy, Office of Basic Energy Sciences. 363