According to the recent National Educational Technology Plan (March, 2010), .... This broad definition includes social,
Where streams converge: Using evidence-centered design to assess Quest to Learn Valerie J. Shute and Robert J. Torres
1. Introduction According to the recent National Educational Technology Plan (March, 2010), our education system needs a revolutionary transformation rather than evolutionary tinkering. In general, the plan urges our education system at all levels to: (a) be clear about the outcomes we seek; (b) collaborate to redesign structures and processes for effectiveness, efficiency, and flexibility; (c) continually monitor and measure our performance; and (d) hold ourselves accountable for progress and results every step of the way. With an eye toward those goals, this chapter describes an ongoing assessment of a transformative new school called Quest to Learn (Q2L). Q2L is an innovative, student-centered, games-based public school that opened in New York City in September 2009 for grades 6-12 (beginning with a sixth-grade cohort). It includes a dynamic and interdisciplinary curriculum, using design principles of games to create highly immersive learning experiences for students. The curriculum, like games, is immersive, participatory, allows for social engagement, and provides a challenge-based context for students to work within. Basing the design of a school on games can certainly be construed as revolutionary. There are, however, some good reasons for this. For example, Gee (2008) has argued that game design has a lot to teach us about learning, and contemporary learning theory has something to teach us about designing better games and instructional environments. One link in place between these realms (i.e., games, learning, and instructional environments) is formative feedback—a critical part of any learning effort (e.g., Shute, 2008), and also a key component in good game 1
design which adjusts challenges and gives feedback so that different players feel the game is challenging and their effort is paying off. We believe that (a) learning is at its best when it is active, goal-oriented, contextualized, and interesting (e.g., Bransford, Brown, & Cocking, 2000; Bruner, 1961; Quinn, 2005; Vygotsky, 1978); and (b) learning environments should thus be interactive, provide ongoing feedback, grab and sustain attention, and have appropriate and adaptive levels of challenge—i.e., the features of good games. Along the same lines, Gee (2003) has argued that the secret of a good game is not its 3D graphics and other bells and whistles, but its underlying architecture where each level dances around the outer limits of the player‘s abilities, seeking at every point to be hard enough to be just doable. Similarly, psychologists (e.g., Falmagne, Cosyn, Doignon, & Thiery, 2003; Vygotsky, 1987) have long argued that the best instruction hovers at the boundary of a student‘s competence. More recent reports (e.g., Thai, Lowenstein, Ching, & Rejeski, 2009) contend that well-designed games can act as transformative digital learning tools to support the development of skills across a range of critical educational areas. In short—well designed games have the potential to support meaningful learning across a variety of content areas and domains. So, Q2L is based on principles of game design, and is intended to enable all students, regardless of their academic or personal challenges, to contribute to the design and innovation necessary to meet the needs and demands of a global society. The school culture aims to foster deep curiosity for lifelong learning as well as a commitment to social responsibility, and respect for others and self. These are excellent goals, but as with any grand new idea, Q2L needs to be systematically evaluated—from the level of the whole school down to the individual (e.g., student, teacher). The obvious challenge is to figure out how to accurately infer the success of Quest to Learn when there is nothing comparable. Hence our driving questions are: How can we
2
effectively capture the critical goals/values of Q2L so that we can develop and validate an objectives model, and how can we accurately assess the development of important new competencies which Q2L claims it is teaching its kids? We contend that an evidence-centered design (ECD) approach can be used for assessing Q2L--at both the school and student levels--because it allows for the collection and integration of both qualitative and quantitative data across multiple, situated contexts. That is, ECD allows us to synthesize information from disparate sources into a common framework, characterize its evidentiary value, and reason through often complex relations among what we observe and what we want to infer. The organization of this chapter is as follows. First, we describe Quest to Learn relative to its theoretical foundation and unique pedagogy. Second, we overview our ongoing research project that is intended to identify and model important school-level variables (i.e., key goals/values of Q2L) and assess students on three 21st century competencies (i.e., systems thinking, teamwork, and time management). And third, we describe preliminary findings1 and future research that can be conducted within Q2L.
2. Quest to Learn 2.1. The School A recent report called The Silent Epidemic (Bridgeland, DiIulio, & Morison, 2006) indicates that 81% of students who drop out of school say that school is not relevant to their lives. Q2L‘s designers are keenly aware of these realities and have drawn inspiration from digitally mediated and collaborative practices that mirror those in most professional industries 1
This project began at the same time that Q2L opened in September 2009, and will conclude March 2011. Currently (as we are writing this chapter), we are about halfway into the 18-month research effort.
3
from business, health and medicine to government and the arts. These practices are marked by participatory, co-creative processes and social engagements that exemplify what contemporary learning scientists have been saying for some time: that learning is not simply individualized, but a highly social, context-dependent and collaborative achievement (e.g., Bransford, Brown, & Cocking, 2000; Lave & Wenger, 1991; Vygotsky, 1978). Led by the digital practices of today's kids, Q2L has been carefully designed to capitalize on those practices to engage students in deep forms of learning. Drawing from contemporary research and theories of learning as a socially and technologically-mediated endeavor, a design group at the Institute of Play made up of game designers, learning scientists, and content experts, has spent the past two years architecting Q2L, prior to its recent opening. Q2L was created in an attempt to change the conversation about school reform from one traditionally focused on ensuring students acquire numeracy, reading, and writing skills, to creating the conditions in which students are challenged to apply those skills to help solve the invention and innovation challenges necessary of our time. Indeed, Q2L--designed to serve as a lab for larger school reform efforts--was based on the belief that a core thrust of education in this century must be to engage learners (as is the purpose of most scientific and industry professions) in imagining, researching and prototyping the necessary inventions of our time. This represents a large departure from the historical purposes of K-12 schooling. To meet this goal, Q2L uses a systems-thinking framework as a core curricular and pedagogical strategy within carefully designed game-like, immersive environments. By systems thinking we mean a holistic perspective that sees the world as increasingly interconnected and can be understood systemically, from elemental components to complex systems of activity (e.g., Assaraf & Orion, 2005; Barak & Williams, 2007; Forrester, 1994; Ossimitz, 2000; Salisbury,
4
1996). This broad definition includes social, natural, and technological systems that can be studied and understood as having certain cross-cutting commonalities, such as rules, goals, and particular behaviors. These game-based curricula are designed by teachers, professional game designers, curriculum directors, and other content experts to create 10-week "missions" (i.e., units of study) which are unique and create an immersive world in which students take on various identities, from cartographers to architects to nature ecologists, to solve design and systems-based problems. The curriculum at Q2L is interdisciplinary. It follows national and local content standards, is design-focused (e.g., continually places students in the role of designer), and relevant to the culture of today's students. There are six critical features to the school‘s structure: (a) a systems-thinking and design-thinking focus; (b) a philosophy and practice of technology integration; (c) a blending of new literacies and traditional literacies in a set of interdisciplinary domains; (d) a game-based pedagogy, (e) an ecological and distributed approach to learning, and (f) an innovative approach to teacher development and curriculum design. Upon its opening, Q2L welcomed an ethnically and economically diverse group of New York City sixth graders. Entry into the school is based on interest--students and families must attend an information session, but no student is denied admission based on merit or prior experiences in school. The inspiration for Q2L came from two observations: the huge gap that exists between traditional schooling and the digital practices of today's youth, and the alarming and unchanging rates of high school dropouts in the United States. For more information on the school, see http://www.q2l.org; and also Torres, Rufo-Tepper, and Shapiro (in press).
2.2. Our Research Project The strength of the pack is the wolf, and the strength of the wolf is the pack. ~Rudyard Kipling
5
We began an 18 month-long study to concur with the first days of the school opening in September 2009. The high-level purpose of our research is to define and refine a valid assessment approach designed to work across multiple levels--from the whole school down to specific students. We intend to establish the necessary models that will enable analysis of the efficacy of Q2L in relation to two systemic problems: (1) the need to recognize and support new competencies, and (2) student (dis)engagement relative to current, outdated educational systems. New competencies are needed to effectively compete in our shrinking, interconnected world. We are being confronted with problems of enormous complexity and global ramifications (e.g., nuclear proliferation, global warming, and poverty). When faced with highly technical and complex problems, the ability to think creatively, critically, collaboratively, systemically, and then communicate effectively is essential. Learning and succeeding in a complex and dynamic world is not easily measured by multiple-choice responses on a simple knowledge test. Instead, solutions begin with re-thinking assessment, identifying new skills and standards relevant for the 21st century, and then figuring out how we can best assess students‘ acquisition of the new competencies. Disengagement reflects the large gap between what kids do for fun and what they‘re required to do in school. Most schools cover material that is deemed ―important,‖ but kids are often unimpressed. These same kids, however, are highly motivated by what they do for fun (e.g., play games, participate in social networking sites). Recent reports (e.g., Ito, 2008; Palfrey & Gasser, 2008; Watkins, 2009) have documented not only the extensive worlds youth have created in digital spaces, but have highlighted the highly social, collaborative, and interest-based learning taking place in these digital environments. This mismatch between mandated school activities and what kids choose to do on their own is cause for concern regarding the
6
motivational impact (or lack thereof) of school, but it needn‘t be the case. Imagine these two worlds united—as is the goal and reality of Q2L. Student engagement is strongly associated with academic achievement; thus, embedding school material within game-like environments has tremendous potential to increase learning, especially for disengaged students. Before describing our research further, we turn for a moment to games-based learning, which is at the core of the Q2L intervention. Beyond simply using games to teach, Q2L advocates using the internal architecture of games to create game-like learning environments, whether they are analog or digital. Games instantiate constrained systems of activity (or worlds) in which players engage mediational tools (e.g., a racket in tennis, a written quest prompt in World of Warcraft), other players, and rule sets to achieve clearly defined winning (or goal) conditions. This requires players to enact specific game behaviors. These behaviors in the gaming world are called ―core mechanics‖ players must perform to successfully move through a game. Now, to suit the needs of the 21st century, learning environments should reflect ―knowledge domains‖ or ―discourse communities‖ that reflect the epistemology of real world professional and/or industry domains. That is, learners should be offered opportunities to apply the actual kinds of skills, knowledge and behaviors (i.e., core mechanics) needed to participate in the domain of, say, U.S. history, systems biology, or minimalist architecture. Learners should be offered genuine and ample opportunities to produce and iterate on content endemic to real knowledge domains, and they should also be offered communities of practice where they can collaborate and informally (or formally) share their work with a community of peers. Games enable such social networking, which, as we mentioned, is a core activity in the lives of today‘s youth. Furthermore, having an audience has been seen as a core driver of engagement of youth
7
in online social networking sites (e.g., Ito et al., 2010). In summary, games are engaging spaces which foster the kinds of valuable new competencies (e.g., problem solving, critical thinking skills) we believe are important to succeed in the 21st century. Additionally, they permit one to try on various identities and may be structured in ways that transition smoothly to the real, complex world. For more on this topic, see Gee, in press; Shute, Rieber, and Van Eck, in press.
2.2.1. Goals of the Research Project The two main goals of this effort are to (a) identify and model important school-level variables (i.e., key objectives of Q2L based on the articulated goals of the designers, administrators and teachers), and (b) identify and assess a set of key student-level variables (i.e., important attributes related to success in the 21st century and aligned with the Q2L objectives). Identified critical school objectives comprise a clear target toward which everything else related to the school should aim—such as valued student processes and outcomes. Modeling the competencies, and assessing and supporting students in relation to 21st century skills will allow students to grow in important new areas. Some examples of valued competencies at Q2L include the ability to function productively within multidisciplinary teams; identify and solve complex problems with innovative solutions; communicate effectively and persuasively; engage in deep exploration of various topics of interest; use technology efficiently; demonstrate intellectual curiosity; understand local and global system dynamics; engage in evidence-based reasoning, reflexivity, and ethical decision making; and work toward the development of a more just and peaceful world. Data derived from our 18-month effort can also be used to enable Q2L faculty and staff to responsively revise and improve the school‘s processes to align student achievement and school goals. As we describe later in this chapter, relevant stakeholders can be notified about 8
problems that arise, on any level (i.e., individual student, classroom/course, or school), providing the information necessary to nip problems in the bud, formatively speaking. 2.2.1.1. School Objectives Hierarchy The first step of this 18-month effort was to identify the critical goals espoused and embodied by the school (i.e., what ―success‖ and ―failure‖ of the school would look like) and to structure that information into an evaluation hierarchy (i.e., a graphical model of the objectives/goals; see examples in the Appendix). This effort required about seven months of interviews, surveys, focus groups, and observations involving relevant stakeholders (e.g., directors of Q2L, teachers, administrators, curriculum designers, and students) and a critical study of the school‘s design documents (see Salen, Torres, et al., in press) in an iterative design. Information gleaned from this effort was then arrayed in a hierarchical model—with ―Q2L Success‖ as the uppermost goal (or ―node‖), followed by progressively more specific variables. For example, one dominant value that was voiced by a majority of respondents concerned the ―culture‖ of Q2L, with one type of culture being "establishing a cohesive and inclusive community." That variable was ultimately decomposed into more specific variables, such as: (a) appreciating diversity, (b) feeling of belonging, and (c) being physically and emotionally safe. Finally those variables can be further refined to measurable variables with associated rubrics-such as appreciating diversity being further specified to respects other ethnic groups, and values others' views/traditions. The objectives hierarchy will serve as the basis for subsequent research/evaluation efforts comprised of school, classroom, and student level assessments. The aim is to clearly describe and depict what is of value to the school and its extended community, while also establishing a framework to help in evaluating what works, what does not work, and why. In other words, we
9
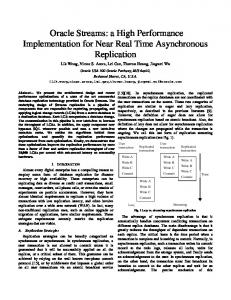
are teasing out and clearly specifying the important goals and values of Q2L in terms of what makes this school and its affiliated community unique, and then creating particular metrics and criteria, per goal by which to assess it (see Methods section for how we are accomplishing this via an evidence-based approach). Setting up the infrastructure to gather quantitative and qualitative data on identified values is thus a critical part of our research. 2.2.1.2. Assessing Student Competencies and Other Attributes Concurrent with the school-goals analysis described above, we are also assessing studentlevel variables. This involves the administration of a set of assessments at 6-month intervals across the 18-month period to capture the current states of critical competencies and monitor their development over time. These are not your mama‘s bubble-form assessments. Instead, they consist of engaging surveys, questionnaires, situation-judgment tasks, and performance tasks relating to selected competencies. (Note that authentic embedded assessments will eventually be built into the Q2L curriculum--outside the scope of this project). To counter concerns about comparative measures that may arise with innovative endeavors like Q2L, data are also being collected from traditional tests. This will enable us to match Q2L students with other public school students and compare academic achievement. We have currently identified two NYC middle schools in the same district as Q2L, with demographically similar student populations. We are assessing the following three competencies during the 18-month period: (1) systems thinking, (2) teamwork, and (3) time management. Each of these three competencies has its own set of variables. Figure 1 (1a, 1b, 1c) shows each of the three main variables and their primary (first-level) nodes. The models were derived from the literature, based on theoretical and empirical support. For example, the three main nodes comprising systems thinking (Figure 1a)
10
relative to Q2L are based on research reported by Ossimitz (2000); Richmond (1993); Shute, et al. (2010); Sweeney and Sterman (2000; 2007); and Torres (2009).
Figure 1. Three mini competency models for student assessment in Q2L Assessment instruments for each of these three competencies were designed, developed, and validated previously. Our assessment for systems thinking is based on the protocol employed by Sweeney and Sterman (2007). For the teamwork model (Figure 1b), we synthesized research described by the following: Rysavy and Sales (1991); Tindale, Stawiski, and Jacobs (2008); Totten, Sills, Digby, and Russ (1991); Van den Bossche, Segers, and Kirschner (2006); and Zhuang, MacCann, Wang, Liu, and Roberts (2008). The three-factor solution shown in Figure 1b has been consistently reported for this variable relative to middle- and high-school students (see Zhuang et al., 2008). Finally, our time management model (Figure 1c) was based on the findings of Liu, Rijmen, MacCann, and Roberts (2009); MacCann, Duckworth, and Roberts (2009); MacCann, Shahani, Dipboye, and Phillips (1990); and Roberts, Schultze, and Minsky (2006). This two-factor solution has been reported relative to middle-school students. 11
The first research question related to student assessment asks: Does the incoming cohort of 6th grade students at Q2L demonstrate improved performance over 18 months in the areas of systems thinking, teamwork, and time management skills? These three competencies are supported (albeit implicitly) during the course of daily school activities (e.g., completing projects in small groups, analyzing games in terms of their underlying systems). In addition, we will be examining this cohort‘s academic achievement (i.e., mathematics and reading skills) in relation to a normative sample of NYC public school students. The associated research question is: Do students in the Quest to Learn school perform comparably to matched students in other NYC public schools on standardized math and reading test scores? We will be able to determine if Q2L is successfully supporting students‘ development of important new competencies as a function of its unique environment, while not sacrificing traditional (i.e., math and reading) academic achievements. In relation to our first research question, we hypothesize that students will, on average, demonstrate improved performance in relation to the three focal competencies from initial (time 1, September 2009) to final (time 4, March 2011) assessment. In terms of research question 2, and in line with the premise of primum non nocere (first, do no harm), we hypothesize that students in the Quest to Learn school will do no worse than a comparable sample of students (normative data) from the New York City Public Schools.
3. Methods Measurements are not to provide numbers but insight. Ingrid Bucher
3.1. Evidence-centered design Ensuring validity and reliability of the assessments is critical throughout the 18-month assessment project. Consequently, we are using an evidence-centered evaluation (ECE) approach 12
to assess school-level goals, and evidence-centered design (ECD) to assess student-level variables.
3.1.1. Evidence-Centered Evaluation (ECE) for Assessing School Goals ECE (Shute & Zapata-Rivera, 2008) represents an extension of evidence-centered design for assessments (Mislevy, Steinberg, & Almond, 2003) and involves an initial specification of various models—objectives, evidence, and data (see Figure 2). ECE can support the ongoing monitoring and diagnosis of Q2L variables across multiple levels. Furthermore, data can be aggregated up to the main ―Q2L success‖ node (i.e., the top circle in the Q2L Objectives box in Figure 2), or disaggregated to class- or student-level data. This systematic evidence-based approach provides a way to lay out an evaluation complete with evidentiary arguments that explicitly link data to Q2L objectives. It is intended to eventually provide for ongoing monitoring of relevant indicators (captured, analyzed, and diagnosed) with increased validity for each of the main Q2L objectives as well as the constituent sub-goals.
Figure 2. Three primary ECE models working in concert to evaluate Q2L goals Following the specification of the objectives model derived from extensive interviews, surveys, focus groups, document reviews, and observations conducted during the first seven
13
months of this effort, the evidence model is ready to be crafted. The evidence model represents the statistical glue between the set of Q2L objectives (unobservables) and the wide collection of observable data or indicators (e.g., classroom observations, test scores, questionnaire responses, etc.). Statistical models, such as Bayesian nets, may be used for accumulating evidence across multiple sources (albeit this is outside the scope of our current project). Accumulation of evidence is accomplished by mapping the scoring or ―evidence‖ rules to relevant nodes in the objectives model (see Evidence box in the middle of Figure 2). For each evidence model, we are defining the methods needed to elicit, score, and accumulate observations. Finally, for all observables, we will define the characteristics of the data needed to satisfy evidentiary needs-i.e., what do these data look like, and how much information do they contribute toward the unobservable variables? Reversing the flow (from right-to-left in Figure 2) enables us to diagnose the current state of success (e.g., low, medium, or high) per objective in the objectives model. Again, this involves using multiple sources of data to score, analyze, and combine evidence to infer probabilistic estimates of success (per node, and to what degree). The objectives model will always be up-to-date, providing the current state of the model at any point in time and at any level of interest. The beauty and power of this approach is that it can provide clear evidentiary arguments (from data to objectives) for data-driven decision making, transparency, and accountability purposes--all important aspects of the unique culture of Q2L. It can also provide timely alerts for relevant stakeholders regarding successes or perhaps more critically, problems that need immediate attention. That is, alerts may be established in the model, defined as cutvalues, which could then trigger automatic emails to relevant stakeholders. A similar evidencebased approach is used for the student variables, discussed next.
14
3.1.2. Evidence-Centered Design (ECD) for Assessing Student Variables To assess our selected competencies, we are using evidence-centered design as a way of reasoning about student performance (for more, see Mislevy & Behrens, this volume). ECD also provides a way of reasoning about assessment design, which may be used subsequent to our initial 18-month effort to develop additional assessments for Q2L on valuable competencies. To assess students‘ systems thinking, teamwork, and time management skills, we are using existing assessment instruments and protocols, as mentioned earlier. The key idea of ECD (as with ECE described above) is to specify the structures and supporting rationales for the evidentiary argument of an assessment. By making the evidentiary argument explicit, it becomes easier to examine, share, and refine. Argument structures encompass, among other things, the claims (inferences) one wishes to make about a student, the observables (performance data) that provide support for those claims, the task performance situations that elicit the observables from the students, and rationales for linking it all together (for more, see Mislevy & Behrens, this volume; Shute, Hansen, & Almond, 2008; Shute et al., 2010). The three main models used in ECD for student assessment follow:
Competency Model--A given assessment is meant to support inferences for some purpose, such as grading, providing diagnostic feedback, and so on. The competency model describes the knowledge, skills, and other attributes about which inferences are intended, context under which the ability is demonstrated, and the range and relations of competencies in the knowledge domain.
Evidence Model--This defines the evidence that is needed to support the aforementioned claims. Evidence models describe what's to be scored, how to score it, and how to combine scores into claims. These models establish the boundaries of performance and identify observable actions that are within those boundaries.
15
Task/Activities Model--The purpose of this model is to identify tasks, features of tasks, and/or activities that are able to elicit the evidence defined in the evidence model. Task models specify the inputs required to perform the observable actions as well as the work products that result from performing the observable actions.
Currently, we have competency models established for each of our main variables: systems thinking, teamwork, and time management skills (see Figure 1). Now, to determine how well a student is (or is not) acquiring/honing these skills, we collect relevant data that is disentangled and interpreted in valid and reliable ways. A good diagnostic system should be able to accurately infer competency estimates (i.e., levels of mastery) for a student on virtually any type of variable (e.g., demonstrating knowledge of a time delay within a given system, showing proper interpersonal skills during a collaborative effort, allocating time appropriately during a time-critical task, etc.). Again, this process begins with the design of an accurate and informative competency model which provides the basis for both specific (e.g., closed-loop thinking) and general (e.g., systems thinking) diagnoses to occur, as well as quantitative and qualitative data to be accumulated. Information from students‘ interactions with specific tasks and with the environment in general can be analyzed to inform environmental affordances for competency development and the degrees to which students met those competencies. For example, we are able to correlate individual student gains in systems thinking with in situ student experiences in classrooms and other learning environments (e.g., afterschool, online), peer and student-teacher interactions, tasks assigned to students, and work they produce. Task-level diagnoses can provide local support to the student, via scoring rules and feedback. Competency-level estimates provide valuable information to the teacher to inform subsequent instruction, to the student to reflect on
16
how well she is doing, and to Q2L administrators to see how well the school is achieving its goals of engendering student learning. In all cases, interpretation of competency level is a function of the richness and relevance of the evidence collected. In a valid competency model, each piece of knowledge, skill, and ability is linked to more than one task or activity so that evidence of a student‘s performance can be accumulated in a number of different contexts and via a variety of ways. This represents converging streams of information.
3.2. Mixed-Model Design A mixed-model research design employing both quantitative and qualitative approaches is being used for the research effort. More specifically, the research design may be characterized as exploratory, descriptive, qualitative, quantitative, as well as somewhat longitudinal in scope. This allows us to triangulate data in order to optimally inform our findings and conclusions. School-level assessment began with a qualitative approach using semi-structured interviews to elicit participants‘ thoughts and beliefs about Q2L values and objectives. Content analysis was used to induce and generate dominant themes from the 500+ pages of transcripts that came from the individual interviews with each of the 16 Q2L stakeholders (i.e., teachers, game designers, curriculum designers, and administrators). All participants were interviewed for 1.5 - 2 hours, and asked questions relating to their view of what is of value to Q2L, such as: How would you describe a successful teacher? How would you describe a successful student? What is Q2L's role in the community? What's the most important feature or function of Q2L? Themes were induced from the full set of interviews, summarized in an 11-page ―collective self portrait‖ document, and shared with all of the participants. Accompanying the collective self portrait document was a link to a short 10-item anonymous survey. The survey 17
asked participants for their role at the school, as well as their thoughts about the content of the collective self portrait--whether it generally and accurately represented Q2L's goals/values, if it represented their particular views, and what may have been missing or off target. Each participant also rank ordered the themes in terms of its importance to Q2L (culture, systems thinking, design thinking, teamwork, resource management, and game-based pedagogy). After analyzing the results from the surveys, we organized a series of focus groups to further flesh out the Q2L model. Moreover, we conducted (and continue to do so) bi-weekly observations in classrooms using two independent observers representing another stream of converging data (note that actions often speak louder than words). In addition to the interviews, surveys, focus group data, observations, and other data sources were analyzed for triangulation purposes, including extant Q2L design documents and mission statements. As explained earlier, the emergent themes were subsequently developed into an objectives model for our assessment of Q2L goals, and is currently being validated by relevant stakeholders. See the Preliminary Results section for a summary of the objectives, and the Appendix for the corresponding graphical models. Student-level assessment is currently ongoing, and mostly quantitative, but partly qualitative. That is, we have been collecting and analyzing quantitative data from the N = 72 students‘ responses to assessments designed to measure systems thinking, teamwork, and time management skills. These assessments are being administered with formats and wording suitable for middle school students. In addition, we have been following students into some of the various places (at Q2L these are called ―nodes‖) where they travel, physically and virtually, to access content. This includes locations inside and outside of school—such as various classrooms, the after-school program, the school‘s unique online social networking site, and the cafeteria. These
18
observations are particularly important relative to our goal of determining how/why students are developing key competencies. Consequently, we developed and are concurrently using a qualitative observation protocol.2 For instance, the protocol calls for two independent observers per site, who conduct observations bi-weekly. The main categories of what they are looking for include: (a) documenting the types of thinking skills that are afforded by each node across the learning ecology (e.g., for systems thinking, observations relate to the evidences of dynamic thinking, closed-loop thinking, and ability to transfer models to other situations across multiple learning environments); (b) recording the type and frequency of specialized language used within each domain/node; (c) noting the kinds of social activity evident per node; and (d) capturing other important information such as the learning tools used, identities afforded by each site, artifacts produced, shared norms, physical (or virtual) space, and time allocated per activity in a given location.
3.3. Assessment Tasks As noted earlier, we are using existing instruments to assess our three focal competencies during this 18-month project. Systems thinking is being assessed using a modified version of the protocol described in Torres‘ recent (2009) dissertation on the topic, which in turn was based on the protocol described in Sweeney and Sterman (2007). There are 12 items in this assessment, with different examples of systems used across administrations (e.g., hunger/eating vs. predatory/prey relations). Teamwork and time management skills are measured via instruments that have been designed, developed, and validated by the Educational Testing Service for use by middle school
2
This protocol applies to observations of students, but also to observations of the teacher as well as the physical characteristics of the classroom, to inform context.
19
students (see, for example, MacCann, Duckworth, & Roberts, 2009; Wang, MacCann, Zhuang, Liu, & Roberts, 2009; Zhuang, MacCann, Wang, Liu, & Roberts, 2008). The first teamwork assessment contained 57 Likert-scale items and 12 scenario-based items, but subsequent administrations of the assessment used fewer items (i.e., 22 Likert-scale items with the strongest weights on the three focal factors--cooperating, negotiating, and influencing others, along with 12 scenario-based items). The first time management assessment contained 36 Likert-scale items, and subsequent administrations employed only 24 items (again, those weighting most strongly on the focal two factors--making plans and meeting deadlines). Example items (with text boxes for entering constructed responses) from the systems thinking protocol include: How are hunger and eating related or connected to each other? If you just finished eating, what happens to your level of hunger over time? Can you think of another situation that feels or seems like the same as this? Rubrics have been adapted from Torres‘ (2009) and Sweeney and Sterman‘s (2007) research to score the responses. For instance, there are five levels for the systems thinking rubric (from 0 to 4). Each level contains a description as well as several exemplar responses for each of the three main variables: dynamic thinking, closed-loop thinking, and transfer of models (i.e., Level 0: Incorrect or non-applicable response; Level 1: Describes static interconnections; Level 2: Describes aspects of system structures and behaviors; Level 3: Demonstrates understanding of principles guiding system behaviors (though descriptions may be limited); and Level 4: Full utilization of systems intelligence, such as a description of a system at multiple levels). Example items from the teamwork survey (with 5-point Likert-scale responses, from never to always) are: I don‘t have an opinion until all of the facts are known; I know how to make other students see things my way; I give in when arguing; I find it difficult to keep team
20
members on task; and I am a good listener. Finally, some items from the time management survey (similarly on a 5-point Likert scale, from never to always) include: I have a messy room; I complete my homework on time; I put off tasks until the last minute; I keep my desk neat; I like routine; I do my homework as soon as I get home from school; and I lose things. Prior to data analysis, some items were reverse coded so that all items would be in the same direction (i.e., higher values = more often or more positive). The student assessments occur at six-month intervals, including the initial and final weeks of this 18-month period, yielding four different data collection times (i.e., September 2009, March 2010, September 2010, and March 2011). This enables us to capture the current levels of the competencies, and monitor their development over time. The assessments take approximately 30 minutes per competency, and are administered during non-academic periods, staggered across two days (i.e., one on one day and two on the next) to attenuate fatigue. Traditional achievement testing occurs as part of normal NY state requirements for sixthgrade students. We plan to compare achievement (mathematics and reading) scores at the end of the 18-month period between (a) Quest to Learn students, and (b) a group of comparable students from the two middle schools we've identified as part of the New York Public School System, matched demographically. All data are being collected and analyzed within the guidelines and with the approval of the FSU and NY DOE Institutional Review Boards.
4. Preliminary Findings 4.1. School Data Figure 3 shows the primary variables or objectives comprising our Q2L model. These were found to define the core goals and values of Q2L and its learning system. Each of these will be briefly described, along with a selected quote from the interviews. 21
Culture. The theme of culture permeated the interview data, with a majority of participants posing it as a critical aspect defining the school‘s success. Overall, culture represents the social-emotional environment of the school, including various relationships among adults and students, and the rituals and procedures needed to support and promote a culture of kindness, inclusivity, and appreciation of diversity. Additionally, a school-wide focus of systems thinking and design thinking are core thrusts that define a culture of innovation at Q2L. "This attention to the cultivation of a community and culture is the number 1 thing right now – in order to be able to do all the other stuff. Because if you don’t get that right, it actually doesn’t matter all of the other stuff."
Figure 3. Overview of the primary Q2L goals Systems Thinking. Generally, this competency represents a way of constructing meaning from an analysis of the whole and its parts. This involves, in part, the integration of new types of thinking, including dynamic thinking, closed-loop thinking, and the ability to transfer one model 22
to another situation or phenomenon. Integration is achieved via specially-crafted missions and quests, specialist language used, opportunities for application across learning nodes, and effective assessment. "If students can see how everything comes together, then there's nothing they can't understand. Many people get caught up in thinking in a very small scale, but everything is connected, so once you understand that nothing is by itself, then every time you learn something new, figure out where that fits in according to the system." Design Thinking. This competency is supported when a person engages in opportunities to tinker (i.e., experiment and ―mess around‖), prototype models, play-test (to generate feedback), and redesign. Design thinking also requires opportunities to innovate around an idea or artifact after considering the historical context of that idea, possible new ways to iterate and gather feedback, and aesthetic coherence. "Now we’re designing experiences.
Now we’re
designing environments. If we're designers, then we also iterate. If we’re real designers, we look at how something happened and we can then consider it, step back, and go through a design process. How did that work? Why did that not work? How do we change it? So the whole process of teacher as designer and people who iterate on their work comes from this idea that we’re worried about learning in context." Game-based Pedagogy. Physical and virtual learning experiences are designed so that students step into situated and immersive spaces where there is a problem to solve. Environments are designed to be immersive contexts where students learn to be (historians, mathematicians) vs. just learn about content knowledge. Learning to be requires that students employ behaviors and problem solving techniques endemic to the members of real-world knowledge domains (e.g., Gee & Shaffer, 2010). Students understand the purpose for solving problems and take specific and strategic actions to solve them. Problems are solved using both individually-driven strategies
23
and in collaboration with others. ―It’s a unique pedagogy. And within the vision, there’s a responsibility on the teachers, the curriculum designers, and the game designers to take a childcentered and interest-driven approach and create something--create the mission, create the experience for the students to have that is immersive and takes their interests into account.‖ Managing Resources. At the highest level (i.e., administrative), this variable requires recognizing and strategically deploying policy-reform initiatives such as DOE waivers, managing communications, and crafting publications about Quest to Learn. At the learning level, this competency relates to the students' and teachers' abilities to synthesize and deploy the everincreasing amounts of available information, as well as to effectively plan and meet deadlines. "At the earlier levels of synthesis, it means being able to discern credible sources, to be able to deal in the large body of crazy amounts of information. What is correct? What is useful for me as a learner for my particular purpose? That even involves [figuring out] where to go look for things and when I go look, how do I determine whether it’s credible, or useful, or good or bad? So it is about aggregating, remixing, and reformulating in a novel way." Teamwork. Students and staff collaborate, in various and changing configurations, to meet common goals, support and learn from each other, resolve conflicts, and solve problems. They are open to new ideas, help others, and continually reflect on their own actions and contributions to their teams. Effective communication is key to successful collaboration within teams. "When you put different people together of different backgrounds and different qualifications and skills, then that’s when you have innovation. So I think that’s a model for our team, but it's also important for the school and for the students. Everybody has real different interests, and together we can make something new. And that moment when kids actually make something new and it’s successful, it’s like they’re in heaven, really. It’s just the best feeling!"
24
Successful Teacher. A successful Quest to Learn teacher works closely and collaboratively with other staff and with students, experiments with games-based learning approaches to teaching and learning, is inquisitive about deep learning, has expertise in development and assessment, and is committed to educational change. With game designers and curriculum directors, Q2L teachers strive to design effective game-based and immersive learning environments. As a core strategy to developing innovative thinkers and inventors, teachers engage students in solving system and design-based problems. ―For teachers, there needs to be a huge amount of self-reflection, and really thoughtful tinkering, like coming up with a well thought out plan, and then testing it out, and then reflecting on how that goes. Playing around with their ideas, and then coming up with something new, and trying it out.” Successful Learner. Successful Q2L learners develop emotional intelligence, and systemic and design reasoning skills. They learn to solve and innovate for complex 21st century problems, and to select and discern credible sources of information. They also become adept at using technological tools as research, design, and computational resources. Successful learners, ―seek out answers for questions that they’re genuinely curious about, and can also understand, or at least see, and talk about the big picture, like why they’re learning the things that they’re learning, not just because it’s what’s next on the schedule. A successful learner enters the topic from their own point of interest... and is also curious enough to grab on to those connections, or maybe make up some of those connections, is persistent… and willing to work through challenges.‖ We now turn our attention from the school level variables toward student level assessment.
4.1. Student Data 25
Assessments of the three competencies (systems thinking, teamwork, and time management) are scored upon completion. This includes a numeric value on the general competency (e.g., teamwork), as well as scores on sub-skills (e.g., teamwork consists of three sub-skills: cooperating, negotiating, and influencing others). If students are interested, they may view their scores and sub-scores. There is no evaluative feedback associated with any score. Because this is not an experimental study, and there are no explicit interventions (apart from the school itself), students may be informed that, like in games, they should try to score higher, the next time around. Teachers, in turn, may use the assessment information to guide their teaching. For instance, if the teachers see that many of their students scored low on ―cooperation,‖ then he/she could create situations to facilitate teamwork and cooperation. Related research outside the scope of this project may observe teachers in the classroom to see what they do in response to obtaining scores from assessments (e.g., change lesson plans to bolster students‘ shortcomings, carry on as planned, etc.). Perhaps the ones who are more adaptive are also the more effective teachers.
4.1. 1. Systems Thinking Internal Reliability. The first question we examined was whether our 12-item, systems thinking assessment was a reliable tool, particularly since it (a) used a constructed response format, and (b) was administered with a paper-and-pencil format for administration 1 (September 2009) and an online format for administration 2 (March 2010). All subsequent administrations will be online. To determine the reliabilities of the two assessments (at different times and in different formats), we computed Cronbach's alpha for each administration: (a) for ST (time 1), α = .85, and (b) for ST (time 2) α = .86. Thus both ST assessments are similarly reliable.
26
Inter-rater Reliability. Given our use of two separate teams of scorers (i.e., two people in New York City, and two people at Florida State University), we needed to determine inter-rater reliability regarding the scores on the ST assessment. For administration 1, Kendall's tau = .83 (and Spearman's rho = .87). For administration 2, Kendall's tau = .86 (and Spearman's rho = .96). Scoring in the first administration was accomplished by the two teams independently scoring all N = 72 students' constructed responses using our 5-point (levels 0-4) rubric. Both teams (a) recorded their scores in an Excel spreadsheet, then (b) exchanged spreadsheets, and (c) highlighted scores that differed by > 2 points. The highlighted scores were then discussed and rescored; in some cases converging on the same number, and in other cases changing to scores that differed by only one point. In the first administration of the ST assessment, this exchangediscuss-revise process required two full iterations until no scores were > 1 point different. By the time of the second administration, and using the same teams, only one iteration was required, with only a few discrepant scores requiring discussion. Mean ST Differences from Time 1 to Time 2. Recall that we are interested in analyzing changes that may occur in terms of students' competencies over time at Q2L. We currently have data from two administrations, spaced six months apart. For the 12 questions in the ST assessment, we computed a single mean score for each person. The rubrics ranged from 0-4, where higher is better. For the first (September 2009) administration, M = 0.78; SD = 0.50; N = 60 (excluding cases with missing data). In March, M = 1.02; SD = 0.58; N = 60. Students showed significantly greater ST skills on the second, compared to the first, administration, t59 = 3.31; p < .01, suggesting growth of this competency, overall.
4.1. 2. Teamwork
27
Internal Reliability. Similar to the ST assessment, our teamwork (TW) assessment was administered at time 1 in a paper-and-pencil format, and at time 2 online. This assessment contained 57 items for the first administration, then 22 items on the second. We computed Cronbach's alpha for each administration: (a) for TW (time 1), α = .89, and (b) for TW (time 2) α = .83. Thus both TW assessments are similarly reliable, which was encouraging because the shorter assessment (with 35 of the original 57 items removed) was found to be very reliable. (Note that the items were scored automatically, thus there was no need to compute an inter-rater reliability score). Construct Validity. The literature that we reviewed on this construct and for this age group (teenagers) indicated three distinct factors: (1) cooperating, (2) negotiating, and (3) influencing others (the latter also called "leadership" in the literature) (see Zhaung et al., 2008). We began by reverse coding three items (which had been phrased in an opposite manner from the construct--such as item 25, "I don't like working with others"), so all would be on the same scale. Next, we computed exploratory factor analyses (EFAs) using principal factor analysis with promax rotation for the student self-report scale. Table 1 shows our three-factor solution which cleanly matches the results described in the Zhaung et al. study. The item numbers are from the first administration, but the same set of 22 items were used in the second administration (and will be used in the third and fourth administrations as well). Mean TW Differences from Time 1 to Time 2. For the items on the first TW assessment that matched the same 22 items on the second, we computed a single mean score for each person. The scale ranged from "never" to "always," coded from 1-5, so higher was better, with 3 as the middle/neutral value. For the first (September 2009) administration, M = 3.39 (a little above the mid-point of TW); SD = 0.56; N = 47 (excluding cases with missing data). In March, M = 3.36;
28
SD = 0.48; N = 47, and, t46 = 0.41 (not significant). Thus students showed no overall difference in relation to their TW skills from the first to second administrations. Table 1. Factor Loadings of the Student Self-Report Teamwork Scale
Factor 1
2
3
56. I am inspired by others' ideas and thoughts.
.82
.14
.19
55. I think that trading ideas among students leads to the best solutions.
.68
.19
.01
33. Feedback is important to me.
.61
.21
.37
23. I enjoy helping team members.
.60
-.02
.28
12. I am flexible when doing group projects.
.53
.16
.38
50. I know when to step in when an argument starts getting out of control.
.52
.07
.21
54. I learn from other students.
.49
-.04
.09
40. I find it easy to approach others.
.47
.18
.17
51. I'm influenced by other students' opinions.
.45
.04
.08
47. I believe that I'm a good leader.
.39
.79
.21
20. I like to be in charge of group projects.
.12
.79
.17
48. I can convince my peers about anything.
.03
.76
.31
49. I can fight for a cause that I believe in.
.23
.70
.25
5. I know how to make other students see things my way.
.03
.57
.14
-.34
.39
-.12
39. I suggest different solutions to problems.
.24
.31
.62
27. I can make deals in any situation.
.14
.28
.61
42. I enjoy bringing team members together.
.46
.25
.58
34. I like to solve problems using different tactics.
.25
.18
.55
-.12
.04
.48
18. I like being responsible for projects.
.19
.10
.40
25. I like working with others
.13
-.09
.36
35. During group assignments, I make demands on other students.
4. I don't have an opinion until all of the facts are known.
Extraction Method: Principal Axis Factoring. Rotation Method: Promax with Kaiser Normalization. Cooperating
Influencing Others
Negotiating
29
4.1. 2. Time Management Internal Reliability. Similar to the ST and TW assessments, our time management (TM) assessment was administered at time 1 in a paper-and-pencil format, and at time 2 online. This assessment contained 36 Likert-scale items for the first administration, and 24 items on the second. We computed Cronbach's alpha for each administration: (a) for TM (time 1), α = .82, and (b) for TM (time 2) α = .82. Thus both TM assessments are similarly reliable. Construct Validity. The literature that we reviewed for this construct and age group (middle-school students) indicated two distinct factors comprising time management: (1) planning, and (2) meeting deadlines (see Liu et al., 2009, based on N = 814 students). We began by reverse coding several items so all items would be on the same scale. Next, we computed exploratory factor analyses (EFAs) using principal factor analysis with promax rotation for the student self-report scale. Table 2 shows our two-factor solution which aligns with the structure described in the Liu et al. study. The same 24 items will be used in the third and fourth administrations as well as this assessment. Mean TM Differences from Time 1 to Time 2. For the items on the first TM assessment that matched the same 24 items on the second, we computed a single mean score for each person. The scale ranged from "never" to "always," coded from 1-5, so higher was better, like with TW. For the first (September 2009) administration, M = 2.77 (a little below the mid-point); SD = 0.57; N = 54 (excluding cases with missing data). In March, M = 3.19; SD = 0.71; N = 54. Students showed significant improvements on their time management skills after six months at Q2L (t53 = 5.74; p < .01.
30
Table 2. Factor Loadings of the Student Self-Report Time Management Scale Item
F1
F2
12. Each day, I spend a few minutes planning what I am going to do tomorrow.
.69
.56
15. I like to make lists of things to do.
.69
.30
21. I have already planned all the things I am going to do tomorrow.
.66
.59
13. I mark dates that are important to me on a calendar.
.64
.17
22. I am early for practice (sports, music) or anything I might do after school.
.56
.22
7. I like to make schedules.
.55
.40
5. I like routine.
.49
.31
17. I keep my locker neat.
.47
.06
24. I know what I want to do next weekend.
.42
.28
8. I write tasks down so I won't forget to do them.
.41
.16
10. I use computers or cell phones to remind me of deadlines.
.37
.08
11. I know what is in my backpack.
.29
.19
18. I'm rarely late for breakfast.
.28
.11
4. I keep my desk neat.
.26
.03
9. When I am going somewhere, I am never late.
.16
.64
23. I am one of the first people to get to class.
.36
.63
6. I am never (or rarely) late for class.
-.05
.61
19. I finish tests with plenty of time to go over my answers.
.37
.60
2. I never put off tasks until the last minute.
.11
.55
20. I plan events ahead of time with my friends.
.41
.49
1. I complete my homework on time.
.36
.47
3. When I have to be somewhere, I arrive on time.
.44
.44
14. People never complain that I am late.
.03
.43
16. My teachers are glad that I'm never late for class.
.22
.29
Making plans
Meeting deadlines
31
5. Discussion Like games, which instantiate learning contexts, the goal of the Q2L learning model is to design rich learning environments and experiences that mirror discourse communities. In this way, the unit of analysis is not the individual alone (as is characteristic of schools and approaches to student assessment), but learner-in-context, considering not only her development, but the degrees to which the context (e.g., physical or virtual spaces, teachers, tasks, peers, tools) afford and mediate intended learning outcomes. The methodological problem we are tackling in this ongoing research concerns the best way to effectively conjoin the wealth of quantitative and qualitative data from this innovative new school (Q2L) to yield a clear, accurate, valid, and timely depiction of (a) the school's important goals/values, and (b) its support of students' acquisition of new competencies, in-situ. We have chosen to use evidence-centered design as our approach to modeling the school and assessing student competencies. Our claim is that ECD is a very useful tool for capturing individual student data, and it allows us to correlate that data against qualitative data to understand kids in context. Early results are encouraging. In relation to the school-level model (and its associated sub-models), within a couple of months we succeeded in inducing six main "themes" from the corpus of interview data. Interestingly, those same themes have remained in place across various exchanges with the participants (see Figure 3). Minor tweaking is ongoing with regard to the lowest-level "indicators" (i.e., the measurable variables). In terms of the student-level development of new competencies, we have seen some demonstrable student gains in just six months on two out of our three select competencies. We have also ascertained that our instruments are reliable and valid, even when shortened and administered online.
32
We are confident that our methodological approach is sound and can continue to bring together observational data (via Q2L's complex and distributed learning context) with quantitative data to allow us to make claims as to why learning happened or did not. Furthermore, we believe that this approach (and the particular models that we've developed) can be used to assess other game-based environments, and also be employed in other studies concerned with learning in context. A major concern (and stumbling block) for projects like this is how to best account for both context and hard learning data when assessing the effectiveness of the learning environment. The core of Q2L‘s innovation is its insistence that context is inseparable from learning, and that accounting for context effects is critical if we are to understand not only why kids learn or not, but to increasingly understand how to enable learning. Therefore given Q2L‘s insistence on the design and understanding of context (which should put overall education practices on notice since it's becoming increasingly clear that deep meaning making occurs in discourse communities like games), a qualitative and quantitative endeavor is crucial for capturing (1) learning (or discourses and their development) in situ, as well as (2) measurable data of school and student-level performance. Our ECD-based research and analysis program, integrating qualitative data (outside the scope of this chapter) with quantitative data is intended to give us insight into both situ learning and individual student learning. In closing, we reiterate that this chapter represents our initial research efforts using ECD as our methodological approach to assessing Q2L. The processes that we've undertaken, as well as the data collected and analyzed to date, suggest that the approach is very fruitful for our purposes. It's important to note, however, that even when our 18-month project concludes, because it is "exploratory," there will remain a lot of important questions concerning the school and the individuals therein. The good news is that we have set up the infrastructure (e.g.,
33
competency, objective, evidence models) that can begin to answer these questions systematically and accurately about what works, what does not, and why, in ongoing, longitudinal studies spanning multiple years.
Author Notes We'd like to offer special thanks to Connie Yowell and the John D. and Catherine T. MacArthur foundation for funding this research, and Katie Salen who generously helped make this research happen and also spent quality time being interviewed herself. We are indebted to Loretta Wolozin for her awesome classroom observations and careful ST scoring; and to Oktay Donmez, Umit Tokac, and Lilian Torres for their marathon scoring efforts. We thank Jim Gee for his intellectual support, and Rim Razzouk and Marilyn McGhee for helping flesh out the culture model. Finally, we would like to thank the all of the teachers, designers, and students at Q2L for welcoming us into their world, and Barbara Davis for her assistance with the interviews and induction of themes.
References Assaraf, O. B.-Z., & Orion, N. (2005). Development of system thinking skills in the context of earth system education. Journal of Research in Science Teaching, 42(5), 518-560. Barak, M., & Williams, P. (2007). Learning elemental structures and dynamic processes in technological systems: A cognitive framework. International Journal of Technology and Design Education, 17(3), 323-340. Bransford, J., Brown, A., & Cocking, R. (2000). How People Learn: Brain, Mind, and Experience & School. Washington, DC: National Academy Press. Bridgeland, J., Dilulio, J., & Morrison, K. (2006, March). The silent epidemic: Perspectives of high school dropouts. A report by Civic Enterprises in association with Peter D. Hart Research 34
Associates for the Bill & Melinda Gates Foundation. Retrieved May 10, 2010, from http://www.civicenterprises.net/pdfs/thesilentepidemic3-06.pdf Bruner, J. S. (1961). The act of discovery. Harvard Educational Review 31 (1), 21–32. Falmagne, J.-C., Cosyn, E., Doignon, J.-P., & Thiery, N. (2003). The assessment of knowledge, in theory and in practice. In R. Missaoui & J. Schmidt (Eds.), Lecture notes in computer science: Vol. 3874: 4th International conference on formal concept analysis (pp. 61–79). New York: SpringerVerlag. Forrester, J. W. (1994). System dynamics, systems thinking, and soft OR. System Dynamics Review, 10(2-3), 245-256. Gee, J. P. (2003). What video games have to teach us about learning and literacy. New York: Palgrave/Macmillan. Gee, J. P. (2008). Video games, learning, and ―content.‖ In C. Miller (Ed.), Games: Purpose and potential in education. Boston, MA: Springer. Gee, J. P. (in press). Human action and social groups as the natural home of assessment: Thoughts on 21st century learning and assessment. To appear in V. J. Shute & B. J. Becker (Eds.), Innovative assessment for the 21st century: Supporting educational needs. New York, NY: Springer-Verlag. Gee, J. P., & Shaffer, D. W. (2010). Looking where the light is bad: Video games and the future of assessment (Epistemic Games Group Working Paper No. 2010-02). Madison: University of Wisconsin-Madison. Ito, M., Horst, H., Bittanti, M., boyd, d., Herr-Stephenson, B., Lange, P. G., Pascoe, C. J., & Robinson, L. (2008). Living and learning with new media: Summary of findings from the Digital Youth Project. Chicago, IL: The John D. and Catherine T. MacArthur Foundation Reports on Digital Media and
Learning. Lave, J., & Wenger, E. (1991). Situated learning: Legitimate peripheral participation. Cambridge: Cambridge University Press.
35
Ito, M., Baumer, S., Bittanti, M., boyd, d., Cody, R., Herr-Stephenson, B., et al. (2010). Hanging out, messing around and geeking out: Kids living and learning with new media. Cambridge, MA: MIT Press. Liu, O. L., Rijmen, F., MacCann, C., & Roberts, R. D. (2009). Measuring time management abilities for middle school students. Personality and Individual Differences, 47, 174-179. Macan, T. H., Shahani, C., Dipboye, R. L., & Phillips, A. P. (1990). College students‘ time management: Correlations with academic performance and stress. Journal of Educational Psychology, 82, 760768. MacCann, C., Duckworth, A. L., & Roberts, R. D. (2009) Empirical identification of the major facets of Conscientiousness. Learning and Individual Differences, 19, 451-458. Mislevy, R.J., Steinberg, L.S., & Almond, R.G. (2003). On the structure of educational assessments. Measurement: Interdisciplinary Research and Perspectives, 1(1), 3-62. National Educational Research Plan (March, 2010). Retrieved May 9, 2010, from http://www.ed.gov/technology/netp-2010. Ossimitz, G. (2000). The development of systems thinking skills using system dynamics modeling tools. Retrieved May 10, 2010, from Universität Klagenfurt, Institut für Mathematik, Statistik und Didaktik der Mathematik Web site: http://wwwu.uni-klu.ac.at/gossimit/sdyn/gdm_eng.htm. Palfrey, J., & Gasser, U. (2008). Born digital: Understanding the first generation of digital natives. New York: Basic Books. Quinn, C. (2005). Engaging learning: Designing e-learning simulation games. Pfeiffer: San Francisco. Richmond, B. (1993). Systems thinking: Critical thinking skills for the 1990s and beyond. System Dynamics Review, 9(2), 113-133. Roberts, R. D., Schulze, R., & Minsky, J. (April, 2006). The relation of time management dimensions to scholastic outcomes. Presentation at 2006 Annual Meeting of the American Educational Research Association, San Francisco, CA.
36
Rysavy, D. M., & Sales, G. C. (1991). Cooperative learning in computer-based instruction. Educational Technology Research & Development, 39(2), 70-79. Salen, K., Torres, R.J., Ruff-Tepper, R., Shapiro, A., Wolozin, L., (in press).. A Quest to Learn planning document: Growing the school for digital kids. MacArthur Foundation White Paper, Cambridge, MA: MIT Press. Salisbury, D. F. (1996). Five technologies for educational change: systems thinking, systems design, quality science, change management. Educational Technology Publications. Shute, V. J. (2008). Focus on formative feedback. Review of Educational Research, 78(1), 153-189. Shute, V. J., Hansen, E. G., & Almond, R. G. (2008). You can‗t fatten a hog by weighing it—Or can you? Evaluating an assessment for learning system called ACED. International Journal of Artificial Intelligence and Education, 18(4), 289-316. Shute, V. J., Rieber, L., & Van Eck, R. (in press). Games . . . and . . . Learning. To appear in R. Reiser & J. Dempsey (Eds.), Trends and issues in instructional design and technology, 3rd Edition, Upper Saddle River, NJ: Pearson Education, Inc. Shute, V. J., Masduki, I., Donmez, O., Kim, Y. J., Dennen, V. P., Jeong, A. C., & Wang, C-Y. (2010). Modeling 21st century knowledge and skills in game environments. In D. Ifenthaler, P. PirnayDummer, N. M. Seel (Eds.), Computer-based diagnostics and systematic analysis of knowledge (pp. 281-309). New York, NY: Springer-Verlag. Shute, V. J., Ventura, M., Bauer, M. I., & Zapata-Rivera, D. (2009). Melding the power of serious games and embedded assessment to monitor and foster learning: Flow and grow. In U. Ritterfeld, M. Cody, & P. Vorderer (Eds.), Serious games: Mechanisms and effects (pp. 295-321). Mahwah, NJ: Routledge, Taylor and Francis. Shute, V. J. & Zapata-Rivera D. (2008). Evidence-centered evaluation. Unpublished document. Florida State University.
37
Shute, V. J. & Zapata-Rivera, D. (2008). Using an evidence-based approach to assess mental models. In D. Ifenthaler, P. Pirnay-Dummer, & J. M. Spector (Eds.), Understanding models for learning and instruction: Essays in honor of Norbert M. Seel (pp. 23-41). New York: Springer. Sweeney, L. B., & Sterman, J. D. (2000). Bathtub dynamics: Initial results of a systems thinking inventory. Systems Dynamics Review, 16(4), 249-286. Sweeney, L. B., & Sterman, J. D. (2007). Thinking about systems: Student and teacher conceptions of natural and social systems. System Dynamics Review, 23(2/3), 285-312. Thai, A., Lowenstein, D., Ching, D., & Rejeski, D. (2009). Game changer: Investing in digital play to advance children’s learning and health. New York, NY: The Joan Ganz Cooney Center at Sesame Workshop. Tindale, R. S., Stawiski, S., & Jacobs, E. (2008). Shared cognition and group learning. In V. I. Sessa & M. London (Eds.), Work group learning: Understanding, improving and assessing how groups learn in organizations (pp. 73-90). New York: Lawrence Erlbaum Associates. Torres, R. J. (2009, April). Learning on a 21st century platform: Gamestar Mechanic as a means to game design and systems-thinking skills within a nodal ecology. New York University: ProQuest Dissertations. Torres, R. J., Rufo-Tepper, R., & Shapiro, A. (in press). Quest to Learn: A public school for today's digital kids. To appear in H. Gautchi & M. Manafy (Eds.), How digital natives are transforming the way business is done today. Medford, NJ: Cyberage Books. Totten, S., Sills, T., Digby, A., & Russ, P. (1991). Cooperative learning: A guide to research. New York: Garland. Van den Bossche, P., Segers, M., & Kirschner, P. A. (2006). Social and cognitive factors driving teamwork in collaborative learning environments. Small Groups Research, 37, 490-521. Vygotsky, L. S. (1978). Mind in society: The development of higher psychological processes. Cambridge, MA: Harvard University Press. Published originally in Russian in 1930. Vygotsky, L. S. (1987). The collected works of L. S. Vygotsky. New York: Plenum. 38
Wang, L., MacCann, C., Zhuang, X., Liu, O. L., & Roberts, R. D. (2009). Assessing teamwork skills: A multi-method approach. Canadian Journal of School Psychology, 24, 108-124. Watkins, S. C. (2009). The young and the digital: What the migration to social-network sites, games, and anytime, anywhere media means for our future. Boston: Beacon Press. Zhuang, X., MacCann, C., Wang, L., Liu, O. L., Roberts, R. D. (2008). Development and Validity Evidence Supporting a Teamwork and Collaboration Assessment for High School Students, ETS Research Report, RR-08-50, Princeton, NJ.
39
Appendix: Quest to Learn Success Model (Objectives/Goals)
40
41
42
43
44
45
46
47
48
49
50
51


![Where will BI and Search engines converge? - Wipro [PDF]](https://m.moam.info/img/260x300/where-will-bi-and-search-engines-converge-wipro-pd_64a5d77d098a9e772c8b45e5.jpg)