1
Whey ultrafiltration: Effect of operating parameters on flux and rejection N.M. D’Souza1,a#, D.E. Wiley1,b∗ 1 UNESCO Centre for Membrane Science and Technology, School of Chemical Engineering and Industrial Chemistry, The University of New South Wales, Sydney, NSW 2052, Australia. a Tel. +61 (2) 9385-4320; Fax +61 (2) 9385-5966; email:
[email protected] b Tel. +61 (2) 9385-4304; Fax +61 (2) 9385-5966; email:
[email protected]
Abstract Variations in permeate flux and rejection coefficients in response to changes in process operating conditions (temperature, transmembrane pressure, cross-flow velocity, feed concentration and pH) were analysed by means of fractional factorial design experiments to assess the significance of the effects of these process parameters. The bench-top trials have identified that all the five parameters had a significant effect on permeate flux and rejection of total solids. Cross-flow velocity and pH were the only parameters that did not influence rejection of lactose. Temperature did not have a significant effect on rejection of ash, lactose and fat, while transmembrane pressure and feed concentration did not influence ash or fat retention. None of the process parameters had a significant effect on protein retention. Empirical equations of statistical significance were generated to describe flux and rejection as a function of the five operating parameters.
1. Introduction Processing of dairy fluids causes the formation of both organic (fats and proteins) and inorganic (mineral salts) deposits on the membranes. Permeate flux declines from the very beginning of filtration, falling rapidly at first and then declining at a slower rate. Eventually the flux declines to such a low level that processing must be stopped and the membrane system cleaned. The flux decline has been attributed to concentration polarisation and membrane fouling. Optimisation of operating conditions during processing can help reduce fouling, as cleaning not only incurs direct costs but also reduces production time and overall plant productivity. The effects of the five operational factors of temperature, transmembrane pressure, cross-flow velocity, feed concentration and pH are discussed below. Increasing temperature results in a decrease in the viscosity of the processed fluid, which reduces the resistance to flow and promotes turbulence and on the other hand, also increases diffusivity and hence the rate of transport of solutes carried away from the membrane surface and back into the bulk stream. Increasing temperature should therefore result in higher flux, but may also result in a decrease in flux for certain feeds due to decreases in solubility of feed components at higher temperatures or changes in fouling. There is thus a balance between an increase in flux and an increase in convection and back-diffusion, and possible changes in fouling or retention. According to the gel polarisation model, flux increases with the increase of applied pressure until the concentration reaches a limit where a gel is formed and flux becomes independent of pressure. Further increase in applied pressure results in a temporary increase in flux. This pressure increase raises the driving force for ultrafiltration (UF) but does not affect transport of solutes back into the bulk stream. Instead a thicker and denser gel layer is formed which reduces flux until it returns to its initial steady state value. Increasing pressure
* #
Corresponding author Presenting author
2 over a critical point may also result in a lower flux due to compaction of the gel layer formed and the consequent increased hydraulic resistance [1,2]. Higher shear rates at the membrane surface are an important factor in combating membrane fouling, as the deposited materials are continuously removed thus reducing the hydraulic resistance of the fouling layer. Too low a velocity leads to increased concentration polarisation and fouling, resulting in rapid flux decrease and the need for frequent cleaning. Increasing the cross-flow rate generally results in an improvement in permeate flux. However this can also produce some surprising effects. The retention of proteins β-lactoglobulin and α-lactalbumin was found to decrease with increasing velocity, contrary to the result expected from the concentration polarisation theory [3]. As the concentration of solutes in the feed increases, the solution viscosity and density increase and the diffusivity of a given solute decreases. These changes act to decrease the absolute value of flux and higher feed concentrations will also aggravate fouling [1]. Flux will decrease exponentially with increasing feed concentration as stated by the film model. Increasing the feed concentration has little effect on the membrane retention characteristics, except where the solute size changes with concentration. Where surface fouling occurs, increasing concentration has little effect on irreversible membrane fouling but causes an increase in reversible fouling [3,4]. When internal membrane fouling dominates, increasing the concentration results in a more rapid loss of permeate flux with time. This may be due to the increased exposure of the membrane to solute with increasing concentration. However, at high concentrations, cake or surface fouling is likely to dominate [5]. Flux is lowest at the iso-electric point (IEP) of the protein and is higher as the pH is moved away from the IEP. Changes in pH affect the solubility and conformation of proteins. The solubility of a protein is generally lowest at the IEP and increases as pH is adjusted away from it. The interaction between proteins and membranes also changes with pH. Flux values for whey are high below pH 3.0 and low at about pH 4.0-5.0. As the pH is increased further, permeation rates improve with sweet cheese whey. The solubility of minerals such as calcium is also pH and temperature dependent, and decreases as both temperature and pH increase. Increasing the pH of whey will increase the amount of insoluble calcium salts, which will precipitate out on the membrane and increase fouling. A lower pH increases the solubility of the salts, with less chance of their being deposited on the membrane and greater chance of their permeating through the membrane [6]. A priori prediction of fouling is problematical. The development of an accurate and reliable model of membrane system behaviour with good predictive capabilities requires fundamental data about fouling. Such data would provide a reliable basis for process improvements and new product developments. The aim of this paper was to study the effect of five operating parameters (temperature, transmembrane pressure (∆PTM), feed concentration, cross-flow velocity and pH) on permeate flux and rejection during the UF of whey using a statistical factorial design. Factorial designs are widely used to study the effect and interaction of several factors on a response. The factors are investigated simultaneously, each being studied at two or more levels. It thus requires the smallest number of experimental runs while testing all possible combinations of the levels and factors. 2. Materials and methods 2.1 Experimental procedure A schematic of the experimental set-up (bench-scale) is presented in Figure 1. The set-up consists of a perspex module, housing a single flat sheet membrane of area 100 cm2. The membrane was a polysulphone Koch 5838 K131-NYT UF membrane (supplied by Murray
3 Goulburn Co-operative CO. Limited, Melbourne) with a nominal molecular weight cut-off of 10,000 Daltons. Retentate P1
Water
Feed
Alkali
Acid
Sanitiser
Membrane cell
Permeate
P2 Pressure control valve
Flowmeter
Balance Computer
Pump
: Pressure transducer P1 & P2
: Pressure guages
Fig. 1. Experimental set-up
Fouling was carried out for 3 hours according to the various conditions described in the fractional factorial design (Table 1), with both retentate and permeate streams being recirculated to keep feed concentration approximately constant. Whey solutions of different concentrations were prepared prior to each experiment by dissolving required quantities of non-hygroscopic sweet whey powder (supplied by Murray Goulburn Co-operative CO. Limited, Melbourne) in Milli-Q water. Permeate flux during fouling was monitored by recording the amount of permeate collected in a given time. A new membrane sample was used for each experiment. Feed, retentate and permeate samples were obtained for analysis of protein, ash, lactose, and total solids. Protein and lactose concentrations were measured using gel permeation chromatography. Total solids and ash were determined using standard methods [8]. Fat content was determined by difference using Eq.1. Fat content (%) = Total solids (%) – ash (%) – protein (%) – lactose (%)
(1)
The apparent rejection (R) of total solids, ash, protein, lactose and fat were determined using Eq.2. R = 1−
Cp Cr
(2)
where Cp and Cr are solute concentrations in the permeate and retentate streams, respectively. 2.2 Fractional factorial designed experiments Two response parameters, (a) permeate flux (in LMH), and (b) rejection, were chosen for study under varying operating conditions of temperature, cross-flow velocity, transmembrane pressure, feed concentration and pH. One half of the full 25 design (25-1 = 16 runs) was performed [9], based on the assumption that 3-, 4-, and 5-factor interactions are not significant compared to 2-factor interactions and single factor effects. The levels for the various process variables were determined by looking at typical ranges used in current dairy
4 applications. In order to estimate pure quadratic terms, ten “star” point runs were added. In addition, four centrepoint runs were also performed to construct an estimate of experimental error. The experimental results were analysed by multiple regression analyses using MINITAB (Minitab Statistical Software: Release 13 by Minitab Inc., USA). Significance was set at p = 0.1 (90% degree of confidence). The main objective of the analysis was to formulate a second order regression model to show the combined effect of the independent parameters investigated for rejection and flux using Eq.3. [10]. yˆ = b 0 + b1 T + b 2 ∆ PTM + b 3V + b 4 C + b 5 pH + + b11 T 2 + b 22 ∆ PTM2 + b 33V
2
+ b 44 C 2 + b 55 pH
2
(3)
+ b12 T ∆ PTM + b13 TV + b14 TC + b15 TpH + b 23 ∆ PTM V + b 24 ∆ PTM C + b 25 ∆ PTM pH + b 34 VC + b 35 VpH + b 45 CpH
where yˆ represents the estimated response for either flux or rejection, b0 is the average experimental response, coefficients b1 to b5 are the estimated effects of the factors considered, b12 to b45 are the first order (2-factor) interaction terms, and b11 to b55 are the second order (quadratic) terms. Table 1 Parameters and levels for experimental design Parameter/Factor
Temperature (T) Transmembrane pressure (∆PTM or P ) Cross-flow velocity (V) Concentration (C) pH
Level 1
Level 2
Centrepoint
16°C 100 kPa 0.5 m/s 0.3 %w/v 5
50°C 300 kPa 1.5 m/s 1.0 %w/v 7
33°C 200 kPa 1.0 m/s 0.65 %w/v 6
3. Results and Discussion Based on the multiple regression analyses of the experiments, equations 4 to 8 were obtained to show the effect of factors T, ∆PTM, V, C and pH on flux and rejection. Flux = 45.9 + 2.23T + 8.96∆PTM + 16.0V − 16.7C + 19.8 pH + 6.71 pH 2 − 5.56T∆PTM − 3.80TV + 3.80TC + 7.01∆PTM V − 6.44∆PTM C + 4.98∆PTM pH − 5.28VC + 6.75VpH − 10.2CpH Rtotalsolids = 0.243 − 0.0104T + 0.0357 ∆PTM + 0.0177V + 0.0157C − 0.0136 pH − 0.0163P 2 − 0.0213V 2 + 0.00669TV + 0.0209TC + 0.00931VC + 0.0141VpH
(4) (5)
R ash = −0.336V + 0.315 pH + 0.387TC + 0.496VC + 0.380VpH − 0.394CpH
(6)
Rlactose = −0.183∆PTM + 0.190C + 0.181T∆PTM + 0.228∆PTM C
(7)
R fat = 0.838 − 0.585V − 0.290 pH − 0.382TP − 0.522TV − 0.527TpH + 0.518∆PTM V + 0.553∆PTM pH + 0.767VC + 0.430VpH + 0.341CpH
(8)
From the summaries of the multiple regression analyses, factors T, ∆PTM, V, C and pH had a significant effect on flux since the p-values were less than 0.1. The quadratic term pH2, and interactions T∆PTM, TV, TC, ∆PTMV, ∆PTMC, ∆PTMpH, VC, VpH, and CpH also had a statistical impact on flux. Experiments showed an increase in flux with an increase in ∆PTM and cross-flow velocity and a decrease with lower pH conditions. Decreasing the feed
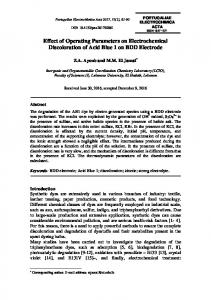
5 concentration also led to a larger flux. At low feed concentrations, increasing the pH from 5 to 7 resulted in a more dramatic increase in flux than at high feed concentrations. As shown in Figure 2a, a higher permeate flux was observed at higher values of ∆PTM (300 kPa) and cross-flow velocity (1.5 m/s). All these results are consistent with findings reported by other researchers [1,6,7,11]. All five factors, quadratic terms P2, V2, and interactions TV, TC, VC and VpH influenced total solids rejection. Factors ∆PTM, V and C had a positive effect on rejection while temperature and pH acted negatively. At high cross-flow velocities, increasing the feed concentration resulted in a greater retention of total solids. Factors V, pH, and interactions TC, VC, VpH and CpH were found to have a significant effect on ash rejection. At the low pH setting of 5, the rejection of ash decreased with an increase in cross-flow velocity (Figure 2b). Minerals such as calcium are more soluble as pH decreases and higher shear rates at the membrane surface are an important factor in combating fouling, as the deposited materials are continuously removed. The ∆PTM, feed concentration and interactions T∆PTM and ∆PTMC influenced lactose rejection. At the higher ∆PTM setting (300 kPa), the rejection of total solids increased while lactose rejection decreased. Permeation of lactose increased with increasing ∆PTM and decreasing feed concentrations. Rejection of lactose is due to the convective transport through the pores and so apparent rejection decreases with increasing pressure due to the increase in wall concentration. However, once fouling is initiated, rejection will begin to rise with flux/pressure. High flow rates at high pressures bring more solids to the membrane surface where the high pressure compresses the rejected solutes into a thicker and denser hydraulic barrier [6]. High cross-flow increases apparent or observed rejection by reducing the wall concentration.
0
75 65 55
Flux (LMH)
Rejection (Ash)
45
-1
-2
35
7
1.5
25 100
P (kPa)
1.0 200
300
V (m/s)
6
0.5
V (m/s)
0.5
1.0
(a)
(b)
2
Rejection (fat)
1.5
1
0 0.5
V (m/s)
1.0
1.5
0.3
0.7 0.6 0.5 0.4
0.8
1.0 0.9
C (%w/v)
(c) Fig. 2a. Flux as a function of transmembrane pressure and cross-flow velocity Fig. 2b. Ash rejection as a function of cross-flow velocity and pH Fig. 2c. Fat rejection as a function of cross-flow velocity and feed concentration
5
pH
6 Cross-flow velocity, pH and interactions TP, TV, TpH, ∆PTMV, ∆PTMpH, VC, VpH and CpH all had a significant effect on fat rejection. At low feed concentrations, decreasing the cross-flow velocity led to a greater retention of fat (Figure 2c). None of the five operating parameters had a statistically significant effect on protein rejection because it was always close to 100%.
4. Conclusions The fractional factorial design and the regression analysis methods have shown which factors influence permeate flux and rejection of total solids, ash, lactose and fat. The methods also helped estimate the main effects and the interaction effects of variables on the responses. The “star” point runs helped determine the quadratic effects.
Acknowledgements The authors would like to thank Dairy Australia (formerly known as the Dairy Research and Development Corporation) for their financial support and Murray Goulburn for providing whey powder.
References [1] M. Cheryan, Ultrafiltration and microfiltration handbook, Technomic Publishing Co., Inc., Lancaster, 1998. [2] E. Renner & M.H.A. El-Salam, Membrane Fouling - Problem and Treatment. In: Application of Ultrafiltration in the Dairy Industry, Elsevier Applied Science, London, 1991, pp. 78-111. [3] C. Taddei, P. Aimar, G. Daufin, & V. Sanchez, Factors affecting fouling of an inorganic membrane during sweet whey ultrafiltration, Lait, 68 (1988) 157-176. [4] G. Daufin, U. Merin, J.-P, Labbe, A. Quemerais, & F.L. Kerherve, Cleaning of inorganic membranes after whey and milk ultrafiltration, Biotechnol. Bioeng., 38 (1991) 82-89. [5] A.D. Marshall, P.A. Munro, & G. Tragardh, The effect of protein fouling in microfiltration and ultrafiltration on permeate flux, protein retention and selectivity: a literature review, Desalination, 91 (1993) 65-108. [6] K.P. Kuo & M. Cheryan, Ultrafiltration of acid whey in a spiral-wound unit: Effect of operating parameters on membrane fouling, J. Food Sci., 48 (1983) 1113-1118. [7] K.F. Eckner & E.A. Zottola, Modelling flux of skim milk as a function of pH, acidulant, and temperature, J. Dairy Sci., 75 (1992) 2952-2958. [8] Standards Association of Australia, General methods and principles – Determination of total solids and moisture (AS 2300.1.1) and Determination of ash (AS 2300.1.5), 1988. [9] D.C. Montgomery, Design and analysis of experiments, 3rd Edition, John Wiley & Sons, Singapore, 1991. [10] P.W. Araujo & R.G. Brereton, Experimental design 1. Screening and 2. Optimisation, Trends Anal. Chem., 15 (1996) 26-31 and 63-70. [11] T.E. Clarke & C.A. Heath, Ultrafiltration of skim milk in flat-plate and spiral-wound modules. J. Food Eng., 33 (1997) 373-383.