The study evaluated the energy output and plant capacity factor of ... Ozgener [7] presented energy analysis of the 1.5 kW small ..... Wind speed sensor, NRG#40.
Proceedings of ASME Turbo Expo 2014: Turbine Technical Conference and Exposition GT2014 June 16 – 20, 2014, Düsseldorf, Germany
GT2014-26592
WIND POWER OUTPUT PERFORMANCE HORIZONTAL AND VERTICAL AXIS WIND TURBINES FOR ISOLATED SMALL APPLICATIONS IN SAUDI ARABIA Luai M. Al-Hadhrami King Fahd University of Petroleum and Minerals Dhahran-31261, Saudi Arabia ABSTRACT The study evaluated the energy output and plant capacity factor of small wind turbines in the category of 3 – 10 kW rated power. The effects of hub height on energy output and the PCF have been studied. To achieve the set objectives, hourly average wind speed data measured at 10, 20, 30, and 40 meter and wind direction at 30 and 40 meter above ground level during July 01, 2006 to July 10, 2008 has been utilized. The highest percentage change in annual energy yield (AEY) was obtained for an increase in hub height from 20 to 30 m for both horizontal and vertical wind turbines used in this study. Horizontal axis wind turbines HAWT-1, HAWT-2, and HAWT-6; and vertical axis wind turbines VAWT-1, VAWT-2, and VAWT-4 are recommended for various ranges of loads. Horizontal axis wind turbines were found generally more efficient than the vertical axis wind turbine in the present case. In general, all the turbines showed a maximum increase in energy yield for an increase of 10 m in hub height from 20 to 30m and the annual mean energy yield usually followed the load pattern in the study area. Lastly, the mean turbulence intensity was always less than the value recommended in IEC64100-1 standard. KEYWORDS: Wind speed; wind anemometer; small wind turbine; turbulence intensity; wind power density INTRODUCTION Saudi Arabia is a vast country with total area of 2,149,690 sq km. It occupies most of the Arabian Peninsula, with the Red Sea and the Gulf of Aqaba to the west and the Arabian Gulf to the east. Saudi Arabia contains the world's largest continuous sand desert, Empty Quarter. The inhabitants are spread all over the land. Although most of the cities and towns are connected with electrical grid but some small dwellings in the north and south are fed by isolated diesel generating power plants. To connect all the localities with electrical grid is both time and
Shafiqur Rehman King Fahd University of Petroleum and Minerals Dhahran-31261, Saudi Arabia money intensive; hence attempts are being made to diversify the means of power generation through wind and solar sources. The present paper is an effort towards understanding the usage of small wind turbines for small loads like battery charging, water pumping, street lighting, partially supplementing schools and gas stations, etc. The fast technological development and energy intensive life styles have resulted in tremendous increase in power requirements. Utilization of renewable energy resources has two fold benefits, one it reduces the dependence on fossil fuels and also supplies energy where there is no electrical grid. The widely used sources of clean energy include the wind, solar thermal, solar photovoltaic, hydro, geothermal, and biomass. Of these sources, wind has been adapted by industries and accommodated by individuals due to its availability, ease of maintenance, low cost of operation. The annual cumulative wind power installed capacity reached 282.587 GW by the end of 2012 compared to 238.050 GW in 2011, an increase of 18.71 %, (GWEC Ref. [1]). With a cumulative installed capacity of 75.324 GW, China remained the leader in wind power industry as of end of 2012. United States of America, Germany, Spain and India remained at 2nd, 3rd, 4th, and 5th place with total cumulated wind power installed capacities of 60.007 GW, 31.308 GW, 22.796 GW, and 18.421 GW; respectively by the end of 2012. The applications of small wind turbines, include heating greenhouses and residential buildings (Ozgener [2]), hydrogen production for upgrading bitumen from oil fields (Olateju and Kumar [3]), and water lifting (Abed [4]), to name a few. Lara et al. [5] evaluated a 3 kW wind turbine feeding a battery bank of 48 V/880 Ah by means of a non-controlled 6-pulse rectifier. The overall efficiencies showed a maximum of 17% of the wind energy to be available for water pumping. Nagai et al. [6] reported the performance of a 2 kW rated power wind turbine in terms of the functions of wind turbine rotational speed, generated outputs, and its stability for wind speed changes. The expected performance of the machine was confirmed under real wind conditions and the wind turbine showed a power
1
Copyright © 2014 by ASME
coefficient of 0.257 under the average wind speed of 7.3 m/s. Ozgener [7] presented energy analysis of the 1.5 kW small wind turbine with a hub height of 12 m and rotor diameter of 3 m in Turkey. The test results showed that at an average wind speed of 7.5 m/s, the turbine produced 616 W of electricity. Arifujjaman et al. [8] modeled a small wind-turbine with furling mechanism and its resulting dynamics using Matlab/Simulink platform. The results indicated that the energy capture of a wind-turbine depends not only on the control strategy but on the wind-speed and Rayleigh distribution. Jowder [9] investigated the site matching of wind turbine generators at 30 m and 60 m heights by estimating the capacity factors of various commercially available wind turbines to ensure optimum selection of wind turbines. Mohammadi and Mostafaeipour [10] reported that small wind turbines could be used effectively and economically in Zarrineh area in Iran for power generation for small loads and off-grid applications. Zaccheus et al. [11] performed a case study for Darling site where they deployed 2-3 acquisition systems on hub heights of 50, 60, and 70 m to determine the actual wind characteristics. Islam et al. [12] proposed a comprehensive study to highlight the recent and future trends of wind energy technology, and estimated that within next 2-3 decades the vertical axis wind turbines (VAWT) can dominate the wind-energy technology due to their less land space requirement. Chen et al. [13] investigated the effect of using different hub heights in a small wind farm on power output and analyzed three different wind conditions by nested genetic algorithm. The results showed that power output of the wind farm using different hub heights would increase even when the total numbers of wind turbines were same. Mirghaed and Roshandel [14] optimized the sizing parameters and farm layout of wind turbines according to the wind resource and economic aspects and calculated the optimal cost of energy for one turbine of about 46.7, 54.5 and 46.6 dollars per MWh at the studied sites. Kishore et al. [15] proposed the design of a small-scale wind energy portable turbine targeted to operate below 5 m/s wind speed. Simic et al. [16] performed a detailed study and analysis of small wind turbines with less than 10kW of installed power. The present study utilizes wind speed measurements made at different heights over a period of more than two and half years at Juaymah meteorological station to evaluate the performance of 8 horizontal and 4 vertical axis wind turbines of 3 to 20 kW rated power. The objective of this study is to find out suitable wind turbines for small applications like desert camping, water pumping, communication towers, and industrial fencing. ESTIMATION METHOD Wind power density (WPD) is calculated as follows: (1) Where A is rotor swept area, is the air density in kg/m3, and V is the wind speed in m/s. The wind speed is interpolated/ extrapolated to hub height by using the wind power law as follows:
( )
(2)
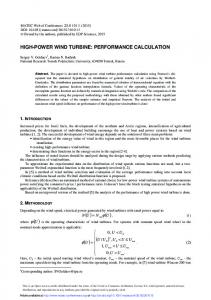
Where V1 and V2 are the wind speeds at heights Z1 and Z2, respectively and is the wind shear exponent. In the present case a local value of = 0.213 has been used. The turbulence intensity is a dimensionless number defined as the standard deviation of the wind speed within a time step divided by the mean wind speed over that time step. It is important in the classification of the site according to the International Electro-technical Commission (IEC). It is a measure of the gustiness of a wind resource. Lower turbulence results in lower mechanical loads on a wind turbine and vice versa. The turbulence intensity is calculated for each time step (10 minutes in the present case) using the following equation [17-19]: (3) where 𝑖 is the average wind speed in time step i and 𝜎𝑖 is the standard deviation of the wind speed within time stem step i (same unit as 𝑖 ). MATERIAL AND SITE DESCRIPTION The meteorological data (wind speeds, wind direction, air temperature, relative humidity, surface station pressure, global solar radiation) were measured at Juaymah for a period of 33 months from July 01, 2006 till July 10 2008. The data was scanned every 3 seconds and 10 minutes averaged values along with mean, standard deviation, minimum and maximum were recorded. The latitude, longitude and altitude of the measurements site were 26° 47.706’ N, 49˚ 53.719’ E and 0.0 meter. The data collection site at Juaymah is an open area from all directions except a number of transmission line poles and cables. The wind speed measurements were made at 10, 20, 30, and 40 meters height. At 10 and 20 meter heights only one sensor was installed. At 30 and 40 meter heights two sensors were installed. The wind direction data was recorded at 30 and 40 meters. The ambient temperature (˚C) and global solar 2 radiation (W/m ) data was collected at 2 meters above the ground surface. A schematic of the meteorological sensors installed on 40 meter tall tower is shown in Figure 1 and an actual photo of the mast taken at the site is shown in Figure 2. A total of 12 small wind turbines (8 horizontal axis wind turbines - HAWT and 4 vertical axis wind turbines - VAWT) were selected from the literature and required technical specifications (given in Tables 1 and 2) and the respective wind power curves were obtained from different sources (web links are given in Appendix-A). The technical specifications of all the sensors used in this measurement campaign are given in Table 3. The rated power of HAWT varied from as low as 3 kW and as high as 20kW. The rated power of chosen VAWT’s was between 3 to 10 kW. The wind power curves used for energy yield estimation are given in Figures 3 and 4 for HAWT and VAWT, respectively.
RESULTS AND DISCUSSION The computation results are presented as overall meteorological summaries, energy yield and plant capacity factor (PCF), annual and monthly energy yield and PCF variation. To estimate the net power or energy yield, the down time, array, icing, and other losses have been assumed as 5%, 4%, 1%, and 2% respectively. The PCF values were obtained
2
Copyright © 2014 by ASME
by dividing the actual energy yield by the maximum possible yield in a given period of time. Table 1. HORIZONTAL SPECIFICATIONS.
S. No.
Model
1 2 3 4 5 6 7 8
HAWT-1 HAWT-2 HAWT-3 HAWT-4 HAWT-5 HAWT-6 HAWT-7 HAWT-8
Rated Power (kW) 3 5 10 20 10 15 20 5
Table 2. VERTICAL SPECIFICATIONS.
S. No.
Model
1 2 3 4
VAWT-1 VAWT-2 VAWT-3 VAWT-4
AXIS
Cut-inspeed (m/s) 3 3 3 3 2.2 1.5 1.5 3
AXIS
Rated Power (kW) 3 5 10 10
SMALL WIND
Rated Speed (m/s) 11 10 10 10 11 9 9 12
SMALL
Cut-inspeed (m/s) 2.5 2.5 2.5 3.5
Rotor Diameter (m) 5 6.4 8 10 7 11.1 13.1 5.5
WIND
Rated Speed (m/s) 10 10 12 12
TURBINE
TURBINE
Rotor Height (m) 3 5.3 5.3 9.6
global solar radiation-GSR, pressure-PR, and relative humidityRH and derived parameters like air density, turbulence intensityTI, and wind power density-WPD) are summarized in Table 4. The mean WS increased by around 17, 10, and 6% at 20, 30, and 40 m compared to their values at previous heights, respectively. The mean WD was predominantly from NNW with an average value of 342° at 40 m. The ambient temperature at the site was found to vary from a minimum of 2.5°C to a maximum of 49°C with an overall average of 26.09°C, as given in Table 4. The mean values of GSR, PR, and RH were 200.8 2 W/m , 1014 mbar, and 17.3%; respectively. The air density was calculated using ambient pressure and temperature and was 3 found to vary from 1.083 to 1.30 kg/m with an overall mean of 3 1.181 kg/m . The local value of air density was used for the estimation of WPD and energy yield from the chosen wind turbines.
The mean air turbulence intensity was always less than the critical TI value of 0.18 as the permissible value recommended in IEC 61400-1 standard [20]. Furthermore, the mean TI values were found to be decreasing with increasing height which indicates that wind turbines will be safe to operate even at further higher hub heights if needed. Finally, the mean WPD was found increase with increasing WS measurement heights as summarized in Table 4.
Figure 2. WIND AND METEOROLOGICAL MEASUREMENT TOWER INSTALLED AT JUAYMAH.
Figure 1. SCHEMATIC OF WIND SPEED (WS) AND DIRECTION (WD) SENSORS ON 40 METERS TALL MAST.
Meteorological summaries over data collection period (July 01, 2006 to July 10 2008) The mean, minimum, maximum, and standard deviation values of all the parameters (wind speed WS1-WS2-WS3-WS4-WS5WS6, wind direction WD1-WD2, ambient temperature-TM,
DATA
Energy yield and plant capacity factor analysis over data collection period (July 01, 2006 to July 10 2008) The annual energy yield and the PCF corresponding to all HAWT’s at 10, 15, 20, 30, and 40 m hub height (HH) are summarized in Table 5 while those for VAWT’s in Table 6. The smallest HAWT, HAWT-1 of 3 kW generated 3.653 MWh of electricity with a PCF of 13.9% at 10 HH. Among 5 kW rated power turbines, Aeolos-H 5kW was found to be most efficient with an AEY of 7.684 MWh and PCF of 17.3% at 15 m HH. Among 10 kW rated power WT’s, HAWT-3 was found to be most efficient with AEY of 17.329 MWh and PCF of 19.8% at
3
Copyright © 2014 by ASME
20 m HH. The 20 kW rated power HAWT-7 produced 48.614 MWh electricity annually with a PCF of 27.7% while HAWT-4 of 20 kW 38.143 MWh with a PCF of 21.8% at a HH of 30 m. The effect of hub height on the percent change in energy yield from chosen HAWT’s is shown in Figure 5. As seen from this figure, maximum percentage increase in AEY was observed for all the chosen HAWT’s while changing the hub height from 20 to 30 m. Next best percentage increase in AEY was obtained for hub height change of 5 m i.e. from 10 to 15 m. Furthermore, highest percentage increase in AEY was observed for HAWT-5 and HAWT-8. For example in case of HAWT-5, the AEY changed from 7.228 MWh to 8.722 MWh to 10.025 MWh to 12.444 MWh to 14.644 MWh corresponding to change in HH from 10 to 15 to 20 to 30 to 40 m; respectively. However the PCF’s changed from 8.3% to 10% to 11.4% to 14.2% to 16.7% with corresponding change in HH, respectively. For practical usage at Juaymah and its surroundings and areas with similar or better wind resources, following HAWT’s are recommended: For small loads of < 0.7 kW, HAWT-1 with PCF of 16.3% at 15 m hub height For medium loads of up to 1.5 kW, HAWT-2 with PCF of 20% at 20 m hub height For larger loads of up to 2.5 kW, HAWT-3 with PCF of 19.8% at 20 m hub height For further higher loads, suitable HAWT’s could be chosen from the performance data given in Table 5. The AEY and PCF of chosen VAWT’s are summarized Table 6. The AEY and PCF’s of VAWT’s are relatively smaller than those of HAWT’s of the same rated power. At 15 m hub height, the highest PCF of 18.3% was obtained for VAWT-2 while VAWT-1 with PCF of 17.2% was the next best VAWT. The 10 kW turbines, VAWT-3 was found to be unsuitable for wind conditions at Juaymah station due to high cut-in-speed and low productivity up to 6 m/s of wind speed. The percentage change in AEY with increase in hub height for all the chosen VAWT’s is shown in Figure 6. In general maximum percentage change in AEY was observed for HH change of 10 m from 20 to 30 m. The next maximum change in AEY was found for an increase of 5 m in hub height from 10 to 15 m, as shown in
Figure 6. From this figure it was also observed that maximum change in AEY of 20.9%, 14.8%, 22.7%, and 16.7% was found for a change in hub height from 10-15, 15-20, 20-30, and 30-40 m; respectively for VAWT-3.
Figure 3. WIND POWER CURVES OF SELECTED HAWT’s.
Figure 4. WIND POWER CURVES OF SELECTED VAWT’s.
Table 3. OPERATING RANGES AND ACCURACIES OF VARIOUS SENSORS USED FOR DATA COLLECTION. Item Description Technical Information Wind speed sensor, NRG#40 AC sine wave, Accuracy: 0.1m/s, Range: 1-96 m/s Output: 0-125 HZ, Threshold: 0.78 m/s Wind direction vane, NRG#200P Accuracy: 1%, Range: 360o Mechanical, Output: 0-Exc. Voltage, Threshold: 1m/s Temperature sensor #110S Accuracy: ±1.1oC, Range: -40oC to 52.5oC, Output: 0–2.5 volts DC Barometric pressure sensor BP20 Accuracy: ±15 mb, Range: 150–1150 mb, Output: Linear voltage Relative humidity sensor RH-5 Accuracy: ±5%, Range: 0–95%, Output: 0–5volts, Operating range: -40oC to 54oC Pyranometer Li-Cor #LI-200SA Accuracy: 1%, Range: 0–3000W/m2 , Output: Voltage DC, Operating range: -40oC to 65oC
4
Copyright © 2014 by ASME
For practical usage at Juaymah and its surroundings and areas with similar or better wind resources, following VAWT’s are recommended: For small loads of < 0.5 kW, VAWT-1 with PCF of 17.2% at 15 m hub height For medium loads of up to 1.5 kW, VAWT-2 kW with PCF of 20.6% at 20 m hub height For larger loads of up to 2.5 kW, VAWT-4 with PCF of 14.2% at 30 m hub height Monthly variation of energy yield and plant capacity factor For detailed analysis and due to paper length limitations, HAWT-1, HAWT-2, and HAWT-6 with respective PCF’s of 25.4%, 28.6%, and 34% at 40m HH are included here. Similarly two most efficient turbines (Aeolos-V-3kW and Aeolos-V-5kW with PCF’s of 27.1% and 28.4% at 40m HH have been chosen for further analysis. At Juaymah study site, a 3 kW HAWT (HAWT-1) could produce maximum energy of 568 kWh in December while a minimum of 215 kWh in March with respective PCF’s of 25.4% and 9.6%. During summer time from May to September, the net energy output was higher matching with the load pattern except in January and December, as seen from Table 7. The monthly trends of PCF, zero and rated output are also shown in Figure 7. The duration during which the energy output was zero remained < 3% with the exception of February to April while it was >5%. The duration during which the turbine produced rated power was 1% was in January, July-September and November to December. Table 4. METOROLOGICAL DATA SUMMARY DURING DATA COLLECTION PERIOD (July 01, 2006 - July 10 2008).
Parameter WS1 WS2 WS3 WS4 WS5 WS6 WD1 WD2 TM GSR PR RH Air Density
WS5 TI WS3 TI WS2 TI WS1 TI WPD5 WPD3 WPD2 WPD1
Units m/s m/s m/s m/s m/s m/s ° ° °C W/m2 mbar % kg/m3
Height 10 m 20 m 30 m 30 m 40 m 40 m 30 m 40 m
W/m2 W/m2 W/m2 W/m2
40 m 30 m 20 m 10 m 40 m 30 m 20 m 10 m
Mean 4.14 4.84 5.34 5.33 5.65 5.69 334.8 341.8 26.09 200.8 1014 17.3 1.181 0.123 0.128 0.144 0.175 178 152 117 83
Min 0.4 0.4 0.4 0.4 0.4 0.4 0 0 2.5 0 995 0 1.085 0 0 0 0 0 0 0 0
Max 14.4 16 16.3 17 17.4 17.9 360 360 49 984 1032 100 1.3 0.9 0.83 0.88 0.86 2996 2463 2329 1698
STD 2.25 2.31 2.45 2.38 2.58 2.48 116.2 121.9 9.22 271 8 23 0.041 0.084 0.077 0.086 0.094 241 216 172 131
Table 5. ANNUAL ENERGY YIELD AND PLANT CAPACITY FACTOR OBTAINED FROM HAWT’s.
S. No.
Wind Turbine Model
1 2 3 4 5 6 7 8
HAWT-1 HAWT-2 HAWT-3 HAWT-4 HAWT-5 HAWT-6 HAWT-7 HAWT-8
10 Energy (MWh) 3.653 6.440 12.727 22.780 7.228 30.437 30.925 4.694
PCF (%) 13.9 14.7 14.5 13.0 8.3 23.2 17.7 10.7
15 Energy (MWh) 4.273 7.684 15.195 27.257 8.722 33.460 36.125 5.655
PCF (%) 16.3 17.5 17.3 15.6 10.0 25.5 20.6 12.9
Hub Height (m) 20 30 Energy PCF Energy (MWh) (%) (MWh) 4.792 18.2 5.761 8.754 20.0 10.730 17.329 19.8 21.224 31.195 17.8 38.143 10.025 11.4 12.444 35.998 27.4 40.598 40.557 23.1 48.614 6.495 14.8 8.088
PCF (%) 21.9 24.5 24.2 21.8 14.2 30.9 27.7 18.5
40 Energy (MWh) 6.669 12.530 24.743 44.234 14.644 44.738 55.936 9.537
PCF (%) 25.4 28.6 28.2 25.2 16.7 34.0 31.9 21.8
Table 6. ANNUAL ENERGY YIELD AND PLANT CAPACITY FACTOR OBTAINED FROM VAWT’s.
S. No.
Wind Turbine Model
1 2 3 4
VAWT-1 VAWT-2 VAWT-3 VAWT-4
10 Energy (MWh) 3.825 6.840 5.367 7.875
PCF (%) 14.6 15.6 6.1 9.0
15 Energy (MWh) 4.517 8.021 6.488 9.240
PCF (%) 17.2 18.3 7.4 10.5
Hub Height (m) 20 Energy PCF (MWh) (%) 5.099 19.4 9.011 20.6 7.451 8.5 10.393 11.9
5
30 Energy (MWh) 6.154 10.800 9.143 12.399
PCF (%) 23.4 24.7 10.4 14.2
40 Energy PCF (MWh) (%) 7.129 27.1 12.447 28.4 10.674 12.2 14.223 16.2
Copyright © 2014 by ASME
December. The duration during which the energy output was zero remained always >5% and even touched 18% in March. The duration during which the turbine produced rated power was around 1% during February to June and between 2 to 5% during rest of the months with the exception of December while it was 9.88%. The net PCF was mostly around 20%.
Figure 5. INCREASE IN AEY OF HAWT’s WITH HH.
Figure 7. MONTHLY VARIATION OF ZERO AND RATED OUTPUT AND PCF FOR HAWT-1. Table 8. MONTHLY VARIATION OF ENERGY YIELD AND PCF FOR A 5 kW HAWT (HAWT-2) at 20 m HH.
Month Figure 6. INCREASE IN AEY OF VAWT’S WITH HH.
Jan Feb Mar Apr May Jun Jul Aug Sep Oct Nov Dec Overall
Table 7. MONTHLY VARIATION OF ENERGY YIELD AND PCF FOR A 3 kW HAWT (HAWT-1) at 15 m HH.
Month Jan Feb Mar Apr May Jun Jul Aug Sep Oct Nov Dec Overall
HH WS (m/s) 5.04 3.96 3.64 3.73 4.32 4.59 4.93 4.83 4.74 4.90 4.50 5.48 4.52
Zero Output (%) 2.73 7.45 8.51 5.46 1.93 1.02 1.70 2.96 2.13 1.82 2.64 2.15 3.45
Rated Output (%) 1.72 0.20 0.13 0.00 0.09 0.28 2.02 3.81 1.62 0.85 1.25 5.31 1.36
Mean Energy (kWh) 452 250 215 226 293 332 436 433 396 418 341 568 4,273
Net PCF (%) 20.2 12.4 09.6 10.5 13.1 15.4 19.5 19.4 18.3 18.7 15.8 25.4 16.3
A 5 kW HAWT (HAWT-2) could produce maximum energy of 1155 kWh in December while a minimum of 419 kWh in March with respective PCF’s of 31% and 24.8% with a hub height of 20m, as given in Table 8. During May to November, the net energy output was higher (>600kWh) matching with the load pattern except in January and
HH WS (m/s) 5.36 4.21 3.90 4.04 4.65 4.95 5.28 5.16 5.06 5.23 4.80 5.82 4.84
Zero Output (%) 08.19 16.96 18.23 13.47 06.36 04.77 05.47 07.66 06.48 06.51 09.31 07.06 09.29
Rated Output (%) 4.07 1.13 0.31 0.83 0.45 1.44 3.58 5.65 3.43 2.62 2.36 9.88 2.81
Mean Energy (kWh) 922 492 419 440 609 707 913 901 810 871 692 1,155 8,754
Net PCF (%) 24.8 14.6 11.3 12.2 16.4 19.6 24.5 24.2 22.5 23.4 19.2 31.0 20.0
The peculiarity of 15 kW rated power HAWT (HAWT-6) was that it never had zero output during entire operation period as can be seen from column 3 of Table 9. However, the rated output duration was also minimal in the range 1%. The energy output from this turbine was found to be increasing from February till July and then decreasing towards November. However, higher values of energy were received in the months of January and December. The maximum energy of 3,975 kWh with a PCF of 35.6% could be received in December while a minimum of 2,278 kWh in March with a PCF of 20.4% at a hub height of 20 m. Furthermore this turbine produced more energy during summer time compared to wintertime as dictated by numbers given in 5th column of Table 9. This energy pattern
6
Copyright © 2014 by ASME
matches with the larger load requirement during summer time and lower during rest of the period. The net PCF was always >20%, as can be seen from the last column of Table 9. The monthly mean wind speed, percentage of time the output was zero and rated, energy yield and PCF at 15 m hub height are summarized in Table 10 for a 3 kW rated power VAWT (VAWT-1). Maximum energy yield of 601 kWh with a PCF of 26.9% was obtained during December while a minimum of 222 kWh of energy with a PCF of 10% in March, as given in Table 10. The monthly trends of PCF, zero and rated output of VAWT-1 are also shown in Figure 8. An increasing trend in monthly mean energy yield was observed from March till July and then a decreasing trend towards November. Furthermore this turbine produced more energy during summer time compared to wintertime as shown in 5 th column of Table 10. This turbine experienced a maximum of 8.56% times of zero output in March and a minimum of 1.02% in June. The maximum duration during which the machine produced rated power was 7.33% in December and a minimum of 0.14% in April. The percentage of time the output was zero and rated, energy yield and PCF at 20 m HH are summarized in Table 11 for a 5 kW rated power VAWT (VAWT-2). Maximum energy yield of 828 kWh with a PCF of 22.3% was obtained during December while a minimum of 317 kWh of energy with a PCF of 8.5% in March, as given in Table 11. An increasing trend in monthly mean energy yield was observed from March till July and then a decreasing trend towards November. Furthermore this turbine produced more energy during summer time compared to wintertime as shown in 5th column of Table 11. The percentage duration during which the output remained zero was always >5% significantly higher from February to April and in November. The maximum duration during which the machine produced rated power was 1.97% in August and a minimum of 0 from February to June. The net PCF was usually >10%.
Table 10. MONTHLY VARIATION OF ENERGY YIELD AND PCF FOR 3 kW VAWT (VAWT-1) at 15 m HH. HH Zero Rated Mean Net Month WS Output Output Energy PCF (m/s) (%) (%) (kWh) (%) Jan 5.04 2.78 2.39 480 21.5 Feb 3.96 7.45 0.49 261 13.0 Mar 3.64 8.56 0.22 222 10.0 Apr 3.73 5.51 0.14 232 10.8 May 4.32 1.93 0.22 311 13.9 Jun 4.59 1.02 0.46 355 16.4 Jul 4.93 1.70 2.73 466 20.9 Aug 4.83 3.00 4.30 456 20.4 Sep 4.74 2.13 2.31 419 19.4 Oct 4.90 1.82 1.28 447 20.0 Nov 4.50 2.64 1.53 359 16.6 Dec 5.48 2.15 7.33 601 26.9 Overall 4.52 3.47 1.83 4,517 17.2 Table 11. MONTHLY VARIATION OF ENERGY YIELD AND PCF FOR 5 kW VAWT (VAWT-2) at 20 m HH.
Month Jan Feb Mar Apr May Jun Jul Aug Sep Oct Nov Dec Overall
Table 9. MONTHLY VARIATION OF ENERGY YIELD AND PCF FOR 15 kW HAWT (HAWT-6) at 20 m HH.
Month Jan Feb Mar Apr May Jun Jul Aug Sep Oct Nov Dec Overall
HH WS (m/s) 5.36 4.21 3.9 4.04 4.65 4.95 5.28 5.16 5.06 5.23 4.80 5.82 4.84
Zero Output (%) 0 0 0 0 0 0 0 0 0 0 0 0 0
Rated Output (%) 0.53 0 0 0 0 0 0.31 1.61 0.56 0.24 0.14 1.21 0.37
Mean Energy (kWh) 3,483 2,330 2,278 2,299 2,764 2,960 3,470 3,385 3,173 3,384 2,903 3,975 35,998
Net PCF (%) 31.2 23.1 20.4 21.3 24.8 27.4 31.1 30.3 29.4 30.3 26.9 35.6 27.4
HH WS (m/s) 5.36 4.21 3.90 4.04 4.65 4.95 5.28 5.16 5.06 5.23 4.80 5.82 4.84
Zero Output (%) 8.19 16.96 18.23 13.47 6.36 4.72 5.47 7.66 6.48 6.51 9.31 7.06 9.28
Rated Output (%) 0.62 0 0 0 0 0 0.54 1.97 0.65 0.36 0.14 1.34 0.46
Mean Energy (kWh) 657 364 317 344 448 509 647 641 581 615 497 828 6,329
Net PCF (%) 17.7 10.8 8.5 9.6 12.0 14.2 17.4 17.2 16.1 16.5 13.8 22.3 14.4
Figure 8. MONTHLY VARIATION OF ZERO AND RATED OUTPUT AND PCF FOR VAWT-1.
7
Copyright © 2014 by ASME
CONCLUSIONS AND RECOMMENDATIONS A total of 12 wind turbines (8 HAWT and 4 VAWT) have been analyzed in terms of annual energy yield and plant capacity factor by using wind speed data measured at 10, 20, 30 and 40 m above ground level at Juaymah meteorological station in Saudi Arabia for a period of 33 months. To estimate the net power or energy yield, the down time, array, icing, and other losses were assumed as 5%, 4%, 1%, and 2% respectively. Following are the highlights of the present work: The mean wind speed increased by approximately 17% at 20 m compared to 10 m, 10% at 30 m compared to 20 m, and 6% at 40 m compared to 30 m above ground level (AGL). The mean WD was predominantly from NNW with an average value of 342° at 40 m. The mean WPD was found to vary from 83 W/m2 to 178 W/m2 corresponding 10m and 40 heights. The mean WPD at 20 and 30 m height was 117 W/m2 and 152 W/m2. The overall mean ambient temperature, global solar radiation, pressure, and relative humidity values were 26.09°C, 200.8 W/m2, 1014 mbar, and 17.3%; respectively. The local mean air density was calculated using ambient pressure and temperature and was found to be 1.181 kg/m3. This value of air density was used for the estimation of WPD and energy yield from the chosen wind turbines. The mean air turbulence intensity was found to be 0.175, 0.144, 0.128, and 0.123 at 10, 20, 30, and 40 m AGL which was always less than the critical TI value of 0.18 as the permissible value recommended in IEC 61400-1 standard. For an increase of 10 m in hub height from 20 to 30, all HAWT’s and VAWT’s produced the maximum percentage change in AEY. Next best change in percentage AEY was obtained for an increase in hub height of 5 m from 10 to 15 m. An increasing trend of monthly mean energy yield values was observed from March till July and then a decreasing towards November. A similar trend was seen for monthly mean values of PCF’s for all the HAWT’s. Relatively higher values of energy yield and PCF were found in January and December. For all practical purposes like battery charging, single house load (without air-conditioning), and desert camping, HAWT-1 with PCF of 13.9% at 10 m HH, HAWT-2 with PCF of 20% at 20 m HH, and HAWT-6 with PCF of 27.4% at 20 m hub height are recommended for different load requirements. Similarly, VAWT-1 with PCF of 17.2% at 15 m HH, VAWT-2 with PCF of 20.6% at 20 m hub height, and VAWT-4 with PCF of 14.2% at 30 m hub height are also recommended for various ranges of loads. In general, HAWT’s were found to be more efficient than VAWT’s for the cases presented in this paper.
NOMENCLATURE A rotor swept area (m2) AEY Annual energy yield GSR Global solar radiation (W/m2) HAWT Horizontal axis wind turbine HH Hub height (m) IEC Electro-technical Commission kW Kilo watt kWh Kilo watt hour m Meter MW Mega Watt MWh Mega Watt Hour PCF Plant capacity factor (%) PR Pressure (mb) RH Relative humidity (%) TI Mean turbulence intensity V Wind speed (m/s) VAWT Vertical axis wind turbine WD Wind direction (°) WPD Wind power density (W/m2) WS Wind speed (m/s) Z Height above ground level (m) ρ Air density (kg/m3) α Local wind shear exponent (WSE) σ Standard deviation ACKNOWLEDGMENTS This work was supported by Deanship of Scientific Research under project (FT121005-Feasibility of Using Small Wind Turbines for Small off grid Load in Saudi Arabia: A Case Study) at King Fahd University of Petroleum and Minerals, Dhahran, Saudi Arabia. REFERENCES [1] Global Wind Energy Council (GWEC) annual report 2012http://www.gwec.net/global-figures/graphs/ (Accessed on August 13 2013) [2] Ozgener, O., 2010. “Use of solar assisted geothermal heat pump and small wind turbine systems for heating agricultural and residential buildings”. Energy, 35, pp. 262–268. [3] Olateju, B., and Kumar, A., 2011. “Hydrogen production from wind energy in Western Canada for upgrading bitumen from oil sands”. Energy, 36(11), pp. 6326-6339. [4] Abed, K., A., 1997. “Performance of a wind turbine-driven compressor for lifting water”. Energy, 22(1), pp. 21-26. [5] Lara, D., D., Merino, G., G., Pavez, B., J., and Tapia, J., A., 2011. “Efficiency assessment of a wind pumping system”. Energy Conversion and Management, 52(2), pp. 795-803. [6] Nagai, B., M., Ameku, K., and Roy, J., N., 2009. “Performance of a 3 kW wind turbine generator with variable pitch control system”. Applied Energy, 86, pp. 1774–1782.
8
Copyright © 2014 by ASME
[7] Ozgener, O., 2006. “A small wind turbine system (SWTS) application and its performance analysis”. Energy Conversion and Management, 47(11–12), pp. 1326-1337. [8] Arifujjaman, Md., Iqbal, M., T., and Quaicoe, J., E., 2008. “Energy capture by a small wind-energy conversion system”. Applied Energy, 85, pp. 41–51. [9] Jowder, F., A., L., 2009. “Wind power analysis and site matching of wind turbine generators in Kingdom of Bahrain”. Applied Energy, 86, pp. 538–545. [10] Mohammadi, K., and Mostafaeipour, A., 2013. “Using different methods for comprehensive study of wind turbine utilization in Zarrineh, Iran”. Energy Conversion and Management, 65(1), pp. 463-470. [11] Zaccheus, O., O., and Komla, A., F., 2013. “Wind energy analysis based on turbine and developed site power curves: A case-study of Darling City”. Renewable Energy, 53, pp. 306-318. [12] Islam, M., R., Mekhilef, S., and Saidur, R., 2013. “Progress and recent trends of wind energy technology”. Renewable and Sustainable Energy Reviews, 21, pp. 456468. [13] Chen, Y., Li, H., Jin, K., and Song, Q., 2013. “Wind farm layout optimization using genetic algorithm with different hub height wind turbines”. Energy Conversion and Management, 70(6), pp. 56-65. [14] Mirghaed, M., R., and Roshandel, R., 2013. “Site specific optimization of wind turbines energy cost: Iterative approach”. Energy Conversion and Management, 73(9), pp. 167-175. [15] Kishore, R., A., Coudron, T., and Priya, S., 2013. “Smallscale wind energy portable turbine (SWEPT)”. Journal of Wind Engineering and Industrial Aerodynamics, 116(5), pp. 21-31. [16] Simic, Z., Havelka, J., G., and Vrhovcak, M., B., 2013. “Small wind turbines – A unique segment of the wind power market”. Renewable Energy, 50(2), pp. 1027-1036. [17] Raichle, B., W., and Carson, W., R., 2009. “Wind resource assessment of the Southern Appalachian Ridges in the Southeastern United States”. Renewable and Sustainable Energy Reviews, 13, pp. 1104–1110. [18] Al-Yahyai, S., Charabi, Y., Gastli, A., and Al-Alawi, S., 2010. “Assessment of wind energy potential locations in Oman using data from existing weather stations”. Renewable and Sustainable Energy Reviews, 14, pp. 1428– 1436. [19] Dahmouni, A., W., Ben Salah, M., F., Kerkeni, A., C., and Nasrallah, S., B., 2010. “Wind energy in the Gulf of Tunis, Tunisia”. Renewable and Sustainable Energy Reviews, 14, pp. 1303–1311. [20] International electrochemical Commission (IEC) standard IEC61400-1, http://webstore.iec.ch/ .
9
Copyright © 2014 by ASME
ANNEX A WIND TURBINE REFERENCES http://www.windturbinestar.com/3kwh-aeolos-wind-turbine.html http://www.windturbinestar.com/5kwh-aeolos-wind-turbine.html http://www.windturbinestar.com/10kwh-aeolos-wind-turbine.html http://www.windturbinestar.com/20kwh-wind-turbine.html http://bergey.com/products/wind-turbines/10kw-bergey-excel http://www.cfgreenenergy.com/products http://www.evancewind.com/products/r9000-5kw-system/specification http://www.windturbinestar.com/3kwv-v-aeolos-wind-turbine.html http://www.windturbinestar.com/5kwv-v-aeolos-wind-turbine.html http://www.windturbinestar.com/10kwv-v-aeolos-wind-turbine.html http://www.urbangreenenergy.com/products/UGE-9M
10
Copyright © 2014 by ASME