University of California - Merced. {akamthe,mcarreira-perpinan,acerpa}@ucmerced.edu. Abstract. Modeling the behavior of 802.15.4 links is a non-trivial.
Poster Abstract: Wireless Link Simulations using Multi-level Markov Models ´ Carreira-Perpin˜ an ´ and Alberto E. Cerpa Ankur U. Kamthe, Miguel A. Electrical Engineering and Computer Science University of California - Merced
{akamthe,mcarreira-perpinan,acerpa}@ucmerced.edu Abstract
2
Modeling the behavior of 802.15.4 links is a non-trivial problem because of the widespread heterogeneity in the quality of any given link over short and long time scales. We propose a novel multilevel approach involving Hidden Markov Models (HMMs) and Mixtures of Multivariate Bernoullis (MMBs) for modeling the long and short time scale behavior of wireless links using experimental data traces collected from multiple 802.15.4 testbeds. We characterize the synthetic traces generated from the proposed model in terms of statistical characteristics as compared to an empirical trace with similar PRR characteristics.
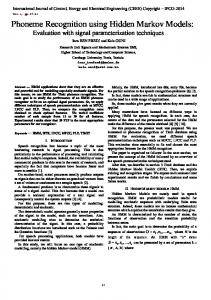
We consider our observed data as binary sequences where 1 indicates successful packet reception and 0 indicates lost or corrupted packets. The fundamental motivation for our modeling approach is that observed traces display structure at different temporal scales. In Figure 1, for example, one can see that over a period of minutes the link seems to switch between two states: one with PRR ≈ 0.3 and the other with PRR ≈ 0.86. We call this the long-term dynamics. In a period of seconds, however, while the PRR may stay roughly constant at 0.3, it is more likely to observe a bursty sequence 000000001111 than a wildly oscillating sequence 010010100100. We call this the short-term dynamics. In order to simulate realistically the behavior of links, we want a model that is flexible enough to replicate this multiscale structure, and estimate its parameters from observed traces.
Categories and Subject Descriptors I.6.5 [Simulation and modeling]: Model Development—Modeling methodologies; C.2.1 [ComputerCommunication Networks]: Network Architecture and Design—Wireless communication
General Terms Algorithm, Measurement, Design
Keywords Simulation, 802.15.4 Low Power Wireless Networks, Wireless Channel Model, Hidden Markov Models, Mixture of Multivariate Bernoulli
1
Introduction
Recent studies have indicated the presence of a wide chasm between the real world radio channel behavior and existing radio channel models in wireless simulators. This leads to significant differences in performance of a system in simulation as compared to a real world deployment. Improving wireless simulators by incorporating accurate and robust radio channel models will reduce the gap between simulation and real-world performance. The problem of existing wireless simulators is their inability to simultaneously model the effect of changes in wireless communication over short and long time-scales and over distance. In this paper, we propose a novel multilevel approach involving Hidden Markov Models (HMMs) and Mixtures of Multivariate Bernoullis (MMBs), called the Multi-level Markov (M&M) model, for modeling the long and short time scale behavior of links in wireless sensor networks. Copyright is held by the author/owner(s). SenSys’09, November 4–6, 2009, Berkeley, CA, USA. ACM 978-1-60558-748-6
Wireless Link Modeling
2.1
The Multi-level Markov (M&M) Model
The data trace is modeled as a sequence of binary strings (windows) xt of length W . A level-1 hidden Markov model (L1–HMM) with Q1 different states q = 1, . . . , Q1 models transitions between long-term states. Each long-term state q has its own distribution p(x|q) of emitting binary W windows, which captures the short-term behavior, that is, the dynamics of the variations in consecutive packet reception successes or failures and has its own parameters. W controls the tradeoff of short vs. long term. We have studied two types of short-term, or level-2, models: • A hidden Markov model (L2–HMM) with a (univariate) Bernoulli emission distribution with parameter p.
Figure 1. Variation in packet reception rate (PRR) over time.
1
0.9
0.9
0.8
0.8
0.7
0.7 PRR (mean = 0.76)
PRR (mean = 0.72)
1
0.6 0.5 0.4
111110011011111111111010001 001111100110011110110101111 011010100101111001110111000 111111100011111101100001111 11111101011100111110...........
0.3 0.2
0.5 111010110101111011011001110 111111110111011111011111011 111111011011001101111101110 111111010111110110111111101 11111101011100110011...........
0.4
0.2 0.1
0 0
15
30 time (in minutes)
45
60
0 0
(a) Original PRR=72% Conditional Probability
10
4
10
3
10
2
10
1
10
0
10
0
20 40 60 Run Length of 1s
80
5
Conditional Probability
10
4
10
3
10
2
10
1
10
0
10
0
50 100 Run Length of 0s
15
30 time (in minutes)
45
60
2. For each long-term state q of this sequence, we sample a W -window x from its p(x|q). The trace is the concatenation of the L/W windows.
150
1
2.1.2
0.8
0.4 0.2 20 40 60 Run Length of 1s
73
0.8
3. For each of the Q1 states, we trained its L2–HMM or L2–MMB model only on its corresponding cluster using the EM algorithm.
0.6 0.4
2.2
0.2 50 112 Run Length of 0s
(c) Statistics for Original Trace Conditional Probability
Weighted Occurences
5
10
4
10
3
10
2
10
1
10
0
10
0
20 40 60 Run Length of 1s
80
Conditional Probability
Weighted Occurences
5
10
4
10
3
10
2
10
1
10
0
10
0
50 100 Run Length of 0s
150
2. We used the Viterbi algorithm to obtain the most likely state sequence for each input trace, and grouped into the same cluster all windows assigned to the same state.
1
0 0
1 0.8 0.6 0.4 0.2 0 0
20 40 62 Run Length of 1s
1
0.6 0.4 0.2 50 101 Run Length of 0s
(d) Statistics for Simulated Trace
Figure 2. Average PRR over time from (a) 1-hour data trace and (b) corresponding simulated trace. Statistics for each link for the weighted run lengths and CPDFs of packet reception and losses for the original (c) and simulated traces (d) are also shown (Note: (i) As CPDF values do not exist beyond a maximum run length, CPDF plots are truncated at maximum run length)..
Evaluation of the M&M model
For each link, we learned the model parameters given data traces of length 230,400. For each model, we sampled a long sequence and compared performance on the basis of: (1) PRR, (2) Distributions of run lengths of 1’s and 0’s, and (3) Conditional Packet Delivery Function (CPDF). Our choice of parameters was Q1 = 6, Q2 = 2 and M = 20. From Figures 2(a) and 2(b), we can see that for the simulated traces the M&M model is able to capture the long term dynamics quite accurately when compared to the original traces. Overall, the average difference between the PRR of the simulated and the original link for all traces was less than 2.5%. Figures 2(c) and 2(d) plot the distributions of weighted run lengths and CPDFs of 0’s and 1’s for the original and simulated traces. For more details and results, refer to [2].
3
0.8
0 0
Learning
1. The binary input trace is transformed into a sequence of PRRs (in [0, 1]) computed over a window size W . We define a continuous HMM with Q1 states and beta emission distributions and use the Expectation Maximization algorithm to estimate its transition probabilities.
0.6
0 0
Sampling
In order to generate a trace of length L bits from the model: 1. Generate a long-term state sequence of length L/W using the transition probabilities of the L1–HMM.
(b) Simulated PRR=76%
5
Weighted Occurences
2.1.1
0.6
0.3
0.1
Weighted Occurences
• A mixture of multivariate Bernoulli distributions (L2– MMB) with M components, and each component has W + 1 parameters: a mixture proportion and a vector p = (p1 , . . . , pW )T of Bernoulli parameters.
Summary and Future Work
The M&M model is a generalization of the Gilbert model [1] where W = 1, Q1 = 2 and each level–1 state has either a L2–MMB with M = 1 or a L2-HMM with Q2 = 1. The model can be extended to emit signal strength values, thus, modeling physical layer characteristics such as RSSI values of wireless traces. Transforming existing model parameters to simulate new environments using order of magnitude less training samples by applying model adaptation techniques is part of our future research agenda.
4
References
[1] E. N. Gilbert. Capacity of a burst-noise channel. Bell System Tecnical Journal, 39:1253–1266, 1960. ´ Carreira-Perpi˜na´ n, and Al[2] Ankur U. Kamthe, Miguel A. berto E. Cerpa. M&M: Multi-level Markov Model for wireless link simulations. In SenSys ’09.