SOURCE: Proceedings of the International Symposium of Applied Electromagnetics & Mechanics, Lansing, MI, September 9-12, 2007.
Wireless Monitoring Techniques for Structural Health Monitoring Kenneth J Loh and Andrew T Zimmerman
Jerome P Lynch*
University of Michigan, Dept. of Civil & Env. Engineering 2350 Hayward Street, GG Brown Rm #1366 Ann Arbor, MI 48109-2125, USA
Univ. of Michigan, Dept. of Civil & Env. Engineering. 2350 Hayward Street, GG Brown Rm #2380 Ann Arbor, MI 48109-2125, USA *
[email protected]
Abstract—Recently, a variety of wireless structural health monitoring systems have been demonstrated as viable substitutes for traditional high-cost tethered monitoring systems. In this study, a prototype wireless sensing system is deployed on the Voigt Bridge (La Jolla, CA) and a historical theatre (Detroit, MI) to validate its performance against cabled monitoring systems. Acceleration time history records collected from wireless sensors during ambient and forced vibrations suggest excellent correlation with those obtained from tethered systems. Furthermore, the embedded data processing capabilities of wireless sensors are highlighted; operational deflection shapes of the bridge deck and theatre balcony are identified autonomously by the wireless sensor network using embedded algorithms. Keywords-embedded data processing, Fourier analysis, frequency domain decomposition, mode shapes, peak-picking, sensor networks, structural health monitoring, wireless sensors
I.
INTRODUCTION
Over the past few decades, deteriorating civil infrastructures (i.e. buildings, bridges, roadways, lifelines, among others) around the world have warranted the need for high-performance autonomous sensing systems for structural health monitoring (SHM). While tethered monitoring systems have been utilized in conjunction with schedule-based visual inspections, high installation and maintenance costs have retarded their widespread adoption. Furthermore, with per channel costs on the order of a few thousands of dollars [1], only a few sensors are generally installed in a single structure. This low sensor density is usually inadequate for robust damage detection since damage is a local problem that requires high sensor densities to accurately characterize. As a result, many researchers have developed highperformance yet low-cost autonomous wireless sensing systems in the hope they can replace traditional cabled-based monitoring systems [2]. With costs on the order of only a few hundred dollars per node, dense sensor instrumentation strategies are becoming economically viable. Using a wireless monitoring system defined by a high sensor density, one can begin to detect component-level damage over large structural areas (e.g. monitoring local strain, cracking, and corrosion processes). As opposed to identifying insipient structural failure using cabled systems, dense wireless sensor networks
are capable of identifying progressive damage and facilitate timely repairs to prolong the structure’s service lifetime. Although the current generation of academic and commercial wireless sensor platforms offers reliable wireless communications and high resolution sensing, their real merit lies in their embedded data processing capabilities. In tethered monitoring systems, sensor data is collected and stored in a centralized data repository. Centralized repositories can burden the engineer with too much information to process in a timely fashion. On the other hand, when power-efficient computational resources (e.g. microcontrollers) are coupled with each wireless sensing node. This allows raw sensor data to be locally processed with wireless sensors selectively transmitting pertinent information back to the base station. By distributing computational resources throughout the wireless sensor network, computational demands on a data repository can be significantly reduced, thereby allowing real-time system identification and damage detection to be performed. In this study, a prototype wireless sensing system is deployed on the Voigt Bridge (La Jolla, CA) and a historical theatre balcony (Detroit, MI) to validate the system’s performance against commercial data acquisition systems. To showcase the superiority of the wireless system’s embedded data processing techniques, a fast Fourier transform (FFT) and a peak-picking algorithm are embedded at each sensor node to locally interrogate sensor data. The locally-computed frequency response spectra are compared against those calculated by the tethered system’s centralized data repository. Furthermore, operational deflection shapes (which are correlated to mode shapes) for both the Voigt Bridge and historical theatre balcony are computed by the wireless monitoring system using ambient and forced vibrations. II.
WIRELESS SENSING SYSTEM
A. Wireless Sensing Node Hardware In general, each wireless sensor consists of three functional components, namely the data acquisition (DAQ) subsystem, computational core, and wireless communication channel [3]. First, the DAQ subsystem consists of four analog sensing channels capable of interfacing with a variety of commercial sensors (e.g. accelerometers, strain gauges, linear variable differential transducer, among others). A 4-channel 16-bit
(a) 1
2
3
4
5
6
7
8
9
10 6.1 m
Abut. 1 Bent 1
12 13
16.2 m N
Bent 2
14
15
16 17
29.0 m
Wireless network server
Bent 3
18
19
29.0 m
Wireless accelerometer
20
Abut. 2
6.1 m
11
15.2 m
Hammer location
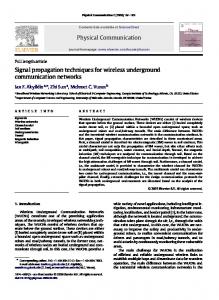
(b) Figure 1. A photograph of the wireless monitoring system. (a) All electronic components are surface mounted to a two-layer printed circuit board (PCB) and (b) encased with batteries in a weatherproof package.
analog-to-digital (A/D) converter (Texas Instruments ADS8341) with a maximum sample rate of 100 kHz, is employed to digitize the analog output of interfaced sensors. Upon digitization, sampled data is locally processed at the computational core using an 8-bit Atmel ATmega128 microcontroller. Here, embedded firmware such as the FFT or peak-picking algorithms can locally interrogate sensor data [4]. Otherwise, the digitized sensor data can be stored within the 4 kB of on-chip data memory or in the additional 128 kB memory bank (Cypress CY62128B) integrated in the sensor design. Finally, data (raw or processed) can be wirelessly transmitted back to the wireless network server or other sensor nodes (in real-time or in delayed intervals). In order to enhance the versatility of the wireless sensing units for operation in different parts of the world, its flexible design allows two different Maxstream wireless transceivers to be used: the 900 MHz 9XCite or 2.4 GHz 24XStream. For the 900 MHz MaxStream 9XCite wireless transceiver (used in this study) the maximum data transmission range is approximately 300 m outdoors and 90 m indoors, making them ideal for most sensor instrumentation layouts in a variety of civil infrastructures. The complete wireless sensor system is shown in Fig. 1. B. Signal Conditioning Module (SCM) For most civil engineering structures ambient and forced vibrations are of low amplitude. Thus, to enhance the sensor’s signal-to-noise ratio, an additional signal conditioning module (SCM) is designed and incorporated within the wireless sensing system. The SCM is designed to amplify up to 20 times and to band-pass filter analog sensor input. Here, a high-pass resistor-capacitor (RC) filter with a cutoff frequency of 0.02 Hz and a low-pass fourth-order Bessel filter with a cutoff frequency of 25 Hz are combined to form the band-pass filter. Since most structural modes of vibration are within this range, it should be noted that high-frequency noise can be removed to enhance sensor data quality without interfering with the ability to capture the dynamics of the system. C. Architectural Design Each node in the wireless sensor network can communicate with the centralized base station to form a simple star-topology sensor network. While this network architecture mirrors that of
Figure 2. The plan view of the bridge with 20 wireless sensors instrumented on the bridge deck (wireless sensors are placed directly over the existing cabled monitoring systems): (a) Configuration 1; (b) Configuration 2.
traditional tethered monitoring systems, computational load is distributed (and not centralized) to achieve a scalable and efficient sensor network capable of processing data in its network. Furthermore, the large communications range (300 m outdoors) permit the deployment of this style of network topology in small- to medium-scale structures. Nevertheless, the wireless sensors are capable of ad-hoc multi-hop topology formation which might be useful for other applications aside from structural monitoring. III.
VOIGT BRIDGE: AMBIENT VIBRATION MONITORING
A. Voigt Bridge and Sensor Instrumentation Layout The Voigt Bridge is located on the University of California, San Diego (UCSD) campus and services light on-campus traffic. The bridge itself is a four-span concrete box girder bridge with a total span of 89.4 m and a skew angle of 32. The bridge carries two opposing lanes of traffic across US Interstate 5. One of the main advantages for validation of the wireless sensing system on this bridge is that a preexisting permanent cabled monitoring system is installed below the bridge deck [5]. Direct comparison of collected time history results between wireless and tethered sensors is possible if the installation location of the wireless sensors is adjacent to the tethered sensors. During this study, 14 to 20 wireless sensor nodes are employed for monitoring the ambient and forced vibration response of the bridge. Furthermore, to illustrate the mobility and versatility of the wireless system, two sensor instrumentation layouts are utilized as shown in Fig. 2. In Configuration 1 as shown in Fig. 2(a), acceleration time histories collected from both systems are compared with each other since the wireless sensors are collocated with tethered sensors. However, for configuration 2 (Fig. 2(b)), the wireless sensors are not installed adjacent to the tethered sensors; rather, wireless sensors are placed on both sides of the bridge deck to obtain the operational deflection shapes of the bridge. B. Ambient Vibration Monitoring and Validation In this part of the validation study, both the tethered and wireless monitoring systems are commanded to record the ambient (traffic-induced) bridge acceleration response. It
0.002 0 −0.002
Wired Wireless
−0.004 −0.006
0
2
4
6 8 10 12 Time (s) (b) Acceleration Time History Record Measured at Sensor Location # 6
0.004 0.002 0 −0.002 −0.004
Wired Wireless 0
2
4
6 Time (s)
8
10
12
(a) FFT Results Comparison at Sensor Location # 2
Fourier Spectra Magnitude
0.004
8
Fourier Spectra Magnitude
Vertical Acceleration (g)
Vertical Acceleration (g)
(a) Acceleration Time History Record Measured at Sensor Location # 2 0.006
4
Wired Wireless
6 4 2 0
0
5 10 Frequency (Hz) (b) FFT Results Comparison at Sensor Location # 6 Wired Wireless
3 2 1 0
0
5
should be noted that the sampling rate of the cabled system is 1 kHz while that of the wireless system is set to 100 Hz. From the time history overlays presented in Fig. 3, it can be seen that the time history response collected from the wireless system coincides precisely with that obtained from the tethered system despite its lower sampling rate. Furthermore, to illustrate that the embedded processing capabilities of the wireless sensing system, each sensor node is commanded to execute the embedded Cooley-Tukey FFT algorithm to determine the bridge Fourier spectra [4]. For the tethered system, the centralized data repository locally processes the time history data streamed from the system sensors. From Fig. 4, it can also be observed that the FFT results overlay precisely with minimal differences between the two. Although these results only represent one of the many tests conducted during the experimental phase of this study, other results show comparable similarity between the two systems. C. Operational Deflection Shape Analysis As mentioned earlier, one of the main advantages of using wireless sensor networks is that data processing can be distributed over the network, thereby reducing computational demand at the central base station. Demonstration of the superiority of distributed data processing is accomplished by embedding a peak-picking algorithm within each sensor node to identify the structure’s first four fundamental modes of
vibration. Upon identifying the modal frequencies, the wireless sensors each transmit the imaginary component of its Fourier spectrum for each modal frequency. Then, the operational deflection shapes for the first four modal frequencies can be obtained by simply plotting the imaginary components of the FFT results against sensor location for each corresponding frequency. Fig. 5 presents the ODSs for the first four modes of deflection obtained from bridge vibrations induced via a modal hammer (Fig. 5(a)) and car traffic (Fig. 5(b)). IV.
THEATRE BALCONY: FORCED VIBRATION MONITORING
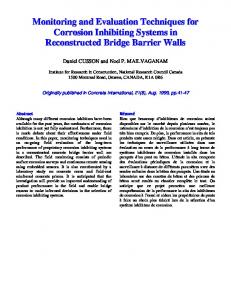
A. Historical Theatre and Instrumentation A historic theatre, located in downtown Detroit, MI offered an opportunity in February 2007 to validate the performance of the wireless monitoring system. The theatre auditorium itself contains two balconies; a main balcony is located on the fifth floor while a loge balcony is at the third level. Due to continuous problems with humanly perceptible vibrations, the main balcony (approximately 50 m wide) is selected for wireless monitoring (Fig.6) [6]. To again validate the wireless system’s performance, the Freedom Data Acquisition System commercially available from Olson Instruments, Inc. is installed in parallel. Here, Dytran accelerometers (models 3165A and 3116A) are connected to the Feedom DAQ to measure the balcony acceleration. Fig. 7 presents the sensor instrumentation layout Mode 1 = 4.82 Hz 0.5
0
0
−2
−0.5
0
5
Mode 2 = 6.12 Hz
10
15
0
0
5
0
5
0
5
0
5
Mode 2 = 6.15 Hz
10
15
10
15
10
15
10
15
0.05
−0.1
0
0
5
Mode 3 = 11.24 Hz
10
15
0.1
−0.05
Mode 3 = 11.42 Hz
0.05 0
0 0
5
Mode 4 = 13.27 Hz
10
15
−0.05
Mode 4 = 13.27 Hz
0.1
0.2
0
0 −0.2
15
Figure 4. Comparison between the FFT spectra as calculated by the cabled and wireless monitoring systems at (a) sensor locatoin #2 and (b) locatoin #6 using sensor Configuration 1.
Mode 1 = 4.82 Hz 2
−0.1
10 Frequency (Hz)
Figure 3. Comparison between acceleration time history records as measured by the cabled and wireless monitoring systems at (a) sensor locations #2 and (b) location #6 using sensor Configuration 1.
−0.2
15
0
5
10 Sensor Locations
15
−0.1
Sensor Locations
Figure 5. The operational deflection shapes for the first four fundamental modes of vibration as obtained using acceleration time history records (collected by the wireless monitoring system) due to a (a) modal hammer striking the bridge deck and (b) car traffic.
Figure 6. A picture showing the historical theatre’s main balcony.
Figure 7. A schematic illustrating the location of both the wired and wireless monitoring systems. Time histories and FFT results as computed by the sensing nodes are shown for the heel-drop test.
for both the tethered and wireless monitoring systems. The locations of the tethered sensors are collocated with wireless sensors 4 and 5 (denoted as 4T and 5T respectively) (Fig. 7). B. Forced Vibration Monitoring Excitation of the theatre’s main balcony is accomplished by performing heel-drop tests (e.g., an engineer drops his/her selfweight on his/her heels). It can be seen from the time history plots in Fig. 7 that, depending on the wireless sensor node location, different magnitudes of balcony vibration are measured. Moreover, the signal-to-noise ratio is high; the signal conditioning module successfully band-passes the signal and removes high frequency noise. Upon collection of the raw time history records, the FFT algorithm is executed to compute the Fourier spectra as shown in Fig. 7. Overlays between the wired and wireless system time history and FFT results suggest excellent correlation. C. Embedded Frequency Domain Decomposition In addition to the peak picking algorithm, the frequency domain decomposition (FDD) method to mode shape determination has also been embedded within each wireless sensing unit. When implemented within a wireless sensing network, this method creates a large array of overlapping twonode mode shapes. This distributed technique provides a great degree of scalability by parallelizing a typically centralized algorithm to be executed by a network of wireless nodes. The embedded FDD technique clearly estimates the first four identified mode shapes of the theatre balcony (Fig. 8).
against tethered monitoring systems has been conducted by comparing the time history responses collected from the Voigt Bridge and historical theatre field tests. The results indicate that the sensor data collected by the wireless system overlays precisely with those from the cabled system. Furthermore, to showcase the superiority of this wireless system, each wireless sensor is commanded to locally process data (FFT, peakpicking, and FDD) to reduce computational demand at the base station. Fourier spectra and accurate mode shapes are calculated by collaborative computing conducted in-network. ACKNOWLEDGMENT This research is supported by the National Science Foundation (Grant Number CMMI0726812). The authors would also like to thank Prof. Kincho Law (Stanford University), Prof. Yang Wang (Georgia Institute of Technology), Prof. Ahmed Elgamal (UCSD) and Dr. Michael Fraser (UCSD). REFERENCES [1]
[2]
[3]
[4]
V.
CONCLUSIONS
In conclusion validation of wireless system performance Mode 1: 2.72 Hz
Mode 2: 4.21 Hz
M. Celebi, Seismic Instrumentation of Buildings (with Emphasis on Federal Buildings). Menlo Park, CA: Report No. 0-7460-68170 United States Geological Survey (USGS), 2002. J. P. Lynch and K. J. Loh, “A summary review of wireless sensors and sensor networks for structural health monitoring,” Shock and Vibration Digest, vol. 38, no. 1, pp. 1-38, 2006. Y. Wang, J. P. Lynch, and K. H. Law, “Wireless structural sensors using reliable communications protocols for data acquisition and interrogation,” Proceedings of the 23rd International Modal Analysis Conference (IMAC XXIII), 2005. J. P. Lynch, “An overview of wireless structural health monitoring of civil structures,” Philosphical Transactions of the Royal Society of London, Series A, Mathematical and Physical Sciences, vol. 365, no. Mode 3: 6.35 Hz
Mode 4: 8.00 Hz
1
1
1
0
0
0
0
−1 20
−1 20
−1 20
−1 20
10
0
−100
0
100
10
0
−100
0
100
1
10
0
−100
0
100
10
0
Figure 8. FDD operational deflection shapes as computed by the wireless monitoring system.
−100
0
100
[5]
1851, pp. 345-372, 2007. M. Fraser, A. Elgamal, and J. P. Conte, UCSD Powell Laboratory Smart Bridge testbed. La Jolla, CA: Report No. SSRP 06/06, University of California, San Diego, Department of Structural Engineering, 2006.
[6]
M. Setareh, Use of Tuned Mass Dampers for the Vibration Control of Floors Subjected to Human Movements. Ann Arbor, MI: Ph.D. Thesis, University of Michigan, 1990.