Wireless Sensing Platform for Remote Monitoring and Control of Wine Fermentation Damith C. Ranasinghe *#1, Nickolas J. G. Falkner *2, Pan Chao #3, Wu Hao #4 *
#
School of Computer Science, University of Adelaide Auto-ID Lab, School of Electrical and Electronic Engineering, University of Adelaide 5005 Adelaide, Australia
1
[email protected] [email protected] 3
[email protected] [email protected]
Abstract— Predictable winemaking depends upon the control of all the factors that affect fermentation, including the grape varieties, yeast selection, enzyme addition, the size and type of the vats, the temperature control regime, nutrient selection, and pumping regimes. The relationship between yeast behaviour and temperature control is well understood, forming the fundamental basis of winemaking. Temperature control in fermentation is crucial to the development of desirable flavours, alcohol levels and colour in all wine making grape varieties. Continuing issues in winemaking include the problems in measuring temperature across a vat, with the existence of large temperature gradients in vats as well as the inability of a single temperature reading to identify temperature differentials across fermentation vats leading to fermentation issues. A seemingly accurate measurement of temperature may be completely incorrect, at potentially high cost. Furthermore, we cannot have the most experienced winemakers everywhere at the same time; therefore, we must depend upon automated measurement and temperature control systems in a number of cases. In this paper we propose a low cost sensor array capable of measuring temperature gradients across vats for real time monitoring of wine fermentation processes and the development of a decision support system based on fuzzy logic to aid winemaking decisions. We have built and tested (both through simulations and in a wine fermentation tank) our system. Keywords – decision support systems, fuzzy logic, fermentation, temperature gradient, sensor array
I. INTRODUCTION There are many factors which affect wine fermentation such as temperature, yeast, nutrients air, and sugar. However, temperature is one of the most important factors that will affect the rate of yeast growth and metabolism, as well as the rate of key enzymatic reactions [1-3]. For example, if the temperature range for fermentation falls outside of desirable parameters this will usually result in low-quality wine [3]. Fermentation in the presence of the pomace, the solid portion of the grapes, seeds and skins after crushing, will not occur uniformly, as the yeast will have different levels of nutrients and the temperature dissipation through the juice/wine will take place at differing rates. Fermentation is a strongly exothermic reaction and the rate of reaction increases with temperature, up to a point at which the yeast can no longer ferment (usually leading to their premature death). Consequently, controlling temperature in the winemaking process is critical for: i) producing wines with desirable
978-1-4673-5501-8/13/$31.00 © 2013 IEEE
sensory qualities; and ii). minimising the energy consumption in the cooling systems of the wineries [1,2,4]. Controlling fermentation automatically requires sensors to monitor the fermentation process. Temperature has traditionally been used for control because it is easy to measure. Fermenting tank temperatures are often taken at a small number of fixed sites or from a thermometer inserted into the top of the tank. The heavily localized nature of red wine (pomace present) fermentation means that any fixed sensors may measure a local spot that does not reflect global tank temperature, while any ‘top’ measure may either reflect an artificially high temperature (due to convection currents) or be heavily masked by the presence a layer of pomace that rests on top of the wine (cap) [4]. Furthermore, fixed sensors face a number of mechanical problems in that internal sensors may be deformed by the action of tank agitation, the introduction of drainage or filling hoses, or, in some cases, the entrance of workers into the tank to clean it. Fixed sensors, usually made from stainless steel, are fixed to the shell of the tank and are expensive to install and equally expensive to reinstall, replace and fix. In addition, unlike larger wineries, smaller wineries generally perform temperature measurements manually to reduce the cost of deploying wired sensor and actuation infrastructure. However, such manual processes are not only error-prone but inconvenient and labour intensive since temperature readings are done every few hours for every fermentation vat. More significantly, Schmid et al [5] recently identified large temperature gradient vertically along red wine fermentation tanks and noted that thorough mixing was required to reduce the temperature differential across the must to less than 5 oC. However, single temperature measurements often used to make key winemaking decisions (the application of chilling or heating, or the addition of more nutrients) is unable to convey information associated with temperature gradients across vats. Finally, winemaking decisions are usually made in conjunction with the winemaker’s experience and common sense. Increasingly large tank farms and automation can place severe demand upon human experience, as well as fatigue having severe effects upon decision making. During vintage, when many wineries operate on an 18-24 hour cycle, human fatigue is inevitable and the cost of mistakes is very high.
503
IEEE ISSNIP 2013
Therefore, the aim of our proposed approach is to: i) provide a low cost approach for accurate resolution of temperature across an entire fermenting vat (therefore exposing temperature gradients and thermal pockets) as opposed to several localised sites across the tank; and ii) provide an automated decision support system to alleviate the demands upon extensive human experience to make wine making decisions. While being low cost, our approach overcomes the significant problems associated the inability of a single temperature reading to expose temperature gradients and thermal pockets in vats [4]. Our approach is based on using a wireless sensor network based monitoring and control system. In this paper we present: An innovative design of a wireless Resistance Temperature Detectors (RTD) sensor array capable of real-time monitoring of fermentation vats built from bio compatible materials; and A novel fuzzy logic based decision support system to aid the control fermentation temperature gradients in tanks by, for the first time, taking into consideration large thermal gradients and thermal pockets that have recently been shown to exist in vats. Through this project, winemakers can make reliable indication of temperature control processes. The rest of the paper is organised as follows: Section II presents related work; Section III presents an overview of the systems architecture; Section IV discussed the hardware design of the wireless sensor array; Section V details the decision support system; Section VI provides results of extensive experiments performed to evaluate the systems; and we conclude the paper in the final section. Sensor array with RTD sensors in wine fermentation tank
Mote Tier
a tank. Although [6] presents a wireless sensor network for monitoring wine fermentation temperature of vats, their approach is based on a single temperature sensor. None of the approaches in literature has sought to control wine fermentation based on the existence of large temperature gradients recently identified in [5]. From these works, general industry solution relies upon the setting of a simple trigger point for the temperature probes in a tank, at which point cooling is applied until a lower bound is reached. The use of multi-reading, model-based intelligent sensing does not appear to have been applied at the industrial scale in this industry [7]. In contrast, our proposed fuzzy logic based decision support system closely follows the fermentation process in three different stages where both the temperature range, gradient, and thermal pockets are considered in the decision. III. SYSTEMS ARCHITECTURE Fig. 1 provides an overview of the proposed systems architecture of the fermentation monitoring and control platform. The key modules of the system are: i) the RTD sensor array probe, ii) the voltage transducer; iii) the wireless sensor network node (mote); and iv) the decision support system. In Fig. 1, the mote tier consists of the RTD sensor array probe and the voltage transducer integrated with the mote. The voltage transducer is a current-to-voltage transducer which measures the amount of current being sent through the transducer and converting it into an analogue voltage signal that can be sampled transmitted to the server tier (see Fig. 1). In the server tier, a simple serial forwarder (middleware) is used to forward data to the decision support system and sensor database for persistence storage. Finally, the decision support system based on fuzzy logic is used to provide winemaking decisions: i) heat; ii) cool; or ii) pump over to the winemaker. IV. HARDWARE DESIGN
A. The sensor array probe Measuring temperature gradient across a fermentation tank requires multiple temperature sensors to be deployed in a vat. UART interface In particular the sensor array must: i) be constructed from food Database Server Tier Middleware grade materials, preferably stainless steel; ii) be water proof at for sensor data storage depths of over 5 m; and iii) have an adequate response time so Network that temperature sensors reach equilibrium with the surrounding wine in or order of several seconds. Consequently, we designed a sensor array constructed from stainless steel and Decision support system Client Tier food grade polyethylene to accommodate seven RTD sensors. Fig. 1. Over view of fermentation monitoring and control platform The temperature gradients in [5] supported the separation of sensors around 300-500 mm. Fig. 2 illustrate the design of the II. RELATED WORKS sensor array. The height of the tube is selected to be 2.5 m to Most researchers have focused on high quality wine allow insertion into typical 5000 L medium scale fermentation production [7-13] based on using wireless sensors for tanks The seven circular incisions are used to contain the RTD management of vineyards and cellars in contrast to the sensors. These incisions are needed to be at least 15 mm deep monitoring and control of fermentation processes. to ensure that the RTD sensor did not protrude into the wine as Subsequently there are limited publication on automated this is critical for preventing potential damage to the sensors (a control systems for controlling fermentations such as in [2] present problem with fixed sensors in a vat), particularly as a and [6]. In [2], a fuzzy logic based wine fermentation result of pomace. The choice of RTD sensors was made based controller they rely on a single temperature measurement from Air interface
Base Station
504
on their rapid response (several milliseconds) accuracy, repeatability, and stability compared to alternatives such as thermocouples. There are different types for RTD sensors. In particular, we select the 3-wire RTD sensor since the 3-wire interface can eliminate the influence of the wire resistance when measuring temperature.
adequate resolution of temperatures readings (based on the MDA300 sensor board the desirable range is from 0 – 2.5 V). The basic principle of the transducer is to use a current source (or voltage source and a voltage regulator) and an amplifier generates a voltage signal (Vout) as outlined in Fig. 3.
Fig. 3. Basic principle of transducer.
The resistance of RTD sensor will be increased with the rising temperature. However, the relationship between resistance and temperature is not linear, as shown in Fig. 4. Therefore, when the RTD is excited by a constant current source, there is nonlinearity between its voltage and the temperature change as shown in Fig. 5. In order to reduce this nonlinearity, the excitation current must be increased with the temperature rises as achieved with the positive feedback of an amplifier (see Fig. 5). 400
RTD voltage is gradually boosted with increasing excitation current
300 250
200 150
100
100 Ω at 0˚C
Curvature due to second-order nonlinearity
RTD voltage
Resistance (Ω )
350
RTD resistance with second-order nonlinearity
50 0 -100 0 100 200 300 400 500 600 700
Temperature (° C)
-100
-50
0
50 100
150 200 250 300 350 400
RTD temperature (° C)
Fig. 4 RTD resistance vs temperautre curve and voltage vs temperature curve
Fig. 2. Illustration of the sensor array probe design.
B. Wireless sensor network node
Fig. 5 Schematic of transducer where (A) is an RTD sensor simulator. 3
Output voltage (V)
The wireless sensor network node employed is based on a commercial off the shelf (COTS) platform from Crossbow®. In particular the combination of a MICAz mote and MDA300CA sensor board was used as the platform for low-power data acquisition and transmission along with a MIB520 base station to implement our mote tier. We utilized the analogue inputs from the MDA300 sensor board to sample the voltage signals generated by the voltage transducer based on the temperature readings from the RTD sensors. C. Voltage transducer
2
1 Since the wireless sensor board (MDA300CA) can only sample a voltage signal, the RTD sensors could not be directly 0 connected to the sensor board since the RTD sensors only 0 20 40 60 Temperature (° C) produce a temperature-to-resistance transformation. In order to address this issue, a voltage transducer is required transform Fig. 6 Simulated output voltage of the transducer design. the change in resistance to voltage signal. It is highly desirable Fig. 5 shows the schematic of the transducer for one RTD to have a linear transducer output to direct transformation of sensor based on using the OPA2188 operation amplifier. In voltage signals to temperature data. Furthermore, the dynamic Fig. 5, block labelled ‘A’ is the RTD simulator used in the range of the transducer must be wide enough to allow
505
design process. The voltage of VT+ corresponds to the temperature of the RTD. The simulated output of the transducer is shown in Fig. 6. First, it can be observed that the dynamic range of the transducer is from 28.76 mV to 2.39 V, which is very close to the desirable range of 0 to 2.5 V. Secondly, the voltage output is has a near linear relationship with temperature. stage 1
stage 2
stage 3
gradually reduces as the grape sugars are exhausted and the yeast population declines in the absence of food. B. Controller Concepts The goal of the controller is to provide feedback to the winemaker to ensure that the wine temperature is in an acceptable range and the temperature the wine follows the desired profile for a particular grape variety. An overview of the fuzzy controller structure is shown in Fig. 8.
Temperature (° C)
TABLE I INPUT AND OUTPUT VARIABLES Input variables AvgTemp Rate Stage Output variable TempCont
Description Average Temperature rate of change of temperature stage of the fermentation process Description Recommended temperature control action
Measurement times
Fig. 7 Measured red wine fermentation temperature profile
V. DECISION SUPPORT SYSTEM DESIGN Temperature readings
Stage
(a) Input variable “AvgTemp”
d/dt AvgTemp
Rate
Fuzzification
Fuzzy Reasoning Rule
(b) Input variable “Rate” Defuzzification
TempCont
Fig. 8 Fuzzy controller structure
A. Design of the fuzzy logic control block We have applied a simple fuzzy logic controller with a rule base knowledge representation to fulfil the monitoring and decision support module. A fuzzy logic controller was a natural choice based on: i) robustness; ii) ease of modification; iii) ability to use multiple inputs and outputs sources; iv) ability to develop rapid prototypes; v) low implementation cost; vi) ability to use linguistic variables describe rules. The goal of the fuzzy controller is to closely follow the expected temperature profile of a particular grape variety. Fig. 7 shows the typical temperature profile of a red wine fermentation process obtained over 12 days where 3 temperature measurements were taken each day. Generally it is possible to identify 3 stages in the fermentation process. The first stage is when fermentation is commencing, the second stage is where fermentation is taking place at approximately a constant rate and finally the third stage occurs when the fermentation rate
(c) Input variable “Stage”
(d) Output variable “TempCont” Fig. 9 Graphical representation of membership function for input variables and output variable
Considering the: i) stage of the fermentation process; ii) the average temperature readings from the seven sensors; and iii) the rate of change of temperature over time, three inputs are converted to fuzzy variables. Given that a winemaker has
506
two choices (apply heat or cooling without the ability to define the level of heating of cooling) a single output is desired. Table I provides a summary of the input and output variables to the controller.
16 17
Slow increase Fast increase
Do nothing Cooling
Furthermore, it is also necessary to decide whether mixing (achieved by way of pumping wine over the top of the vat) is required to achieve a uniform temperature distribution in the C. Membership functions presence of large temperature gradients across the wine or Fig.9 shows the graphical representation of the membership thermal pockets (localised area of high temperature). Pump function for input linguistic variables for the three inputs to over control decisions will be made by following the simple the fuzzy logic based decision support system. control policy below: Pump over when the maximum temperature gradient D. Knowledge Representation among the seven sensors is larger than 5 °C. After fuzzification of input variables the controller must The rule block in Table II summarises the knowledge base include knowledge to decide the course of action to recommend to the winemaker. The following describes the of the decision support system and control policy of the fuzzy control process for wine fermentation based on expert logic controller based on the membership functions described knowledge: in Fig. 11. The “IF” section of the rules describes the situation under which the rules will trigger, while the “THEN” section Stage 1: Only required to take Rate into consideration. If ‘Rate’ is increasing rapidly, then the vat is required to be describes the response of the fuzzy system in response to the cooled. If Rate is decreasing too rapidly then heat must be given situation. For instance, the first rule implies that if the fermentation is in stage 1 and rate of change in temperature applied to the vat. Stage 2: Switch over to stage 2 will take pace rapidly decreasing, then the wine-making decision is indicated automatically when the temperature braches 27 °C. In this as to heat the vat. stage the temperature needs to be regulated to VI. SIMULATION AND EXPERIMENTAL RESULTS approximately between 20 °C and 28 °C. If AvgTemp Pump over control exceeds 27 °C, then cooling needs to be applied to the vat. Max Maximum Pump over decisions gradient + If AvgTemp is between 20 and 27 °C, then no action is Judgment 2 Min Subtract required and no consideration needs to be paid to Rate. In a PumpOver situation where AvgTemp is below 20 °C, heat if Rate is Real wine data AvgTemp Temperature rapidly decreasing but no action is required if Rate is 7RTDs control decisions Rate Sum 1 rapidly increasing decreasing slowly. Fuzzy controller Divide Fuzzy logic 7 du/dt TempCont Stage 3: Switch over to stage 3 if AvgTemp continuous to controller with Constant Derivative Ruleviewer decrease over 3 consecutive measurements and we are Stage currently in stage 2. Stage 3 is similar to stage 1 and we are Fig. 10 An Overview of the decision support system only required to consider the Rate and intervene only if the Wine temperature Rate is rapidly decreasing or increasing. TABLE II FUZZY RULE SETS FOR THE THREE FERMENTATION STAGES In Stage 1 Rules
IF Rate is
1 2 3 4 5
Fast decrease Slow decrease Zero Slow increase Fast increase
Rules
IF
6 7 8 9 10 11 12 Rules
Rate is Fast decrease AND AvgTemp is Cold Rate is Slow decrease AND AvgTemp is Cold Rate is Zero AND AvgTemp is Cold Rate is Slow increase AND AvgTemp is Cold Rate is Fast increase AND AvgTemp is Cold AvgTemp is Cool AvgTemp is Hot In Stage 3 IF Rate is
13 14 15
Fast decrease Slow decrease Zero
THEN TempCont is Heating Do nothing Do nothing Do nothing Cooling
Temperature
Actual temperature control decisions
Heat
In Stage 2
Cool
THEN TempCont is Heating Heating Do nothing Do nothing Do nothing Do nothing Cooling THEN TempCont is Heating Do nothing Do nothing
Expected temperature control decisions
Heat Cool
Actual pump over decisions
Pump over No pump over
Expected pump over decisions
Pump over No pump over
Measurement times
Fig. 11 Simulation results for wine fermentation process
Fig. 10 shows the complete decision support system including the fuzzy logic controller built in Matlab. In Fig. 10, temperature data from seven different sensors have been taken as the system input. The AvgRate is evaluated by calculating
507
the average of the seven temperature readings, while Rate is evaluated by using the derivative function. Finally, defuzzification was carried out using the more popular centroid method. The ‘pump over’ function is realized by evaluating the maximum gradient of the seven sensors. A pump over decision is recommended when the maximum gradient is larger than 5 °C. C A B
We are successfully built and evaluated a multi sensor array probe to aid winemakers with make more informed decision regarding the processes involved in the control of fermentation. We have also sought to address a knowledge gap by allowing less inexperienced, or fatigued, winemakers to produce high quality wine using a decision support system based on expert knowledge. The system has been shown to work accurately through both simulation and real life tests. Future works include collecting more ground truth data to validate this system as well as the integration of sensors to measure density of the grape juice. ACKNOWLEDGMENT The authors would like to thank Mr. B. Pullen and Mr. I. Linke for their help and guidance in the construction of the stainless steel probe and gratefully acknowledge the support of a Wine2030 Research Network Grant, awarded 17 Feb., 2012.
Fig. 12 Testing scene of wine temperature (A) wine fermentation tank and sensor array (B) base station (C) monitor and control system run on PC. The tank used in the experiments is shown in the right along with the embedded mote within in the stainless steel structure.
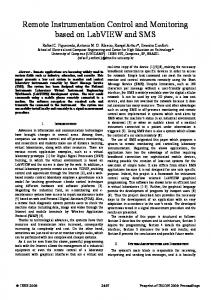
Fig. 11 shows the simulation results for a red wine fermentation process lasting 12 days. Here, 36 samples of temperature data (3 measurements per) are used. It can be seen that the decision support system controller can work successfully to indicate right wine-making decisions in case of different situations simulated in the data. For instance, the system will recommend the correct decision to pump over when meeting thermal pockets (seen at measurement 5 and 30). Also, during conditions of rapid fermentation (measurements 10, 12 and 14) and slow fermentation (measurements 20 and 30), the system will indicate to cool and heat respectively. C. Test results in a fermentation tank We evaluated our sensor probe at The Waite Research Institute for wine at the University of Adelaide. We employed a 5000 L red wine fermentation tank for testing. Fig. 12 illustrates the probe and the measurement system during the test and Fig. 16 is a snapshot of the interface of the integrated real-time temperature monitor and decision support system.
Fig. 13 Interface of integrated monitoring and decision support system
VII. CONCLUSION
REFERENCES [1] A. López, T. Fernández, rseda, G. art ne , and J. Lacalle, “Alcoholic fermentation exotherm modelling for refrigeration systems optimising in wineries,” Proceedings of the International Congress on Modelling of Thermal Properties and Behaviour of Foods during Production, Storage and Distribution, Prague, 23–25 Jun.e 1997: [2] G. art ne , A. López, A. Esnoz, rseda, J. Ibarrola, A new fuzzy control system for white wine fermentation, Food Control, Vol 10 (3), pp. 175-180, 1999. [3] P. Ribereau-Gayon, B.D. Dubourdieu, A. Lonvaud. Handbook of enology vol 1. The microbiology of wine and vinifications. 2nd edition. John Wiley and Sons Ltd, 2006. [4] M. Isabel Zenteno, J. Ricardo Pérez-Correa, Claudio A. Gelmi, Eduardo Agosin, Modeling temperature gradients in wine fermentation tanks, Journal of Food Engineering, Vol. 99 (1), pp. 40-48, 2010. [5] F. Schmid, J. Schadt, V. Jiranek, and D.E. Block “Formation of temperature gradients in large- and small-scale red wine fermentations during cap management”, AJGWR, Vol. 15 (3), pp. 249-255, 2009. [6] K. Scharfglass, A. Lehmer and J. Oliver, “Wireless Sensor Network for Wine Fermentation,” roject Report, California Polytechnic State University, San Luis Obispo, 2012. [7] Sophie Colombié, Sophie Malherbe, Jean-Marie Sablayrolles, Modeling of heat transfer in tanks during wine-making fermentation, Food Control, Vol. 18 (8), pp. 953-960, 2007. [8] Luciano Boquete, Rafael Cambralla, J.M. Rodríguez-Ascariz, J.M. Miguel-Jiménez, J.J. Cantos-Frontela, J Dongil, “ ortable system for temperature monitoring in all phases of wine production,” ISA Transactions, Vol. 49 (3), Pages 270-276, 2010. [9] Anastasi, G.; Farruggia, O.; Lo Re, G.; Ortolani, M.; , "Monitoring High-Quality Wine Production using Wireless Sensor Networks," 42nd Hawaii International Conference on System Sciences, Hawaii, 5-8 Jan. 2009 [10] R. Beckwith, D. Teibel, P. Bowen “Unwired wine: sensor networks in vineyards,” Proceedings of IEEE Sensors, Austria, 24-27 Oct. 2004. [11] Galmes S. “Lifetime issues in wireless sensor networks for vineyard monitoring,” IEEE international conference on mobile adhoc and sensor systems, 9-12 October, Canada, 2006. [12] Burini A, et al. “Multi-temporal high-resolution polarimetric L-band SAR observation of a wine-producing landscape,” IEEE International Conference on Geoscience and Remote Sensing Symposium, Denver, 31 Jul – 4 Aug, 2006. [13] M. Vall-Llossera, et al. “SMOS REFLEX 2003: L-Band emissivity characterization of vineyards,” IEEE Transactions on Geoscience and Remote Sensing Vol. 43 (5), pp. 973–982. [14] Nour M.I.H, Ooi J. and Chan K.Y., “Fu y logic control vs conventional ID control of an inverted pendulum robot”, Proceedings of ICIAS International Conference on Intelligent and Advanced Systems, Malaysia, 25 Nov - 28 Nov, 2007.
508