Home
Search
Collections
Journals
About
Contact us
My IOPscience
Wireless sensing without sensors—an experimental study of motion/intrusion detection using RF irregularity
This article has been downloaded from IOPscience. Please scroll down to see the full text article. 2010 Meas. Sci. Technol. 21 124007 (http://iopscience.iop.org/0957-0233/21/12/124007) View the table of contents for this issue, or go to the journal homepage for more
Download details: IP Address: 192.122.131.20 The article was downloaded on 23/01/2011 at 06:42
Please note that terms and conditions apply.
IOP PUBLISHING
MEASUREMENT SCIENCE AND TECHNOLOGY
doi:10.1088/0957-0233/21/12/124007
Meas. Sci. Technol. 21 (2010) 124007 (7pp)
Wireless sensing without sensors—an experimental study of motion/intrusion detection using RF irregularity Pius W Q Lee1 , Winston K G Seah2 , Hwee-Pink Tan1 and Zexi Yao3 1
Institute for Infocomm Research, 1 Fusionopolis Way, 21-01 Connexis, Singapore 138632 School of Engineering and Computer Science, Victoria University of Wellington, PO Box 600, Wellington 6140, New Zealand 3 Raffles Institution, 1 Raffles Institution Lane, Singapore 575954 2
E-mail:
[email protected]
Received 25 March 2010, in final form 24 September 2010 Published 29 October 2010 Online at stacks.iop.org/MST/21/124007 Abstract Motion and intrusion detection are often cited as wireless sensor network (WSN) applications with typical configurations comprising clusters of wireless nodes equipped with motion sensors to detect human motion. Currently, WSN performance is subjected to several constraints, namely radio irregularity and finite on-board computation/energy resources. Radio irregularity in radio frequency (RF) propagation rises to a higher level in the presence of human activity due to the absorption effect of the human body. In this paper, we investigate the feasibility of monitoring RF transmission for the purpose of intrusion detection through experimentation. With empirical data obtained from the Crossbow TelosB platform in several different environments, the impact of human activity on the signal strength of RF signals in a WSN is evaluated. We then propose a novel approach to intrusion detection by turning a constraint in WSN, namely radio irregularity, into an advantage for the purpose of intrusion detection, using signal fluctuations to detect the presence of human activity within the WSN. Unlike RF fingerprinting, the ‘intruders’ here neither transmit nor receive any RF signals. By enabling existing wireless infrastructures to serve as intrusion detectors instead of deploying numerous costly sensors, this approach shows great promise for providing novel solutions. Keywords: wireless sensor networks, radio irregularity
(Some figures in this article are in colour only in the electronic version)
does not require wiring, can be quickly deployed in a rugged environment and provides a diligent and automated watch guard against intruders. Currently, security and surveillance applications of WSN are subject to a unique set of resource constraints: finite on-board battery power, limited network communication bandwidth and the phenomenon of radio irregularity. Finite on-board battery requires the deployment of a large number of sensor nodes for redundancy. Besides the wireless transmission hardware, motion detection and other sensing hardware draw down further on the limited power supply. Radio irregularity is a common and non-negligible phenomenon in wireless communications. The variance in the signal path loss is one of the major causes of radio irregularity,
1. Introduction A wireless sensor network (WSN) comprises sensor nodes which collaborate to observe some physical conditions such as temperature, pressure and humidity. Deployment of low-cost wireless sensors is a useful technique for several applications ranging from early warning systems for natural disasters (like tsunamis and wildfires), ecosystem monitoring, real-time health monitoring, to homeland security and surveillance. WSN technology shows great promise for providing novel solutions to various security and intrusion detection applications. By deploying clusters of small, intelligent intrusion detection wireless sensor devices, a large area can reliably be monitored for trespassers. Such a system 0957-0233/10/124007+07$30.00
1
© 2010 IOP Publishing Ltd
Printed in the UK & the USA
Meas. Sci. Technol. 21 (2010) 124007
P W Q Lee et al
which manifests itself in terms of irregularity in radio range and variations in packet loss in different directions. The adverse impact of radio irregularity on the performance of WSN protocols has been studied in [1]. When a signal propagates within a medium, it may be reflected, diffracted and scattered [2]. Each effect occurs to a different extent in various media, depending on factors such as wavelength and intensity of the wave, thickness and physical composition (permittivity and permeability) of the medium. The human body comprises liquid, bone and flesh, which selectively absorbs, reflects or scatters RF signals. Consequently, in the presence of human activity in the network, different components of a signal are absorbed at different time instances, resulting in signal strength fluctuations at the receiver. Thus, in RF propagation, radio irregularity arises to a higher level in the presence of human activity. This correlation provides a theoretical basis for the engineering goal of this research, where we investigate the feasibility of intrusion detection using the phenomenon of radio irregularity in the WSN, instead of the traditional approach of using specialized sensor hardware where pioneering work on intrusion detection using electromagnetic waves was done in the 1970s by Gehman [3, 4] and others [5, 6]. The moving bodies in our study neither receive nor transmit any form of wireless signals, and therefore it is unlike RF fingerprinting ([7, 8] and references therein) that aims to detect the presence of unauthorized nodes and devices in a wireless network by analysing their RF signature. In the following section, we briefly discuss the related work on motion detection using signal level fluctuations in WSN. In section 3, we describe our experimental approach for monitoring fluctuations in RF transmissions using Crossbow TelosB motes4 and the empirical data collection process. We conducted experiments to assess the impact of sensor height on performance and discuss the findings in section 3.1. Next, we discuss the experiments done in realistic indoor and outdoor environments in section 3.2. Based on the findings from the experiments, we then propose a novel intrusion detection scheme in section 4 and present further test results for validation. Lastly, we conclude in section 5 with some discussion on how this scheme can be applied in security monitoring and intrusion detection systems.
the network leaves a characteristic footprint on signal strength patterns, which they exploit to estimate the velocity of an object. Existing wireless infrastructures like WiFi and GSM also provide similar opportunities. In [11], the authors show how motion sensing can be achieved by observing WiFi radio signal strength and its fluctuations. Fluctuations in GSM signal levels have also been used for detecting users’ motion [12, 13]. In [12], the authors adopt a neural network approach to distinguish user motion from GSM signal level changes. However, their scheme requires the neural network to be retrained for different environments. The use of signal traces from the GSM network for detecting users’ motion is also reported in [13]. Their system achieves an overall accuracy of 85% and is able to extract a set of seven features to classify the user state as either still, walking or driving. From the preceding discussion, we note that most of the work has focused on inferring a node’s movement from changes in its received signal levels. Although it has been mentioned in [10] that the motion of objects external to the network also induces signal level changes, there has been no conclusive method to detect foreign objects moving within a network with some level of accuracy, mainly because signal fluctuations differ across different environments and conditions [12]. In this paper, we propose a means to detect the presence of foreign (non-transceiving) objects moving in a network (in particular, human activity) by analysing the signal strength fluctuations between communicating network nodes arising from interferences to signal propagation. In this way, existing wireless infrastructures can be turned into intrusion detection systems without the need to install expensive specialized sensors.
3. Approach In order to exploit the effects of radio irregularity, we need to characterize the fluctuations and translate them into sufficiently consistent outcomes that correspond to human activity. The first part of our study involves a preliminary investigation to determine the feasibility of motion detection using radio signal strength indicator (RSSI) readings. Based on the results from this preliminary investigation, we then derive a method to detect motion, and evaluate the success of this method by further experiments.
2. Related work Although specialized sensors and beacons, such as the accelerometer, pedometer or motion sensor, offer precise motion inference [9], they are too expensive and obtrusive for widespread deployments. This prompted efforts to develop alternative motion detection techniques that can be widely deployed for use in today’s networks. It has been observed that multi-path fading and shadowing affect the received signal strength and thus embed sensing capabilities into the RF signal which can be exploited in various ways [10]. The authors, through experiments conducted using Mica2 motes, show that node mobility in a network or the motion of objects external to 4
3.1. Sensor height variation—performance issues Network devices such as wireless local area network (WLAN) access points tend to be deployed at elevated locations, e.g. near the ceiling, for better signal transmission and reception. Experimental studies of the radio performance of wireless sensor nodes have also shown that the height at which nodes are placed has a major impact on the link performance [14]. Nodes placed on or near the ground have the worst link performance, which improves as the nodes are elevated higher. These findings are also reported by other studies, e.g. [15, 16]. Wireless sensor network deployment would therefore benefit from node placement that takes these into consideration, that
Crossbow Technology Inc., http://www.xbow.com.
2
P W Q Lee et al Signal Strength at Receiver (dBm)
-81
-82
-83
-84
-85 00:00
02:00
04:00
06:00
08:00
10:00
12:00
14:00
16:00
18:00
20:00
-66 -68 -70 -72 -74 -76 -78 -80 -82 -84 -86 -88 -90 00:00
04:00
06:00
08:00
10:00
12:00
Time (mm:ss)
(a)
(b)
450
450
400
400
350
350
300 250 200 150 100
14:00
16:00
18:00
20:00
300 250 200 150 100
50
50 +17
+16
+15
+14
+13
+12
+9
+11
Signal Strength Fluctuation (dBm)
(c)
+10
+8
+7
+6
+5
+4
+3
+2
0
-1
+1
-2
-3
-4
-5
-6
-7
-8
-9
-10
-11
-12
-13
-14
-15
-16
-17
+17
+16
+15
+14
+13
+12
+9
+11
Signal Strength Fluctuation (dBm)
+10
+8
+7
+6
+5
+4
+3
+2
0
-1
+1
-2
-3
-4
-5
-6
-7
-8
-9
-10
-11
-12
-13
-14
-15
0 -16
0 -17
02:00
Time (mm:ss)
Average Frequency
Average Frequency
Signal Strength at Receiver (dBm)
Meas. Sci. Technol. 21 (2010) 124007
(d)
-75
Signal Strength at Receiver (dBm)
-76
-77
-78
-79 00:00
02:00
04:00
06:00
08:00
10:00
12:00
14:00
16:00
18:00
20:00
-76 -78 -80 -82 -84 -86 -88 -90 -92 -94 00:00
02:00
04:00
06:00
08:00
Time (mm:ss)
10:00
(a) 450
400
400
350
350
300 250 200 150 100 50
16:00
18:00
20:00
300 250 200 150 100 50 +11
+9
+10
Signal Strength Fluctuation (dBm)
(c)
+8
+7
+6
+5
+4
+3
+2
+1
-1
-2
-3
-4
-5
-6
-7
-8
-9
-10
-11
+11
+9
+10
Signal Strength Fluctuation (dBm)
+8
+7
+6
+5
+4
+3
+2
+1
0
-1
-2
-3
-4
-5
-6
-7
-8
-9
0 -10
0 -11
14:00
(b)
450
Average Frequency
Average Frequency
12:00
Time (mm:ss)
0
Signal Strength at Receiver (dBm)
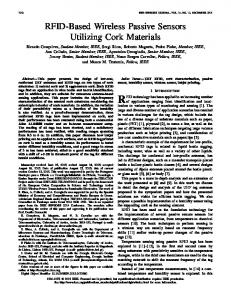
Figure 1. Signal strength and fluctuation rate at height 1.5 m. (a) Signal strength with no movement, (b) signal strength with movement, (c) fluctuation rate distribution with no movement and (d) fluctuation rate distribution with movement.
(d)
Figure 2. Signal strength and fluctuation rate at height 3 m. (a) Signal strength with no movement, (b) signal strength with movement, (c) fluctuation rate distribution with no movement and (d) fluctuation rate distribution with movement. Table 1. Mean and standard deviation of absolute RSSI values. Experiment
Location
scenario
description
Mean
No movement Standard deviation
Mean
Movement Standard deviation
A B C D E
Large multi-purpose hall Four-person dormitory room Sports field One-person bedroom Large outdoor garden
−39.789 −39.163 −43.073 −70.000 1.509
0.413 0.822 0.207 0.018 0.145
−44.698 −40.094 −40.050 −73.229 −1.376
1.445 0.871 1.246 1.612 0.354
ground up to the 3 m high ceiling of the room. We observed signal fluctuation rate under different height placements when a human subject walks along a predetermined path that cuts across the signal transmission path from transmitter to receivers at different distances away. For the case of no movement in the room, the room is simply vacated. These motes can detect signal strength in decibelmilliwatts (dBm) to the nearest integer. The receiver receives packets at discrete time intervals t0 , t1 , . . . , tn , monitoring
is, deploy nodes at a height above the ground. We first study the characteristics of signal fluctuations caused by human activity between communicating sensors deployed at different heights. This will serve as the basis for our subsequent experiments in different environments, both indoors and outdoors. Crossbow TelosB motes were placed in different corners of a 4 m × 2.5 m room with one node continuously transmitting packets at intervals of 2 s. Experiments were conducted with the height of motes varied from about 1 m off the 3
Meas. Sci. Technol. 21 (2010) 124007
P W Q Lee et al
both the absolute value and the instantaneous fluctuation rate of signal strength over a 20 min interval. To reduce arbitrary randomness, we conduct our experiments over a 2 week period, averaging the results over several trials. Since signal strength varies with time non-deterministically, it is meaningless to average the values over time; hence, we plot a histogram showing the frequency distribution of each fluctuation rate value. It is then useful to average the fluctuation rate over several trials. From the various scenarios studied, we select and present the results from two scenarios which are able to provide us with reasonable indications of the performance issues. In the first scenario, nodes are placed at a height h = 1.5 m, which is good for transmission, and also for detection purposes since it is around or slightly lower than the height of a person so that the human subject obstructs the line-of-sight path between the transmitter and receiver. In the second, nodes are placed near the ceiling at a height of h ≈ 3 m where wireless communications devices and gateways are typically deployed. Results for h = 1.5 m are shown in figure 1. Figures 1(a) and 1(b) show absolute signal strength over a single run. Figures 1(c) and 1(d) show the fluctuation rates and their average frequencies. The results show that with no movement, signal strength is fairly stable, fluctuating between −85 and −82 dBm. Fluctuation rate is small, with no fluctuation most of the time and a maximum change of ±2 between any 2 s interval. Fluctuation rates of +2 and −2 both occur at an average frequency of 0.8 times each. With movement, signal strength is unstable, and fluctuation rate varies greatly. Our results for h ≈ 3 m are shown in figure 2. The results are similar to those for h = 1.5 m. Without movement, signal strength remains stable, oscillating between −78 and −76 dBm; fluctuation rate remains within ±2. Fluctuation rate of +2 was observed 1.6 times, and −2 was observed 1.2 times. With movement, the signal is unstable and fluctuation rate takes on a smaller range of values (±11) than those at h = 1.5 m (±17). This is due to the nodes being much higher and hence less multi-path components are being blocked by the person. Hence, to provide signal fluctuations of a sufficient degree for detection, a height of 1.5 m is selected for our subsequent experiments.
Frequency (%)
100 80 60 40 20 0 -46
-44
-42 -40 RSSI (dB) no movement movement
-38
-36
(a) Frequency (%)
100 80 60 40 20 0 -48
-46
-44
-42
-40
-38
-36
-34
-32
-30
-28
RSSI (dB) no movement
movement
(b) Frequency (%)
100 80 60 40 20 0 -48
-46
-44
-42
movement
-40 -38 -36 RSSI (dB) no movement
-34
-32
(c) Frequency (%)
100 80 60 40 20 0 -90
-85
-80 -75 RSSI (dB) no movement movement
-70
-65
(d)
Frequency (%)
100
3.2. Scenario-based experimentation and analysis of results Next, we conduct the experiments in different realistic scenarios. We deploy pairs of Crossbow TelosB motes in five different environments as shown in table 1. We consider (i) indoor environments that differ in size and content such as a large multi-purpose hall (A), a four-person dormitory (B) and a one-person bedroom (D), (ii) outdoor environments such as a sports field (C) and (iii) a semi-outdoor large garden (E). Pairs of motes are placed at a height of 1.5 m and spaced between 3 and 5 m apart. Over a 15 min interval, one mote continuously sends packets p0 , p1 , . . . to the other with an inter-packet interval between 0.25 and 2 s; the receiver simply monitors the absolute RSSI, S(px ), of each received packet, px for two scenarios: with movement—where a human subject walks between the pair of motes for each trial—and without movement.
80 60 40 20 0 -12
-10
-8 movement
-6
-4 -2 0 RSSI (dB) no movement
2
4
(e)
Figure 3. Absolute RSSI values: (a) experiment A, (b) experiment B, (c) experiment C, (d) experiment D and (e) experiment E.
Histograms of the absolute RSSI values are shown in figure 3 and the mean and standard deviation are shown in table 1. We observe that human movement has marginal impact on the mean RSSI measured at the receiver. However, an important observation in all the experiments that we 4
P W Q Lee et al
100
100
80
80
Frequency (%)
Frequency (%)
Meas. Sci. Technol. 21 (2010) 124007
60 40 20 0
60 40 20 0
-7 -6 -5 -4 -3 -2 -1 0 1 2 3 4 5 6 7
-7 -6 -5 -4 -3 -2 -1 0 1 2 3 4 5 6 7
RSSI Fluctuation (dB)
RSSI Fluctuation (dB)
(a)
(b)
100
100
80
80
Frequency (%)
Frequency (%)
Figure 4. Experiment A, large multi-purpose hall: (a) without movement and (b) with movement.
60 40 20 0
60 40 20 0
-7 -6 -5 -4 -3 -2 -1 0 1 2 3 4 5 6 7 RSSI Fluctuation (dB)
-7 -6 -5 -4 -3 -2 -1 0 1 2 3 4 5 6 7 RSSI Fluctuation (dB)
(a)
(b)
100
100
80
80
Frequency (%)
Frequency (%)
Figure 5. Experiment B, four-person dormitory room with furniture: (a) without movement and (b) with movement.
60 40 20 0
60 40 20 0
-7 -6 -5 -4 -3 -2 -1 0 1 2 3 4 5 6 7 RSSI Fluctuation (dB)
(a)
-7 -6 -5 -4 -3 -2 -1 0 1 2 3 4 5 6 7 RSSI Fluctuation (dB)
(b)
100
100
80
80
Frequency (%)
Frequency (%)
Figure 6. Experiment C, sports field: (a) without movement and (b) with movement.
60 40 20 0
60 40 20 0
-7 -6 -5 -4 -3 -2 -1 0 1 2 3 4 5 6 7 RSSI Fluctuation (dB)
(a)
-7 -6 -5 -4 -3 -2 -1 0 1 2 3 4 5 6 7 RSSI Fluctuation (dB)
(b)
Figure 7. Experiment D, one-person room: (a) without movement and (b) with movement.
are very stable. Hence, to exploit the observed RSSI spread caused by human movement, while reducing the impact of the environment, we consider the fluctuation in signal strength instead. For a given packet pi , we calculate the RSSI fluctuation as F (pi ) = S(pi ) − S(pi−1 ). For example, a series of RSSI values {1, 2, 4, 8, 8, 6, 7, 9, 8} would produce the corresponding stream of RSSI fluctuation values {0, +1, +2, +4, 0, −2, +1, +2, −1}. Histograms of the RSSI fluctuation with and without movement are shown in figures 4 to 8. Comparing with
can make is that human movement causes the histogram of the absolute RSSI values to become more spread; this is manifested quantitatively as a higher standard deviation, though for one particular scenario (B) the standard deviation is only slightly higher. However, the standard deviation varies significantly across environments, making it difficult to define a universal threshold to detect movement in terms of these first-order statistics. Nevertheless, by observing the time series of the RSSI values, we note that the RSSI values for successive packets 5
P W Q Lee et al
100
100
80
80
Frequency (%)
Frequency (%)
Meas. Sci. Technol. 21 (2010) 124007
60 40 20 0
60 40 20 0
-7 -6 -5 -4 -3 -2 -1 0 1 2 3 4 5 6 7
-7 -6 -5 -4 -3 -2 -1 0 1 2 3 4 5 6 7
RSSI Fluctuation (dB)
RSSI Fluctuation (dB)
(a)
(b)
Figure 8. Experiment E, garden: (a) without movement and (b) with movement.
Figure 9. Motion detection algorithm evaluation, N = 100, room 3.
figure 3, we observe that the spread of the histogram without movement is narrower, while that with movement is wider. In fact, the frequency of fluctuation values within [−1, 1] always exceeds 90% when there is no movement and always remains below 65% when there is movement.
Table 2. False positives detected by the motion detection algorithm. N
Room 1
Room 2
Room 3
60 80 100 120
3 3 2 2
0 0 0 0
3 4 3 2
4. Inferring human activity However, some false positives were detected in rooms 1 and 3, where the algorithm inferred motion for a period of 10 s or more when there is actually no motion. However, as shown in table 2, the occurrence of false positives may be reduced by appropriate tuning of N. Moreover, in intrusion detection, it is preferable to detect some false positives than to let intrusions go undetected.
From the results in section 3.2, we find that it is difficult to detect movement by defining a universal threshold for absolute RSSI values; the problem lies in different environments having different RF signal propagation characteristics. However the fluctuation in RSSI values provides a promising solution for solving this problem. Different RF signal propagation characteristics have an effect on the absolute RSSI values, causing them change significantly between environments, but the effect on the fluctuation between values is minimal; thus, it does not pose a problem in our proposed algorithm. We propose an algorithm for motion detection that counts the number of fluctuations falling in [−1, 1] over a window of N packets. The algorithm infers that there is motion if the percentage of such fluctuations falls below pthresh %. We evaluate the algorithm by running three more experiments, conducted in three different meeting rooms of sizes about 6 m × 4 m. The motes are placed at a height of 1.5 m and spaced 4 m apart, with an inter-packet arrival period of 0.25 s. Over a 20 min period, a human walks between the motes continuously for 30 s at the start of minutes 0, 2, 4, . . . , 18, for a total of 10 walks. We let N = 60, 80, 100, 120 and pthresh = 65%. A sample run for N = 100, room 3 is shown in figure 9, where the normal line represents motion as inferred by the algorithm and the dashed line (- -) represents the actual motion. We observe that all 10 walks were successfully detected within 15 s of the onset of each walk. In fact, this is observed in every trial.
5. Conclusion We have demonstrated the viability of using the radio irregularity of wireless transmission for motion detection. The absolute signal levels are non-deterministic and highly dependent on the surrounding environment. However, the degree of signal level fluctuations arising from interference by the human body moving in the vicinity of RF transmissions has been shown to be consistent and can be used as a means to detect human activity in the network. Using wireless sensor motes, we conducted experimental investigations and proposed a method to detect motion successfully, albeit, with some false positives. The method proposed here is only capable of simple motion detection and there are several limitations. As part of future work, we wish to recognize different types of objects (e.g. human bodies, inanimate objects), and also address the problem of false positives. This paper presents a novel approach to intrusion detection by transforming what is typically considered to be 6
Meas. Sci. Technol. 21 (2010) 124007
P W Q Lee et al
a transmission problem into an advantage for the purpose of motion and intrusion detection. Since radio power may be higher than the power required by a small motion detection device, this method is not meant for use as a stand-alone system, but rather as a convenient by-product of the existing wireless network infrastructure. This approach is dependent on the fidelity of the wireless transceivers and may not provide the necessary accuracy to perform the task of intrusion detection by itself. However, it can be adopted (at very little additional cost) as a preliminary detection system to trigger other systems such as video surveillance, or alert security personnel to focus on specific CCTV displays. This can provide substantial savings in energy costs and also improve the efficiency of human security operators whose alertness is reduced by observing multiple video surveillance displays over long durations.
[8] Suski W C, Temple M A, Mendenhall M J and Mills R F 2008 Using spectral fingerprints to improve wireless network Security Proc. IEEE Global Communications Conf. (GLOBECOM 2008) (New Orleans, LA, USA, Dec. 2008) [9] Randell C and Muller H H 2000 Context awareness by analysing accelerometer data Proc. 4th Int. Symp. on Wearable Computers ed B MacIntyre and B Iannucci (Los Alamitos: IEEE Computer Society) pp 175–76 [10] Woyach K, Puccinelli D and Haenggi M 2006 Sensorless sensing in wireless networks: implementation and measurements Proc. 2nd Int. Workshop on Wireless Network Measurement (WiNMee 2006) (Boston, MA, USA, April 2006) [11] Muthukrishnan K, Lijding M, Meratnia N and Havinga P 2007 Sensing motion using spectral and spatial analysis of WLAN RSSI Euro SSC 2007 (Lecture Notes in Computer Science vol 4793) ed G Kortuem et al (Berlin: Springer) [12] Anderson I and Muller H 2006 Context awareness via GSM signal strength fluctuation 4th Int. Conf. on Pervasive Computing, Late Breaking Results (Oesterreichische Computer Gesellschaft, May 2006) pp 27–31 [13] Sohn T et al 2006 Mobility detection using everyday GSM traces Proc. 8th Int. Conf. on Ubiquitous Computing (Irvine, CA, USA, Sept. 2006) pp 212–24 [14] Holland M M, Aures R G and Heinzelman W B 2006 Experimental investigation of radio performance in wireless sensor networks Proc. 2nd IEEE Workshop on Wireless Mesh Networks (WiMesh) pp 140–50 [15] See C H, Abd-Alhameed R A, Hu Y F and Horoshenkov K V 2008 Wireless sensor transmission range measurement within the ground level Proc. Loughborough Antennas and Propagation Conf. (LAPC) pp 225–8 [16] Sasloglou K, Darbari F, Glover I A, Andonovic I and Stewart R W 2008 Some preliminary short-range transmission loss measurements for wireless sensors deployed on indoor walls Proc. 11th IEEE Singapore Int. Conf. on Communication Systems (ICCS) pp 129–32
References [1] Zhou G, He T, Krishnamurthy S and Stankovic J A 2004 Impact of radio irregularity on wireless sensor networks Proc. of MobiSys (Boston, MA, USA, June 2004) [2] Shankar P M 2001 Introduction to Wireless Systems (New York: Wiley) [3] Gehman J B 1973 Object detection system using electromagnetic waves Patent 3731305 [4] Gehman J B 1974 Radio frequency intrusion detection system Patent 3794992 [5] Galvin A A 1975 Electromagnetic intrusion detection system Patent 3863240 [6] Terrell J D and Giorgis R O 1977 Electromagnetic intrusion sensor Patent 4054871 [7] Hall J, Barbeau M and Kranakis E 2004 Enhancing intrusion detection in wireless networks using radio frequency fingerprinting Proc. 3rd IASTED Int. Conf. on Communications, Internet and Information Technology (CIIT) pp 201–6
7