Proceedings of the International Multiconference on Computer Science and Information Technology, pp. 687 – 693
ISBN 978-83-60810-14-9 ISSN 1896-7094
Wireless Sensor and Actuator Networks: Characterization and Case Study for Confined Spaces Healthcare Applications Diego Martínez
Francisco Blanes, José Simo, Alfons Crespo
Universidad Autónoma de Occidente Km. 2, Cali - Jamundí, Colombia
[email protected]
Polytechnic University of Valence Camino de Vera S/N Valence, Spain { pblanes, jsimo, acrespo }@ disca.upv.es
Abstract—Nowadays developments in Wireless Sensor and Actuators Networks (WSAN) applications are determined by the fulfillment of constraints imposed by the application. For this reason, in this work a characterization of WSAN applications in health, environmental, agricultural and industrial sectors are presented. A case study for detecting heart arrhythmias in non-critical patients during rehabilitation sessions in confined spaces is presented, and finally an architecture for the network and nodes in these applications is proposed.
I. INTRODUCTION urrently, there is a great interest in developing applications for monitoring, diagnosis and control in the medical, environmental, agricultural and industrial sectors, to improve social and environmental conditions of society, and increasing quality and productivity in industrial processes. The development of Wireless Sensor and Actuators Networks (WSAN) applications will contribute significantly to solve these problems, and facilitate the creation of new applications. Some applications which can be developed using WSAN are: • Medical Sector: economic and portable systems, to monitoring, recording and analyzing physiological variables, from which it is possible to indicate the status of a patient and detect the presence or risk of developing a disease. As well, developing systems for the detection and analysis of trends in the daily behavior of patients, contributing to timely detect the presence of a health problem, and provid ing an economically viable solution to patient care in societies where the old population is great. • Environmental Sector: continuous systems monitoring of species in dangerous extinction, monitoring and detection of forest fire systems, etc. • Agricultural sector: detection systems, microclimates monitoring and pest control, to reduce the use of agrochemicals and make an optimal control of pests; optimal use of water in irrigation systems, etc. • Industry: economic systems and easy installation for monitoring, diagnosis and control of plants and industrial processes. Some of the currently technological challenges in WSAN development are [1], [2], [3], [4], [5]:
C
This work is partially supported by the CYTED D2ARS Project
687
•
It is necessary to develop detailed models of the system components (hardware and software tasks, task scheduler, medium access control and routing protocols), in languages that allow correct specifications and the subsequent analysis of information processing, reachability, security, and minimum response time application, enabling analysis of end to end deadline in real time applications. • Task scheduler and medium access control and routing protocols proposed in this area are mostly focused on the optimization of a single critical parameter of the application, which often affects considerably the performance of the others. Therefore it is necessary to create new cooperation forms between these levels of the application architecture, in order to take the most appropriate decisions for the system reconfiguration in relation to the application’s quality of service (QoS). Additionally, current proposals consider QoS parameters directly linked to conventional parameters of the operation and communication between computers but not to particular application requirements, so do not allow achieving optimal performance in applications. • It is necessary to develop analysis strategies for performance and stability of signal processing and control algorithms in this area, in order to guide the design towards a co-design methodology to develop the processing algorithm and the implementation of computer architecture, allowing to compensate the sampling period changes and jitter effects, and optimize other parameters such as power consumption. The previous paragraphs show how these developments are determined by the fulfillment of constraints imposed by the application, such as energy consumption, limited computing power, coverage of large areas and real time deadlines, etc. For these reasons, in this work a characterization of WSAN applications for health, environmental, agricultural and industrial sectors is presented; then a case for detecting heart arrhythmias in non-critical patients during rehabilitation sessions in confined spaces is presented, finally an architecture for the network and nodes in these applications is proposed. The article is organized as follows, section 2 shows a classification and characterization of applications in health, environmental, agricultural and industrial sectors, section 3 presents the case analyzed, in section 4 a proposal for the nodes architecture is presented, the network architecture and its simulation results are presented in section 5, finally in section 6 the conclusions and future work are presented.
688
PROCEEDINGS OF THE IMCSIT. VOLUME 3, 2008
II. CLASSIFICATION OF APPLICATIONS During the classification was detected that different application sectors share similar characteristics from a technological point of view, for this reason the classification and characterization was developed in five types of application rather by sectors [6], [7], [8], [9], [10], [11], [12], [13], [14]. • Type 1 applications are characterized by measuring sampling periods from one second to few hours, and no strict deadlines for the generation of the algorithms results. Additionally, these applications, developed in open spaces, must cover large areas and it is necessary to synchronize measurements in different nodes. Agricultural and environmental applications, designated to measure, record and to analyze environmental variables, primarily belong to this category. The energy sensors autonomy expects for each node varies from days to months; in some applications, in places without access to conventional energy sources, nodes are equipped with energy transducers like solar cells, which supply energy to the nodes batteries. • Type 2 applications are developed in confined spaces and have greater computing capacity demanding than applications type 1, although there is not strict response time, either. Because they are in confined spaces and nodes are fixed, there are no restrictions on energy consumption since they can use conventional energy sources; however, the use of wireless networks is justified since it facilitates the installation, adaptability and portability of implementation, in addition to the lower costs of implementation. Such applications are fined mainly in industrial and agricultural sectors. The sampling periods range from one millisecond, for implementation of diagnostic algorithms, until a second for monitoring and supervision tasks. The diagnostic algorithms do not require continuous operation; therefore the samples can be stored before being processed. • Type 3 applications. In this category, in addition to measuring and processing data requirements similar to those in applications type 2, grouped applications are required to process images and they are developed in open spaces, some of which are in the agricultural sector for the detection of pests, and environmental sector aimed at detecting fires. Some of the nodes are mobile and require few hours’ energy autonomy, and then restrictions in terms of power
consumption are large. At the same time it is also necessary for synchronization of the nodes. While, because of the algorithms used for image processing, the computing capacity, memory size and communication bandwidth requirements are greater than applications type 2. • Type 4 applications. These applications differ from applications type 3 because they are developed in confined spaces, then the network's coverage is not demanding; energy sensors autonomy expected are also higher, becoming close to one week. Grouped healthcare applications to the detection of diseases are in this category with body area networks (BAN). • Type 5 applications. In these applications a sample data should be sent every sampling period, and then sampling periods are limited by the minimum interframes time space of data communication protocols. For this category, a range of sampling periods between 50 milliseconds and a few seconds has been selected. In this category are the applications of industrial control process, which are developed in confined spaces, so the distance between nodes is not big, and there are not restrictions on energy consumption. The deadlines for generating actions are less than or equal to a sampling period, and it is necessary to guarantee end to end deadline. If these constraints are not fulfilled, the control system performance can be degraded significantly, even generating instability in the system, therefore, it is important to synchronize the activities of the nodes that are integrated in the control loop. In addition, to improve the control system performance, it is important to limit the variability in the task jitter. Table 1 summarizes the characteristics of the applications described. As a strategy to increase reliability in the presence of faults, and optimizing the applications QoS, this proposal also has considered the migration of components between the nodes, which will be reflected in the architecture of the network and nodes . III. ARRHYTHMIA DETECTION ALGORITHM Actually cardiovascular problems have the highest mortality rate from natural causes in the world. The great interest in developing devices for clinical detection and continuous monitoring of such diseases, is based on these activities are limited by the information type and the moment that it is caught, so transitional abnormalities can not be always monitored. However, many of the symptoms associated with cardiovascular diseases are related to transient episodes rather
TABLE 1 ANALYSIS OF REQUIREMENTS FOR EACH APPLICATION TYPE Application Type 1 Type 2 Type 3 Type 4 Type 5
Computing capacity Low performance Low performance High performance High performance Low performance
Memory size Low
Communication bandwidth < 256 kbps
Location Yes
Node Mobility No
Medium
< 256 kbps
Yes
No
High
1 Mbps
Yes
Yes
Medium
< 256 kbps
Yes
Yes
Low
< 256 kbps
No
No
Real-Time Only measurement Only measurement Only measurement Only measurement End to end and Minimum jitter variability
Network's coverage Open space 10 km Confine space 100 m Open space 10 km Confine space 1 km Confine space 100m
Energy autonomy Months
Synchronization
There isn’t restriction Hours
Yes
Days
Yes
There isn’t restriction
Yes
Yes
Yes
DIEGO MARTINEZ ET. AL.: WIRELESS SENSOR AND ACTUATOR NETWORKS
689
Figure 2 Nodes architecture
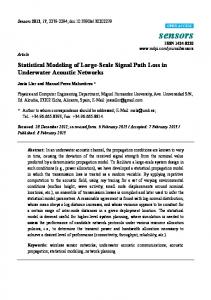
than continuing abnormalities, such as transient surges in blood pressure, arrhythmias, and so on. These abnormalities can not be predicted therefore a controlled supervision analysis is discarded. The reliable and timely detection of these episodes can improve the quality of life of patients and reduce the therapies cost. For this reason in this work a WSAN architecture to address such problems is proposed, this application belong s to type 4 described in paragraph 2. As an example, the detection of arrhythmias using data from electrocardiogram (ECG) measure, in patients who are moving during a rehabilitation activity in a confined space of 100m x 100m, as a rehabilitation center, was analyzed. The sampling period was selected from the ECG frequency spectrum, which, according to the American Heart Association, has 100Hz harmonics. The greatest amount of relevant information for monitoring and detection of arrhythmias is between 0.5Hz and 50Hz. When analyzing the ECG frequency spectrum can be established that the relevant components of the signal (QRS complex and waves P and T) are up to 35Hz. Applying the sampling theorem a minimum sampling period of 14ms approximately is necessary, but for practical purposes a period of 3ms was selected. For the detection and analysis of ECG the Pan and Tompkins algorithm was selected, [15]. The results of this algorithm are used by a maximums detection algorithm, which identifies the time when segments of the ECG wave were presented, figure 1. Subsequently the analysis of the separation time between two R waves, the duration of the QRS segment and the energy of the wave R is developed, which allows detecting the presence of arrhythmias [16].
Figure 1 Results of maximums detection algorithm
IV. ARCHITECTURE NODE The proposed generic architecture for the network nodes in applications type 4 is presented in figure 2. Its characteristics are: • The architecture enables the hardware and software components co-design. This feature will allow optimizing the development of distributed application components required for its implementation in hardware and software, getting a balance between cost, power consumption and processing time • There are fixed and mobile nodes. The latter are linked to the sub-network that guarantees them the best QoS ( QoS sn ) during its movement (less saturated sub-networks). • Communication between the nodes and local coordinators is done through wireless networks. • Use an EDF scheduler and dynamic scaling voltage and frequency techniques of the processor to optimize the power consumption [17]. This allows fulfilling the application deadlines, which is supported on statics utilization rate tables for each operating frequency, and periods of execution for each task. • Update its QoS indexes ( QoS n ); using these indexes and its neighboring ones it is possible to request to another node in its sub-network the migration, creation or destruction of components (some of which are clones of others). To select a set of architectures for an adequate performance of these applications, the performance of the arrhythmia detection algorithm, presented in section 3, was analyzed on four types of processors currently used to implement nodes in sensor networks: ARM7TDMI, MSP430, PIC18 and MC9S08GB60. For the analysis , the same operation velocity for each processor was used, 8MIPS. The time necessary to develop the Pan and Tompkins algorithm is presented in Table 2, which was estimated considering the sum of the values of individual functions (derivative, quadratic function and integrator window) in each architecture. The results show that the ARM architecture requires a lower percentage of utilization, while the PIC architecture needs the highest utilization percentage. It also was related consumed power by each architecture in active mode (PA) with the respective percentage of utilization
690
PROCEEDINGS OF THE IMCSIT. VOLUME 3, 2008
TABLE 2 COMPUTING TIME TO DEVELOP THE PAN AND TOMPKINS ALGORITHM Processor
Derivative
LPC2124 – ARM MSP430F1611 PIC18F458 MC9S08GB60
70.2 µs 191.9 µs 406.2 µs 497.2 µs
Quadratic function 142 µs 162.5 µs 209 µs 332 µs
Integrator window 280.5 µs 697.8 µs 1083.7 µs 707.35 µs
during the implementation of the algorithm, table 3. It can be seen as the ARM7 architecture has a closer performance to the architecture MC9S08GB60; then these two architectures are appropriate for the implementation of the case proposed. The MSP430 architecture presented the best indicator. TABLE 3 INDICATOR PA*U
LPC2124 – ARM MSP430F1611 PIC18F458 MC9S08GB60
Utilization percentage (U) 16.4% 35% 56.6% 51.3%
Active Power (P A ) [mW] 180 19.2 220 51.6
P A *U 29.52 6.72 124.52 26.47
V. NETWORK ARCHITECTURE FOR CONFINED SPACES HEALTHCARE APPLICATIONS In figure 3, a generic architecture for network applications type 4, which integrates different types of nodes, is proposed. The approach of a cooperation plan between architec-
Total computing time 492.7 µs 1052.2 µs 1698.9 µs 1536.55 µs
Period [µs] 3000 3000 3000 3000
Percentage of utilization (U) 16.4% 35% 56.6% 51.3%
ture levels of the application, in order to take the most appropriate decisions for the reconfiguration of the system in relation to the application QoS, can be appreciated. General goals of the architecture are: • Minimize latencies. • Optimize power consumption. The Main Coordinator is responsible for coordinating the complete application. It will have a fixed location, and communication with local coordinators will be supported through wireless or wired links. It develops the following functions: • Send sync hronization signals to the local coordinators of the sub-networks. Local Coordinator control s the activity inside the sub-network and develop s some information processing activities, whose architecture is presented in figure 4 and its features are: • It has a fixed location. • Sends synchronization signals to nodes in its sub-network.
Figure 3 Network architecture
DIEGO MARTINEZ ET. AL.: WIRELESS SENSOR AND ACTUATOR NETWORKS
691
Figure 4 Sub-network coordinator architecture
•
Develops routing packets between sub-networks using multihop techniques. • Distributes QoS indexes of nodes which belong to its sub-network ( QoS n ) . • Calculates its sub-network QoS index ( QoS sn = f(quantity of information to be transmitted)), and distributes this value and its neighboring sub-networks indexes (those reached in a single communication hop) between nodes in its sub-network. Depending on which: Accepts linking new nodes to sub-network. Updates best routes in the routing tables of data (which will be function of hops and the utilization percentage -information transmitting- of each router node). As a first approximation to the proposed architecture, we examined the performance of the case analyzed on the IEEE 802.15.4 protocol. Considerations for the proposed solution to the case are: • Transmission of the analysis results, from nodes located on each patient to a main node, every 3 s. The data frame consists of 2 Bytes, which contain patient codes and the type of arrhythmia detected. • After each sending the sender node waits for an acknowledgement (ACK) from next node in the routing path. If there isn’t an answer before 100ms the node sends again the information. If after 25 attempts there i s no answer this node change s to a mistake state. • The communication protocol selected is IEEE 802.15.4. The node distribution is shown in figure 5, which allows cover ing all possible locations of patients considering the specifications of the devices selected to implement the physical layer, CC2420, whose characteristics are: Coverage radio of 30m, and 100m without obstacles. Frequency range of 2.4 - 2.4835 GHz. Supports data transfer rates of 250 kbps.
In the case a network as presented in figure 6 was proposed. It consists of 3 fixed nodes which have no restrictions on power consumption, will receive reports from five patients and rout e the messages to the main node. The fixed devices have fixed identifiers 0, 1 and 2; the main node has the 0 identifier, and devices on every patient have identifiers from 3 to 7.
Figure 5 Distribution nodes for case and their coverage
The routing is developed through 1, 2 and 0 nodes, 0 is the network coordinator, each of these nodes form ing a sub-network together with patients, figure 6. The mobile nodes leave and enter the sub-networks continuously changing the configuration and network structures. The simulation was developed in the TOSSIM tool, and the TelosB platform was selected, including the CC2420 transceiver. Because the characteristics given of the case, with fixed nodes to implement the routing protocols, a routing fixed table algorithm was implemented, it is presented in table 4.
692
PROCEEDINGS OF THE IMCSIT. VOLUME 3, 2008
TABLE 5 TIME IN SENDING 2 BYTES FROM ALL PATIENTS TO THE MAIN NODE Sender node 6 4 7 2 5 2 3 1 1 5 3 2 7 2 0 1 4 3 7 2 2 1
Receiver node
Time (s)
2 2 2 6(ack) 2 Rtx 2 1 (moving frame from 6) 2 Rtx 2 2(ack) 0 (moving frame from 6) 2 Rtx 2 2 Rtx 2 1 (moving frame from 5) 2 Rtx 2 5(ack) 1(ack) 1 - 6 ends 2(ack) 2 Rtx 2 2 Rtx 2 2 Rtx 2 4(ack) 1 (moving frame from 4) 0 (moving frame from 5)
78.309 .320 .333 .344 .355 .380 .380 .397 .421 .421 .463 .486 .486 .488 .488 .500 .513 .524 .535 .547 .581 .589
Figure 6 Network structure for case
TABLE 4 ROUTING TABLE Source node 2 1 0
Destination node 1 0
In the simulation was considered the most critical case, wh ere all mobiles nodes are connected all time to the farthest sub-network from the main node. Times obtained in sending 2 Bytes from all patients to the main node (node 0), are presented in table 5. The data1 indicate that transmitting the message from a mobile node to the main node was over; the data2 indicate that the corresponding node has not received the ACK. Times obtained demonstrated that it is possible to fulfill the constraint of 3s, for the transmission of patient status from a mobile node to the main node, which was imposed by the case analyzed. VI. CONCLUSIONS AND FUTURE WORK From the study it can be concluded that developments on specific technologies and applications in this area are still
Source node 0 7 3 2 1 7 1 2 0 2 3 1 3 2 2 2 1 0 2 1 1 0
Receiver node
Time (s)
1(ack) 1 - 5 ends 2 Rtx 2 2 Rtx 2 1 Rtx moving 4 2 2 (ack) 2 Rtx 2 0 (moving frame from 4) 7 (ack) 1 (ack) 1 - 4 ends 1 (moving frame from 7) 2 Rtx 2 2 (ack) 2 Rtx 2 3 (ack) 2 1 (moving frame from 3) 1 Rtx moving 3 2 0 (moving frame from 7) 1 (ack) 1 - 7 ends 1 Rtx moving 3 2 2 (ack) 0 (moving frame from 3) 1 (ack) 1 - 3 ends
.613 .684 .684 .684 .701 .714 .740 .746 .764 .780 .780 .792 .807 .825 .860 .877 .877 .913 .929 .949 .979 79.013
emerging, and developing them will enable the growing of great social impact new applications. The proposed architecture considers the constraints of application field, allowing to find optimal solutions to the challenges in network and nodes designing, and will facilitate the development and validation of applications. It makes possible too the cooperation between levels of the network architecture to choose between different operations modes depending on QoS indexes. It is noted as the routing algorithm based on fixed tables supported by IEEE 802.15.4, fulfils the time requirements of these applications. Also as MSP430 architecture presents a good performance for the implementation of the case considered. The future work proposed is the performance analysis of different task schedulers and routing protocols on the presented architecture, and a cooperation strategy between them to minimize power consumption. R EFERENCES [1] Shivakumar SatrY, S. S. Iyengar. Real-Time Sensor-Actuator Networks. International Journal of Distributed Sensor Networks. January 2005, Pages: 17-34. [2] Baronti P., Pillai P., Chook V., Chessa S., Gotta A., Y. Fun Hu, “Wireless Sensor Networks: a survey on the State of the Art and the 802.15.4 and ZigBee Standards”, Computer Communications, Vol. 30, No. 7, May 2007, Pages: 1655-1695. [3] Ananthram Swami, Qing Zhao, Yao-Win Hong, Lang Tong. Wireless Sensor Networks. WILEY 2007. Pages: 251-343. [4] Marrón Pedro José, Minder Daniel, and the Embedded WiSeNts Consortium. Embedded WiSeNts Research Roadmap. November 2006. [5] Hill Jason Lester. System architecture for wireless sensor networks. Doctoral thesis. University of California, Berkeley. 2003. [6] David Culler, Deborah Estrind y Mani Srivastava. Overview of Sensor Networks. IEEE Computer, August, 2004. Pages: 41-49. [7] B. Son, Y. Her y J. Kim. A Design and Implementation of Forest-Fires Surveillance System based on Wireless Sensor Networks for South
DIEGO MARTINEZ ET. AL.: WIRELESS SENSOR AND ACTUATOR NETWORKS Korea Mountains. International Journal of Computer Science and Network Security. Vol. 6 No. 9B, September, 2006. [8] L. Yu, N. Wang, X. Meng. Real-time Forest Fire Detection with Wireless Sensor Networks. Proceedings of the International Conference on Wireless Communications, Networking and Mobile Computing, 23-26 September. 2005. [9] P. Klein Haneveld. “Evading Murphy: A sensor network deployment in precision agriculture”. Technical Report. June 28, 2007. [10] N. Wang, N. Zhang and M. Wang. “Wireless sensors in agriculture and food industry – Recent development and future perspective”. Computers and Electronics in Agriculture. Vol. 50, Nr. 1, January 2006, Pages: 1–14. [11] A. Baggio. “Wireless sensor networks in precision agriculture”. Workshop on Real-World Wireless Sensor Networks. REALWSN'05. Sweden , June 20-21, 2005. [12] Benny P L Lo and Guang-Zhong Yang. Key technical challenges and current implementations of body sensor networks. Department of Computing, Imperial College London, UK. http://www.doc.ic.ac.uk/ ~benlo/ubimon/BSN.pdf.
693
[13] J. Stankovic, Q. Cao, T. Doan, L. Fang, Z. He, R. Kiran, S. Lin, S. Son, R. Stoleru and A. Wood. Wireless Sensor Networks for In-Home Healthcare: Potential and Challenges. High Confidence Medical Device Software and Systems (HCMDSS) Workshop, Philadelphia, PA, June 2005. [14] Thomas Norgall, Fraunhofer IIS. “Body Area Network BAN - a Key Infrastructure Element for Patient-Centric Health Services”. ISO TC215/WG7/IEEE 1073 Meeting, Berlin. May 2005 [15] Pan Jiapu, Tompkins Willis J., A Real-Time QRS Detection Algorithm, IEEE Trans. Biomed. Eng., vol. BME-32, Pages: 230-236, 1985. [16] Tompkins W J; Webster J G. Desing of microcomputer-based medical instrumentation.New Jersey: Prentice-Hall, 1981. Pages: 396-397 [17] Padmanabhan Pillai, Kang G. Shin. “Real-Time Dynamic Voltage Scaling for Low-Power Embedded Operating Systems”. Proceedings of the eighteenth ACM symposium on Operating systems principles. Banff, Alberta, Canada, 2001. Pages: 89 – 102.