Oct 17, 1997 - Tuckman (1965), in his widely cited model of group development, ... forming, storming and norming stages of Tuckman's (1965) model of group.
WORK TEAM IMPLEMENTATION AND TRAJECTORIES OF MANUFACTURING QUALITY: A LONGITUDINAL FIELD STUDY
Rajiv D. Banker The University of Texas at Dallas Joy M. Field Boston College Kingshuk K. Sinha University of Minnesota
Last revised: October 17, 1997
1. Introduction Driven by the pressures to improve quality, manufacturing firms are forming work teams on production lines. Most empirical evidence relating work team formation to quality improvement is largely anecdotal. Our objective in this paper is to delineate the trajectories of manufacturing quality following the institution of work teams at an assembly plant and examine if work teams have a sustainable positive impact on manufacturing quality. The positive impact of quality circles, an organizational mechanism commonly used to facilitate worker participation in workplace decisions, on manufacturing performance has been found to be not sustainable (Griffin, 1988; Mohrman and Novelli, 1985; Lawler and Mohrman, 1987; Meyer and Stott, 1985). However, unlike quality circles, which exemplify “consultative participation,” work teams we study are an institutionalized form of “substantive participation” (Levine and Tyson, 1989, p. 189-190).1 Therefore, we expect that improvements in manufacturing quality associated with work team implementation are sustainable. Measuring quality improvement as defect rate reduction, we posit that the defect rate trajectory is monotonically non-increasing over time, reflecting sustainability of quality improvements. Empirical analysis of data from four production lines of an electromechanical assembly plant over a 28-month period suggest that quality improvements after the formation work teams are, in fact, sustainable over time. The specific shape of the trajectory of manufacturing quality reflects the characteristics of the team and the production line on which it is formed. The remainder of this paper is organized as follows. Section 2 discusses the theoretical underpinnings of this study. Section 3 describes the research setting, and section 4 the estimation 1
In quality circles, workers are allowed to give their opinions, but final decisions are still made by management. Participation of workers in quality circles is voluntary. The difference between consultative and substantive forms of participation is not in the content of the decisions, but in the degree of worker influence.
1
model and methods. Section 5 presents the results of our empirical analysis, and section 6 the concluding remarks.
2. Theoretical Background 2.1 Sustainability of quality improvements Griffin (1988) examines the changing impact of work teams on manufacturing quality at four points in time and finds that while quality circles initially improve (a perceptual measure of) manufacturing quality, the improvements are not sustainable, and performance eventually begins to erode. This supports conceptual work on quality circles that certain characteristics of quality circles cause them to self-destruct over time (Mohrman and Novelli, 1985; Lawler and Mohrman, 1987; Meyer and Stott, 1985; Sillince, Sykes and Singh, 1996). These characteristics include the organization of quality circles as parallel structures separate and distinct from day-to-day activities and the lack of decision-making authority by team members. Based on a review of empirical studies in economics, industrial relations, and organizational behavior on the effect of participation on performance, Levine and Tyson (1990) conclude that participation is more likely to have a positive impact on performance when it involves substantive rather than consultative arrangements. Substantive participation involves work teams making and implementing decisions while consultative participation is limited to idea generation. Both Levine and Tyson (1990) and Lawler and Mohrman (1987) consider the purely advisory role of quality circles to be detrimental to their long term sustainability. Another factor contributing to the frequent failure of quality circles as a sustainable form of group participation is that they are organized as a parallel structure or an auxiliary program, in the sense that they are separate and distinct from an organization's ongoing activities (Lawler and Mohrman, 1987). Rather, to be viable and effective over the long term, group participation
2
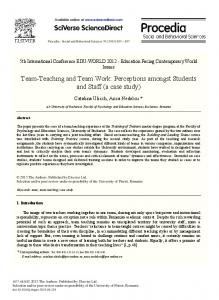
should be institutionalized and considered "a way of life" (Meyer and Stott, 1985; Lawler and Mohrman, 1987). Characteristics of work teams that promote institutionalization are mandated membership (Magjuka, 1989), decision-making authority, and management involvement and support (Lawler and Mohrman, 1987). 2.2 Trajectory of quality improvement Drawing from studies of group development, organizational learning, and technology implantation, we posit as benchmark an inverted S-curve trajectory following work team implementation.2 Observe from Figure 1 that in the initial portion of this trajectory, performance remains relatively flat. Performance improves sharply in the middle portion before flattening out in the final region, sustaining earlier performance gains.
Defect Rate [x(t)]
Figure 1: A Typical Trajectory of Defect Rate Reduction Following Work Team Implementation
Time [t]
Tuckman (1965), in his widely cited model of group development, suggests a developmental sequence consisting of four phases: forming, storming, norming, and performing.3
2
This follows from the conceptualization of a work team as a technology; see Ichniowski and Shaw (1995, p. 39). From a definitional standpoint, technology has two characteristics: (i) technology is manifested in artifacts (e.g. tools, machines, work procedures), and (ii) technology manipulates or transforms inputs to outputs (Burgelman and Rosenbloom, 1989; Van Wyk, 1988; Adler, 1989; Christensen, 1992). As an institutionalized from of substantive participation (i.e. artifact) that generates ideas and implements changes (i.e. transforms inputs into outputs), a work team fits the definition of a technology. 3 Forming involves an orientation to the group in which group members seek to define the boundaries of both interpersonal and task behavior. Storming is characterized by resistance to group influences and emotional responses
3
Performance improvements are realized mainly in the performing phase (Mohrman, Cohen, and Mohrman, 1995). In Leonard-Barton’s (1988) model of technology implementation, the introduction of a new technology (work team) causes misalignment between the technology (work team) and the user environment (including the team members themselves, as well as other participants in the pre-existing structure). The technology implementation process continues as the misalignment must be corrected by either altering the technology, or changing the environment, or both, before performance can improve.4 Garvin (1993), in his conceptualization of organizational learning, suggests that improvements in manufacturing performance (e.g. quality) occur through a three stage process. The first step is cognitive as members of the organization are exposed to new ideas, expand their knowledge, and begin to think differently. The second step is behavioral as employees internalize new insights and change their behavior. It is only in the third step that performance improvements (e.g. superior quality) result from the changes in behavior. All of these conceptual frameworks suggest that there is a delay between the beginning of the organizational learning process and the realization of performance improvements, consistent with the initial, relatively flat portion of the inverted S-curve. It is consistent also with models of to task issues. In the norming phase, group members overcome the resistance to group influences and develop a group, rather than individual, perspective. In the performing phase, interpersonal and group issues have been resolved, and the group's energy is primarily directed at addressing the task. 4
Does the analogy to technology implementation hold with other models of group development as well? One obvious competing model is that group decisions occur iteratively, not sequentially; see Weingart (1997, p. 203-205) for a review of such “flexible phase” models. For example, a group in a “norming” phase can regress to a “storming” phase and then re-enter the “norming” phase. It is possible to observe a similar phenomena in the context of the technology implementation process. A previously aligned technology and user environment can become misaligned, requiring efforts to realign them. Another proposed model of group development is “punctuated equilibrium” (Gersick, 1991). Punctuated equilibrium is a group life-cycle process that consists of periods of inertia intermixed with periods of rapid progress. The group’s progress is primarily a function of the group members’ awareness of impending deadlines. Although an initial period of inertia is consistent with the initial portion of the curve, the punctuated equilibrium model is more applicable to project oriented groups with specific deadlines rather than the ongoing work teams discussed here.
4
the organizational learning process (Reger, Gustafson, Demarie, and Mullane, 1994) in which the introduction of work teams is intended to overcome the cognitive inertia that is a barrier to performance improvement. A departure from the posited initial period of slow improvement is expected when there are problems in the initial stages of the implementation process. For example, studies by Hayes and Clark (1985) and Chew, Leonard-Barton and Bohn (1991) conclude that difficulties in the implementation stage can lead to short-term worsening of performance, before the performance eventually improves. A departure in the other direction occurs when the pre-existing relationships among group members are team-oriented, and performance improves sharply immediately as the forming, storming and norming stages of Tuckman’s (1965) model of group development do not occur. The high rate of quality improvement in the middle portion of the inverted S-curve is consistent with the performing phase of group development in Tuckman’s (1965) model. The technology implementation model also suggests that performance improves continually over time as improvements in the underlying technology accrue cumulatively to the product. In our analogy, “technology” is a work team and “improvements” are both the generation and implementation of ideas for operational enhancements. Work teams generate ideas, and it is the implementation of these ideas and the degree to which they relate to quality that contribute to cumulative improvements in product quality (Mohrman and Novelli, 1985). The rate of quality improvement, however, may be different in different contexts. Based on a survey of the learning curve literature, Yelle (1979) concludes that labor intensive operations have much steeper learning curve slopes than capital intensive operations (see also
5
Hirsch, 1956). Thus, the rate of defect rate reduction for labor intensive production lines is likely to be faster than for capital intensive production lines. The rate of technological improvement slows as ever greater efforts are required to realize additional improvements as the technology approaches a natural or physical limit (Christensen, 1992). Similarly, quality improvement plateaus in the final portion of the trajectory as work teams also reach a natural or physical limit in their ability to generate and implement high impact improvement ideas (Mohrman and Novelli, 1985). The “plateau effect” is often observed in the empirical estimation of learning curves. Consistent with the idea of a natural or physical limit, Muth (1986) explains it by modeling the manufacturing progress function as a random search within a fixed population of technological possibilities.5 It is conceivable, however, that the plateau in the final portion of the trajectory may not be observed if the number of possible improvement ideas and the ease with which the ideas can be identified and implemented continue to be high as in a continuous quality improvement context.
3. Research Setting The research setting for this study is a unionized plant operated by a division of a Fortune 500 firm. The plant has dedicated direct and indirect personnel, separate accountability, and separate record keeping. In September 1992, a separate work team was formed on each of the four production lines of the plant. Our study analyzes data over a 28-month period from September 1992 to December 1994, extending our earlier study that focused on the immediate impact of work team formation (Banker, Field, Schroeder and Sinha, 1996). 3.1 Production System
5
In an empirical study, Tyre and Orlikowski (1994) found that the rate of technological adaptations, while initially high, decreases quickly.
6
The family of products manufactured in this electro-mechanical plant consists of a series of small motors used in industrial and residential applications. The family of motors has been designed using a modular strategy for increased manufacturing flexibility. All motors are built with component parts that have the same size and shape, but alternative combinations of the component parts result in numerous models. Consistent with this strategy, the manufacturing process employs a high degree of flexible automation. While there are variations in the extent of automation across the four production lines, the type of automation is the same -- pick and place robots are interconnected by automated conveyor systems. A simultaneous engineering approach was implemented to coordinate product and process designs. The plant operates in a just-in-time (JIT) production environment, with minimal inventory in excess of what is required for current production. Commercial production of the family of motors began in September 1990. By the last quarter of 1991, production on all four lines of the plant was fully ramped up, with a full first shift and a partial second shift. Throughout the study period, the production of the family of motors continued at the fully ramped up levels. In terms of facility layout, the plant is organized into three sub-assembly lines and one final assembly line. The three subassembly lines correspond to the three basic components of the motors: submotor, gear train, and printed circuit board. Completed submotors feed into the gear train line, where they are incorporated into the gear train subassembly. The completed gear train subassemblies and printed circuit boards feed into the final assembly line, where they are incorporated into the end product. 3.2. Characteristics of Production Lines There are significant variations in the characteristics of each line, especially in terms of products, capital and labor intensity, and labor skills:
7
Submotor line has low product diversity as all submotors are identical except for the presence or absence of a mechanical spring-return device. The more complex process steps are done at the highly automated upstream end of the submotor line that operates with very little human intervention. However, several workers are needed to manually complete the product. The number of workers on the submotor line varied from 7 to 11 over the study period. Gear train line consists of two areas: machining and assembly. Some of the parts used in the gear train are machined on the line. Unlike elsewhere in the plant, workers in the machining area of the gear train line are trained machinists. The assembly area is highly automated, and there are very few production workers in this area. As a group, they have more seniority than workers on the other production lines. They tend to be a very cohesive group, and there is little turnover. The number of workers on the gear train line ranged from 4 to 6 over the study period. Printed circuit board line is the most capital intensive line in the plant. Ideally, once the assembly process begins, printed circuit boards are not touched by workers until they are completed. Workers on this line are primarily involved in inspecting the completed boards. The number of workers on the printed circuit board line ranged from 4 to 6 over the study period. Final assembly line is the most labor intensive line in the plant. Product diversity on this line is high, because the end product is assembled from various combinations of the more standard inputs from the three subassembly lines. Assembly of the printed circuit board to the gear train is handled by experienced workers because it is a delicate job. Several production workers are involved in final functional testing, a job that requires trouble-shooting skills. During the time we spent in the plant, we observed that the production engineer and production workers on this line, in particular, have an especially good working relationship, with the workers often stopping by the engineer’s office to discuss issues and the engineer doing the same with the
8
workers on the production line. The number of workers on the final assembly line varied from 14 to 18 over the study period. The specific types of manual jobs performed on the four lines include wiring, subassembly, circuit testing, insertion, drop-in, operational checks, component preparation, and functional testing. Even though these jobs require different skills, they can be learned quickly without any special training. Job rotation was not practiced either within or across the teams on the four production lines during the study period. 3.3 Work Force Characteristics and Policies All production workers in the plant are members of the union. They are paid on an hourly wage rate basis. Company policies guiding wage rates, and medical and retirement benefits did not change during the study period. The contractual agreement between the union and the division did not contain any clause on employment security for production workers. Most production workers are long-time employees with average tenure of 18 years, and average age of 42 years. Variations observed in the number of production workers on each production line are due to individuals being laid off, retiring or leaving for higher wage rate jobs elsewhere in the division, and the vacancies not being filled immediately. Our inquiries did not reveal any production worker leaving the plant due to the introduction of work teams. During the study period, vacancies on the production lines were filled with either workers from other plants of the division or from the pool of previously laid-off workers. 3.4 Evolution of Work Teams Our research site was the first plant in the division to be selected for work team implementation. The primary reason for this choice was the enthusiastic response of the plant manager. Other plant managers in the division had initially expressed concerns about the
9
feasibility and effectiveness of work teams in a unionized environment. In fact, the union supported the introduction of work teams as an effort to make the plant more competitive to remain viable in the long term, an issue of increasing importance. The initial months following the introduction of work teams focused on establishing trust between production workers and “management,” which included all non-union personnel. The facilitator believed that developing trust was important in overcoming the production workers’ resistance to work team formation. Given the numerous instances in the past of programs being introduced and then abandoned, production workers were skeptical of management's commitment to team implementation. Further, being unionized, the plant did not have a history of cooperation between workers and management. The facilitator played an important role in establishing trust between production workers and management by demonstrating that management was willing to implement their ideas. Another notable issue soon after the formation of work teams was conflict within the teams. The amount of conflict varied by team. The facilitator cited the submotor team, in particular, as one that had a high level of initial internal conflict, some of which persisted throughout the study period. On the other hand, continuing from the period before the team formation, relations among the gear train line team members were especially harmonious. The conflict levels on the printed circuit board and final assembly teams were between these two extremes, and the facilitator did not identify any major issues related to conflict resolution among these team members. After the initial months of trust-building and conflict resolution, the facilitator made a concerted effort to get the work teams focused on solving problems. For six months, January to
10
June 1993, all members of the four work teams went through a “10-module toolkit training”6 that was specifically aimed at facilitating their ability to work as a team. 3.5 Functioning of Work Teams Typically, work team meetings are held once a week. The meetings begin with a discussion, usually lead by either the plant manager or facilitator, that always covers quality, the past week's accomplishments, customer delivery, and variances from budgets. The meetings also serve as a forum to occasionally share information on topics such as the division’s budget and performance, including the plant's standing, competitors’ products, changes in the customer base, and problems with the products in the field. The bulk of the meeting is conducted by the team leader, chosen from among the production workers, and centers around the action log. The action log is a meeting log containing action items generated by the team listing the date the item was submitted, the problem and/or plan of action, the person(s) submitting the item, the person(s) responsible for addressing the item, the target date for resolution, the current status, and the date completed. The team members first discuss the current status of outstanding items and then any new items to add to the action log. At the time the item is submitted, the team leader assigns someone to be responsible for action on the item, and establishes a target date for completion. If the item is a problem, the action may involve gathering information on possible solutions. If the item is a plan of action, the action is implementing the item. Examination of the action logs of the work teams on the production lines suggested that around mid-1993, the orientation of the issues entered in the log book began to shift from 6
The topics of the 10-modules are: (i) vision of a competitive factory with a future, and values related to people, customer, quality, safety, and competitiveness, (ii) mutual goals, interdependent working relationships, and commitment to the group effort, (iii) organizing effective meetings, (iv) defining team goals and purpose, (v) understanding self and others, (vi) reviewing team processes, (vii) listening effectively, (viii) providing constructive
11
individual to group-level issues -- for example, (i) revising the parts ordering system, and (ii) increasing training on a specialized machine to reduce defects. While some of the issues were still assigned to the production engineer, others were increasingly being assigned to individual workers or the team as a whole. This was in contrast to the orientation of the actionable entries in the log book in the months immediately following the introduction of work teams, when they were mostly individual oriented issues, such as the need for new chairs and tools for a particular work station. Further, the responsibility for resolving these issues was usually given to a production engineer or the plant manager. Also, around mid-1993, the plant manager authorized the work teams to implement suggestions for improvement costing less than $200 -- an amount that covered a significant number of ideas for operational improvements. Expenditures above $200 continue to be handled by the plant’s usual operating procedures, such as the capital budgeting process, that can be initiated by the team.
4. Empirical Model and Methods To examine the trajectories of defect rate reductions associated with work team implementation, we employ a longitudinal research design. This design also enables us to assess whether defect rate reductions following the implementation of work teams are sustainable. Our inquiries and review of plant documents did not reveal any intervention besides the introduction of work teams in September 1992 that could potentially confound the impact of work teams on manufacturing quality. For example, no new product families or operational practices were introduced, nor were there any changes in process technologies or facility layout. Human resource management policies such as those related to compensation, recruitment and
feedback, (ix) benefits of having conflicts and techniques for conflict resolution, and (x) the process of problem solving.
12
selection, employment security, job assignment, skills training, and communication (Ichniowski, Shaw and Prennushi, 1997; MacDuffie, 1995) were the same across the four production lines and did not change during the study period. In addition, we control for other factors known to affect manufacturing quality to isolate the effect of work teams on manufacturing quality. While using an experimental design with a control group is desirable to establish causality, this is, by necessity, an observational study with no control group. Thus, we rely on the convergence of results of econometric analysis and the insights gained from qualitative data to support our conclusions (Mohrman and Novelli, 1985; Wagner, Rubin, and Callahan, 1988). 4.1 Measurement of variables The dependent variable is defect rate, which is measured as the number of defective units produced as a proportion of total units produced on the production line in a given period. The independent variable of interest is time following work team implementation. Since we posit an inverted S-curve trajectory for defect rate, we employ a sufficiently general estimation model to allow for this as well as other forms. Following Badiru (1992), we employ a polynomial form with linear, quadratic, and cubic transforms of the number of weeks following work team implementation.7 Following Hayes and Clark (1985) and Banker et al. (1996), we identified a number of control variables representative of factors other than work team implementation that have the potential to affect manufacturing quality. Included among such factors are four groups of managerial policies related to equipment, work-in-process (WIP) inventory, workforce, and 7
We did not restrict our analysis to models that assume an S-curve form a priori; see for example Mahajan et al. 4 (1990). Also, to check for more complex forms, we included a t term in the first iteration of our analysis, but it was not significant.
13
confusion in the plant. We do not include equipment policies since most of the plant’s stock of equipment and related maintenance and other policies, were in place at least five months before the beginning of the study period, and did not change appreciably during the period. In addition, we did not include work-in-process inventory in the analysis because the plant has had a just-intime (JIT) production environment since its inception and operates with minimal inventory. Our examination of the WIP data, available only at the plant level, indicated that the WIP level had been fairly constant throughout the study period. Defective units on all four lines were reworked and repaired on the same day they were detected.8 The variables related to workforce policies are operationally defined as follows. Overtime is measured as average overtime hours per worker for each production line in a given period. Absenteeism is measured as the number of workers absent as a percentage of total workers in the plant in a given period. Turnover is operationalized as two variables: (i) headcount addition is measured as the number of workers who joined as a percentage of total workers on a production line in a given period, and (ii) headcount deletion is measured as the number of workers who left as a percentage of total workers on a production line in a given period. The variables related to policies affecting plant confusion are operationally defined as follows. Product diversity is measured as a Herfindahl index (Gollop and Monahan, 1991) to reflect product heterogeneity on a production line in a given period. The Herfindahl index is of the form 1 −
∑ s2j
where s j is the share of the j th distinct product in the total production.
Product complexity is measured as the volume-weighted average of device complexity based on
8
The effect of WIP on quality is related to the coupling between WIP and cycle time (i.e. ceteris paribus, the lower the WIP, the faster the cycle time, and vice versa). During the study period the average cycle time was 45 minutes, a figure considered to be satisfactory by plant management. As a result, further reductions in WIP and cycle time were not considered by the management.
14
manufacturing difficulty (e.g. Cooper, Sinha, and Sullivan, 1992; Ittner, 1992) on each production line for a given period.9 The complexity index is of the form
cjxj
∑
xj
, where c j is the
complexity value for product j, and x j is the volume of the product j. For each production line, the product diversity and complexity measures are normalized by their average values. Fluctuations from planned production volume are operationalized using two variables: (i) upward fluctuations are measured as the percent deviation from the planned production rate for the plant in a given period, if positive, and zero otherwise, and (ii) downward fluctuations are measured as the percent deviation from the planned production rate for the plant in a given period, if negative, and zero otherwise. Engineering change orders is the number of such orders issued on a production line in a given period. Two more control variables are included in our analysis. Volume, measured as the number of units produced on each production line in a given period, is included to control for possible scale effects. Finally, our discussion with the plant manager indicated that engineers experimented with alternative adhesives on the gear train line during the months April to September, 1993. Such experimentation is considered to be outside the normal production process and is known to cause unusually high defect rates on the line. We use a dummy variable,
9
From the engineering department, we obtained ratings on the critical features of the products on the four production lines - namely, (i) control mechanism, (ii) mechanical characteristics, and (iii) electrical characteristics - in terms of their manufacturing difficulty. Each of these features was assigned a numerical value (the higher the number, the more complex it is). These features are coded in the model number assigned to the products. With information on the product model numbers and production volume for a given period, we calculated volume-weighted average complexity for the period.
15
experimentation, to indicate this period in the model specification. The variable assumes the value of 1 for the adhesive experiment period, and 0 for the remaining periods.10 4.2 Model Specifications To determine the nature of the effect of work teams on manufacturing quality over time, we develop a model consisting of a system of four equations, based on the product flows as described earlier in section 3 on the research setting. We formulate the model as follows: SDEFt =
α 0 + α 1SOT + α 2 ABSENTt + α 3 SADDS t + α 4 SDELS t + α 5 SDIVt + α 6 SCOMPt + α 7VOLUPt + α 8VOLDN t + α 9 SECOt + α 10 SVOLt + α 11TLIN t + α 12 TSQRt + α 13TCUBt + ε t
(1)
GDEFt =
β 0 + β 1GOTt + β 2 ABSENTt + β 3GADDS t + β 4 GDELS t + β 5GDIVt + β 6 GCOMPt + β 7VOLUPt + β 8VOLDN t + β 9 GECOt + β 10 GVOLt + β 11GTEXPt + β 12 TLIN t + β 13TSQRt + β 14 TCUBt + φ t
(2)
δ 0 + δ 1 BOTt + δ 2 ABSENTt + δ 3 BADDS t + δ 4 BDELS t + δ 5 BDIVt + δ 6 BCOMPt + δ 7VOLUPt + δ 8VOLDN t + δ 9 BECOt + δ 10 BVOLt + δ 11TLIN t + δ 12 TSQRt + δ 13TCUBt + ϕ t
(3)
γ 0 + γ 1 FOTt + γ 2 ABSENTt + γ 3 FADDS t + γ 4 FDELS t + γ 5 FDIVt + γ 6 FCOMPt + γ 7VOLUPt + γ 8VOLDN t + γ 9 FECOt + γ 10 FVOLt + γ 11TLIN t + γ 12 TSQRt + γ 13TCUBt + γ 14 SDEFt + γ 15GDEFt + γ 16 BDEFt + η t
(4)
BDEFt =
FDEFt =
where the variables in period t are defined as: SDEFt , GDEFt , BDEFt , FDEFt = SOTt , GOTt , BOTt , FOTt = ABSENTt =
manufacturing defect rate for submotor, gear train, printed circuit board, and final assembly lines, respectively; overtime for the submotor, gear train, printed circuit board, and final assembly lines, respectively; absenteeism rate;
10
We did not include a separate variable to capture the pre-existing learning curve effect because in Banker et al. (1996, p. 885, Table 3), we empirically tested for the existence of pre-team learning curve effect and found that the coefficient estimates for the preteam time trend on the four production lines were not statistically significant.
16
SADDS t , GADDS t , BADDS t , FADDS t = SDELS t , GDELS t , BDELS t , FDELS t = SDIVt , GDIVt , BDIVt , FDIVt = SCOMPt , GCOMPt , BCOMPt , FCOMPt = VOLUPt = VOLDN t = SECOt , GECOt , BECOt , FECOt = SVOLt , GVOLt , BVOLt , FVOLt = GTEXPt TLIN t = TSQRt = TCUBt = ε t ,φ t ,ϕ t ,η t =
addition of production workers for the submotor, gear train, printed circuit board, and final assembly lines, respectively; deletion of production workers for the submotor, gear train, printed circuit board, and final assembly lines, respectively; product diversity for the submotor, gear train, printed circuit board, and final assembly lines, respectively; product complexity for the submotor, gear train, printed circuit board, and final assembly lines, respectively; upward fluctuations from planned production volume; downward fluctuations from planned production volume; engineering change orders for the submotor, gear train, printed circuit board, and final assembly lines, respectively; production volume for the submotor, gear train, printed circuit board, and final assembly lines, respectively; adhesive experiment period on the gear train line; work team implementation linear term; work team implementation quadratic term; work team implementation cubic term; random residual terms.
4.3 Data Collection The quantitative data for the study period, from September 1992 to December 1994, were collected from the plant’s production, quality, personnel, and accounting records. Data on all variables except overtime were available on a weekly basis. Overtime hours were determined from accounting reports which were available only on a monthly basis. Data on all the variables except absenteeism and fluctuations from planned production rates were available by production line. While the impact of deviations from planned production rate is at the plant level, the effect at the individual production line is similar because production volume is coordinated among the lines. We also collected qualitative information. We conducted taped interviews with the plant manager, production engineer, team facilitator, production workers and supervisors, labor
17
relations manager, divisional management team, and the division manager most closely associated with the plant. We took notes over a period of three years from informal discussions with several individuals associated with this plant. We collected copies of weekly action logs for each team over the study period, a description of the facility layout, flow, and functions, repair manuals and an explanation of the defect codes, interoffice correspondence, business plan, and budget information. 4.4 Conditions for an Inverted S-curve Trajectory We consider properties of the defect rate trajectory x(t), where x = defect rate and t = number of weeks since work team implementation. A monotonically non-increasing defect rate over time implies dx/dt is negative over the entire implementation period; see equation (5). More specifically, dx/dt slowly becomes more negative during the initial implementation period, continuing more steeply as the work teams move beyond the initial implementation period. As the work teams’ ability to generate and implement high impact improvement ideas decreases, dx/dt reaches a minimum at the inflection point, tinf , after which it continues to become less negative. The well behaved curve described above requires d 2 x / dt 2 non-positive for t< tinf , 0 for t= tinf , and non-negative for t> tinf as shown in equation (6). Consequently, d 3x / dt 3 is nonnegative for all t as in equation (7). In summary, the mathematical properties of the defect rate trajectory x(t), are as follows: dx / dt ≤ 0
∀t
d 2 x / dt 2 ≤ 0
for t < t inf
d x / dt = 0
for t = t inf
d x / dt ≥ 0
for t > t inf
2 2
2 2
(5) (6)
18
d 3 x / dt 3 ≥ 0
∀t
(7)
where x = defect rate; t = number of weeks since team implementation, t = 1, 2, ..., T; tinf = inflection point where d 2 x / dt 2 = 0 The estimation of polynomial models, such as (1) to (4), often results in collinearity problems among the variables. To alleviate this concern we center the variables involving t by subtracting off the mean value of t, t . Thus, we model the longitudinal effect of work team implementation on defect rates as: x ( t ) = α + β (t − t ) + γ (t − t ) 2 + ω ( t − t ) 3
(8)
The first through third derivatives are: dx / dt = β + 2γ (t − t ) + 3ω (t − t ) 2
(9)
d x / dt = 2γ + 6ω (t − t )
(10)
d x / dt = 6ω
(11)
2
2
3
3
Based on the specification of the model (8), Table 1 summarizes the necessary conditions 1 to 5 associated with the inverted S-curve. Taken together, the conditions 1 to 5 are jointly sufficient for this trajectory. Table 1: Conditions for the Inverted S-shaped Trajectory of Defect Rate Reduction Necessary condition 1. ω ≥ 0 2. 2γ + 6ω (t − t ) t ≤ 0
Required for equation: (7) (6)
min
3. 2γ + 6ω (t − t ) t 4.
5.
max
β + 2γ (t − t ) + 3ω (t − t ) 2
(6) (5)
≤0 t min
β + 2γ (t − t ) + 3ω (t − t )
≥0
(5)
≤0
2 t max
19
4.5 Model Estimation and Diagnostics Equations (1) to (4) form a system of four equations with endogenous variables from the first three equations as independent variables in the fourth equation. In general, this structure requires estimation using three stage least squares (3SLS) - with autocorrelation, if necessary (Fair, 1970). However, the estimation procedure can be simplified if we determine that the equations lack contemporaneous correlation (Lahiri and Schmidt, 1978). We first checked the time series data for autocorrelation and found evidence of first-order autocorrelation in all four equations. Further, using the Lagrange multiplier statistic (Breusch and Pagan, 1980), we determined that contemporaneous correlation is not significant. Thus, the model need not be estimated using 3SLS. Since first-order autocorrelation is present, and ρ is unknown, we estimate the model using full feasible generalized least squares (FGLS) with the Prais-Winston estimator. The presence of heteroscedasticity can result in inefficient estimates of the parameters and biased and inconsistent estimates of their standard errors. For all the models, we plotted the residuals from FGLS regressions and found visual evidence of heteroscedasticity. White’s general test (White, 1980) confirmed the presence of heteroscedasticity. We used an autocorrelated Box-Cox analysis (Neter, Wasserman, and Kutner, 1990) to determine if a transformation on the dependent variable will correct these problems. In all equations, the natural logarithm transformation was optimal or near-optimal. After transforming the dependent variables, White’s (1980) test revealed no significant heteroscedasticity. This transformation also corrected problems with nonlinearity of residuals. We addressed a potential problem with collinearity among the linear, squared and cubic terms involving weeks since work team implementation by centering these time-dependent
20
variables. After estimating the model, we examined the variance inflation factors (VIFs) (Neter, et al., 1990) and Belsley, Kuh, and Welsch (BKW) collinearity diagnostics (Belsley, Kuh, and Welsch, 1980) to check for any remaining collinearity problems. Even after centering the timedependent variables, the diagnostics suggested potential collinearity problems between the linear and cubic terms for the printed circuit board and final assembly lines. Removing the cubic terms and re-estimating these two models resulted in changes in the magnitude of the estimated coefficient for the linear terms in both the printed circuit line and final assembly regressions. Thus, we must exercise caution in interpreting the individual coefficients. Standard tests for significance of estimates and the resulting inferences are based on the assumption of normality of residuals. Using the Shapiro-Wilk test (Shapiro and Wilk, 1965), we cannot reject the null hypothesis of normality at the 5% significance level for any of the regressions. Finally, we use influence diagnostics (Belsley, et al., 1980) to identify outliers for further consideration. Observations corresponding to suspected outliers in the residuals were identified in several of the equations, ranging up to 3% of total observations. These outliers were deleted, and the regression equations were re-estimated. In the submotor, gear train, and printed circuit board line equations, the conclusions were essentially the same as the results using the full data set. For these equations, we report the results based on the full data set. However, in the final assembly line equation, the observation corresponding to the first week after team implementation is a suspected outlier; deleting this observation changes the results somewhat. Also, since FGLS omitting the first observation is an alternative to full FGLS using the PraisWinston estimator (Greene, 1993), we estimate this equation without the first observation.
5. Results
21
Table 2 summarizes the equation-by-equation FGLS (feasible generalized least squares) regression results for the system of equations (1) to (4) corresponding to the four production lines/teams. For the gear train, printed circuit board, and final assembly line equations, none of the conditions in Table 1 were rejected. However, for the submotor line equation, condition 4 in Table 1 was rejected at the 5% significance level (p=0.0389). Rejecting condition 4, while failing to reject the other four conditions, indicates that the defect rate initially worsened before improving. In Table 2, three of the estimated coefficients of variables other than the work team implementation variables are significant. The coefficient estimates for product diversity on the submotor line and overtime on the gear train line are positive, suggesting that greater product diversity and higher levels of overtime are related to higher defect rates. Also, the coefficient estimate for the dummy variable for the period during which experiments were conducted with Table 2: Equation-by-Equation FGLS Regression Results (Dependent Variable: Log Manufacturing Defect Rate) (standard errors in parentheses) Variables Intercept Overtime Absenteeism Headcount addition Headcount deletion Product diversity Product complexity Upward fluctuations from planned production volume Downward fluctuations from planned volume
Submotor line -4.253** (0.640) -0.0516 (0.0481) 1.114 (1.225) 0.297 (1.566) 2.167 (1.542) 3.983** (1.204) -1.659 (1.187) -2.050 (1.107) -0.619 (0.456)
Gear train line -3.479* (1.353) 0.117* (0.0463) 1.511 (1.209) 0.603 (2.014) 0.434 (1.913) 1.483 (3.980) -2.044 (4.930) 0.915 (1.162) 0.298 (0.515)
22
Printed circuit board line -0.110* (0.247) -0.0535 (0.0391) -0.171 (0.745) -0.619 (1.727) 0.308 (1.418) -0.00588 (0.163) -1.545 (0.557) -0.750 (0.662) -0.365 (0.277)
Final assembly line -4.695** (1.262) 0.0549 (0.0305) -1.132 (0.979) 0.699 (1.291) 0.615 (1.715) 0.0137 (0.212) 2.627 (1.458) -0.659 (0.814) -0.0486 (0.356)
Engineering change orders
Work team implementation linear term
-0.0252** (0.00405)
-0.225 (0.220) -0.0000607 (0.0000548) 0.872** (0.168) -0.0142** (0.00452)
Work team implementation quadratic term Work team implementation cubic term
-0.000121* (0.0000574) 0.00000466** (0.00000176)
-0.0000523 (0.0000588) 0.00000142 (0.00000184)
Volume
0.260 (0.369) -0.0000952 (0.0000605)
Experimentation
-0.0362 (0.116) -0.0000420 (0.0000194)
-0.00556 (0.0620) -0.0000587 (0.0000613)
0.00863 a (0.00501) 0.000343 (0.0000615)
-0.000229 a (0.00182) 0.0000588 (0.0000394)
-0.00000359 a (0.00000195)
-0.00000201 a (0.00000129) -0.00743 (0.0625) 0.00972 (0.0569) 0.160 (0.0965) 0.2804 0.1552 2.240** 109
Log of defect rate - submotor line Log of defect rate - gear train line Log of defect rate - board line
0.6033 0.6307 0.1809 R2 2 0.5506 0.5855 0.0733 Adjusted R 11.463** 13.946** 1.682 F for R 2 N 112 111 113 *p