al of Com urn p Jo
s Biolog tem y ys
Science & er S ut
ISSN: 0974-7230
Computer Science
Systems Biology
Research Article Research Article
Jilcha et al., J Comput Sci Syst Biol 2015, 8:4 http://dx.doi.org/10.4172/jcsb.1000187
Open OpenAccess Access
Workers and Machine Performance Modeling in Manufacturing System Using Arena Simulation Kassu Jilcha*, Esheitie Berhan and Hannan Sherif Addis Ababa University, Addis Ababa Institute of Technology, Addis Ababa, Ethiopia
Abstract This paper deals with the workers and machine performance measurements in manufacturing system. In simulating the manufacturing system, discrete event simulation involves the modeling of the system as it improves throughput time and is particularly useful for modeling queuing systems. In modeling this system, an ARENA simulation model was developed, verified, and validated to determine the daily production and potential problem areas for the various request levels in the case company (Ethiopia Plastic Factory). The results obtained show that throughput time in the existing system is low because of occurrence of bottlenecks, and waiting time identified. Therefore, some basic proposals have been drawn from the result to raise awareness of the importance of considering human and machine performance variation in such simulation models. It presents some conceptual ideas for developing a worker manager for representing worker and machine performance in manufacturing systems simulation models. The company workers’ and machine performance level is raised by identifying the bottle neck area. They were recommended to amend the main basic bottle necks identified.
Keywords: PVC pipe product; Arena simulation; Waiting time; Throughputs; Capacity utilization
Introduction Industry Performance improvements arising from increased manufacturing integration continues to be one of the primary competitive issues in current days. Faced with ever-increasing challenges such as the globalization, increased world competition, and increased customer expectations, companies are pursuing strategies to improve their performance and reduce their costs. Discrete-event modeling and simulation (DES) is a popular tool in widely varying fields for identifying and answering questions about the effects of changes on processes. Recent research into manufacturing systems integration has identified the need for effective positioning of business objectives down through the organization and the subsequent measurement of performance in critical areas as key elements of sustainable competitive advantage [1-7]. One of the best tools that can indicate the performance of any company is simulation software. The simulation software can be divided in to bigger group Simulation Language and Simulators. The simulation language is programming based using simulation software. The simulator allows one to build a model of the desired system by using before- made modeling constructs [8]. In Simulation, language software the model is developed creating a program syntactically or graphically using language’s modeling constructs. These types of simulation software are very flexible tools but the user needs to know programming concepts and longer modeling times [8,9]. Thus, simulation can be either discrete event or continuous simulation. In continuous model, the state of the system can change continuously over time. In discrete model, though changes can occur only at separated points in time [10]. During the past decade, the manufacturing industry has undergone a dynamic transformation. Recently, traditional manufacturers are inherently subject to high-mix, low volume manufacturing as a business model [11]. In this paper, discrete event simulation is used to model workers and machine performance in Ethiopia Plastics Industry. Highly industries rely on workers and machine performance since productivity depends on workers and machine availability. A company will not be able to participate and will not survive in a long-term perspective if employees do not attribute a high significance to such J Comput Sci Syst Biol ISSN: 0974-7230 JCSB, an open access journal
organization goals. However, poor workers and machine and machine performance can be recognized some of the factors are of high load of work, financial stress, and illness. Therefore, workers and machine performance, as this function is essential required for huge value to the organization in maintaining and strengthening its business and revenue growth [12-16]. Multi-skilling of workers can be achieved by cross-training. Crosstraining is a process in which workers are trained on the tasks, duties, and responsibilities of multiple tasks in a specific work cell or work area [14]. Worker assignment and involvement within a labor-intensive cell is a major role in the performance of the cell [17]. The first model assigns multi-skilled workers to existing cells while the second model finds the optimal operator assignment within a cell [15]. The performance of the workers can be determined from the arena simulation tools to take an action in line with the other techniques and tools presented in the previous researches. The problem observed in this case company is the lack of experts and variation on processing the PVC pipe in adjusting the heat treatment and low capacity utilization of the workshop which causes variation to the specified product. During this, the number of recycled products is higher per days. The industry can fail to achieve the goal for efficient and economical production. Capacity includes all resources such as machineries, workers etc. of the factory. Therefore, the objective of this paper is to provide industry with a complete set of tools, techniques and procedures to allow examining of existing workers and machine performance systems. These techniques
*Corresponding author: Kassu Jilcha, Addis Ababa University, Addis Ababa Institute of Technology, Addis Ababa, Ethiopia, Tel: +251 913 01774; E-mail:
[email protected] Received May 05, 2015; Accepted May 18, 2015; Published May 20, 2015 Citation: Jilcha K, Berhan E, Sherif H (2015) Workers and Machine Performance Modeling in Manufacturing System Using Arena Simulation. J Comput Sci Syst Biol 8: 185-190. doi:10.4172/jcsb.1000187 Copyright: © 2015 Jilcha K, et al. This is an open-access article distributed under the terms of the Creative Commons Attribution License, which permits unrestricted use, distribution, and reproduction in any medium, provided the original author and source are credited.
Volume 8(4) 185-190 (2015) - 185
Citation: Jilcha K, Berhan E, Sherif H (2015) Workers and Machine Performance Modeling in Manufacturing System Using Arena Simulation. J Comput Sci Syst Biol 8: 185-190. doi:10.4172/jcsb.1000187
helps in applying simulation system model which could be used as before an existing system is altered or a new system built, to reduce the chances of failure to meet specifications, to eliminate unforeseen bottlenecks, to prevent under or over-utilization of resources, and to optimize system performance.
Material and Methods The study was conducted by considering different materials and methods to achieve the goal of this study. The literature reviews and arena software applications were utilized to come up with good solution. Simulation, in particular discrete event simulation, has still not gain industries wide acceptance as decision support tool for performance evaluation. The researchers have provided the example of the application of discrete event simulation in evaluating performance of a production line in the case company. The data was collected from an Ethiopian Plastic industry production line and the simulation model is built using arena software simulation. A simulation model provides a visual animation of the line to see how product will flow through the line. An ARENA® simulation model was developed, verified, and validated to determine the daily production and potential problem areas for the various production levels in the plastic industry.
Receiving production orders
Melted plastic
Raw material Requisition
Discussion and Results Production process flow In general, there are 5 main workshops in Ethiopia plastic industry. Raw materials in the form of garden hose and master batch are supplied by foreign countries like Asia and in domestic like Elsewady Cables Ethiopia and directed to raw material store for storing and quality checking. They will be sent to two operating process continuous and injection section and turn on heat treatment and take the melted plastic with screw thread then forced into mold. The bundle will be prepared by hauloof. After the product is finished it will be inspected and then packaging will be done. Finally; the product will be kept in finishing storage as shown in Figure 1. The other process is continues (extrusion) process flow which begins at raw material receiving, and balling unit machine as indicated by Figure 2.
Data analysis The collected data through the means of interviews, direct observation and company document review were analyzed. Fitting Input Distribution through the input analyzer is used to identify fitted statistical distribution [18]. It is used to evaluate the distribution’s
Machine setup parameters
Properly mounting mold
Turn on motor granule plastic melted and move screw thread
Full hopper with raw material
Turn on heater
Reject
Open molted and product take off
Quarterly checked
yes
Finished product
Packing, labeling, stamping
Shipping
No Take corrective action Recycle Figure 1: Injection process flow.
Raw material (garden hose & master batch receiving from store)
Mini store
Numbering stamp machine tank
Cooling tank
Take off
Filter and stablizer
Mixer
Vacuum tank
Extruder machine
Spine conveyor Hopper
Balling unit machine Figure 2: Continuous (extrusion) process flow diagram.
J Comput Sci Syst Biol ISSN: 0974-7230 JCSB, an open access journal
Volume 8(4) 185-190 (2015) - 186
Citation: Jilcha K, Berhan E, Sherif H (2015) Workers and Machine Performance Modeling in Manufacturing System Using Arena Simulation. J Comput Sci Syst Biol 8: 185-190. doi:10.4172/jcsb.1000187
parameter and calculates a number of measures of the data. To select which type of distribution to use, the authors have compared the square error of each distribution. The larger the square error value, the further away the fitted distribution is from the actual data. The data was analyzed by using real recorded time from the operation areas of the selected product in the case company section. These data supported the analysis of validation, verification and number of replication estimation as discussed in the next sections [7].
Model assumption
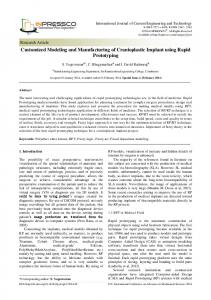
Figure 3: Input analyzer distribution histogram.
In Ethiopia Plastics Industry, there are three shifts per day. Workers distribution through the specified time per shifts can be delayed by different kind of incidents. The actual working time for whole system is 8:00 working hours per day. Since it is not expected that a person will work without some interruptions, the operators may take time for their personal needs. Assumptions are taken for modeling the variation of workers performance at time to rest, machine failure, and power off. The model for one shifts are modeled and analyzed. In the study only polyvinyl chloride (PVC) pipe line is selected. Raw material is assumed as a constant input, no interruption of operation is occurred in continuous and random for injection. The manufacturer working time is 8:00 working hours per day. Distribution is fitted to input analyzer; it evaluates the distribution’s parameter and calculates a number of measures of the data. In order to select which type of distribution is used, the author has compared the square error of each distribution. The larger the square error value, the further away the fitted distribution is from the actual data (19). Therefore the following fit all summary orders in worker performance distribution from smallest to largest square error. From the table it can be seen that triangular is the one with smallest square error and thus it is selected. Line indicates that the data normal distribution and the blocks are the actual data’s situation histogram expression when compared to the normal distribution. The normal distribution is skewed to the right (Tables 1-3, Figure 3 [18,19]). s/n
Process
Distribution
Square error
1
Raw material requisition
3.5+3 × BETA (0.3847, 0.648)
0.023693
2
Machine set up
4.5+3 × BETA (0.896, 0.979)
0.004202
3
Hopper
3.5+3 × BETA (1.05, 0.7336)
0.012719
4
Turn on heater
5.5+3 × BETA (11.76, 2.47)
0.000290
5
Turn on motor granular plastic melted move to screw thread
22.5+3 × BETA (11.16, 1.52)
0.001000
6
Melted plastic forced into mold
5.5+GAMM (0.663, 22.87)
0.011748
7
Takeoff
4.5+5 × BETA (0.928, 11.35)
0.019469
8
Package
6.5+4 × BETA (0.996, 1.44)
0.002769
Table 1: PVC pipe process time distribution in injection. S/n
Continuous (extrusion)
Distribution
Square
1
Workers distribution
TRIA (5.5, 6.8, 7.5)
0.00473
Table 2: Workers distribution in continuous (extrusion). S/n
Process
Distribution
Square error
1
Mixer
9.5+11 × BETA (0.789, 0.848)
0.000365
2
Hopper
4.5+6 × BETA (1.37, 0.815)
0.000534
3
Extruder
1.5+2 × BETA (1.33, 1.42)
0.000121
4
Vacuum
4.5+WEIB (0.873, 1.9)
0.003243
5
Cooling
3.5+4 × BETA (1.52, 0.678)
0.001297
6
Number of stamps
TRIA (1.5, 3.2, 4.5)
0.00112
7
Takeoff
2.5+4 × BETA (0.934, 0.903)
0.0001232
Balling
9.5+6 × BETA (0.935, 0.836)
0.001245
8
Table 3: PVC pipe process time distribution in continuous (extrusion).
J Comput Sci Syst Biol ISSN: 0974-7230 JCSB, an open access journal
Model formulation In modeling design the type of analysis is performed on workers and machine performance. The products that are selected are the one those most often produced. They are considered as one of the main products of Ethiopia Plastic Industry in this case company. The working period in Ethiopia Plastic Industry is five days and a half day within eight working hour consideration. This means the working days from Monday to Friday 8:00 working hours and on Saturday 4:00 working hours are utilized in the company. The three models for the arena simulations are workers distribution models, continuous extrusion models, and injection models as shown in Figures 4-6.
Model verification Verification assesses the correctness of the formal representation of the intended model, by inspecting computer code and test runs, and performing consistency checks on their statistics [20]. More specifically, verification consists in the main of the following activities: Inspecting simulation program logic. ✓✓ Performing simulation test runs and inspecting sample path trajectories. In particular, in a visual simulation environment (like Arena), the analyst inspects both code printouts as well as graphics to verify (as best one can) that the underlying program logic is correct. ✓✓ Performing simple consistency checks, including sanity checks as well as more sophisticated checks of theoretical relations hips among predicted statistics. ✓✓ In simulation modeling, each part of model run with different set of inputs and the obtained outputs were compared by using throughputs and little’s formula with real outputs.
Model validation Validation activities are critical to the construction of credible models. The standard approach to model validation is to collect data (parameter values, performance metrics, etc.) from the system under study, and compare them to their model counter parts. These parameters will prove the validity of the data and simulation.
Number of replication estimation A good design of simulation replications allows the analyst to obtain the most statistical information from simulation runs for the least computational cost. In particular, minimizing the number of replications and their length is necessary to obtain reliable statistics. In order to decide the number of replication the model must run some initial set of replication so that sample average, standard deviation and confidence interval are computed. This initial set of replication is shown in Table 4.
Volume 8(4) 185-190 (2015) - 187
Citation: Jilcha K, Berhan E, Sherif H (2015) Workers and Machine Performance Modeling in Manufacturing System Using Arena Simulation. J Comput Sci Syst Biol 8: 185-190. doi:10.4172/jcsb.1000187
Figure 4: Workers distribution model.
Figure 5: Continuous extrusion model.
Figure 6: Injection model.
J Comput Sci Syst Biol ISSN: 0974-7230 JCSB, an open access journal
Volume 8(4) 185-190 (2015) - 188
Citation: Jilcha K, Berhan E, Sherif H (2015) Workers and Machine Performance Modeling in Manufacturing System Using Arena Simulation. J Comput Sci Syst Biol 8: 185-190. doi:10.4172/jcsb.1000187
Workshop
Replication
Number out (hr)
Total time (hr)
WIP per (hr)
1
1.903
0.4014
0.7691
2
1.909
0.4484
0.8588
3
1.904
0.4697
0.8977
4
1898
0.4014
0.6691
5
1899
0.7484
0.8588
6
1.904
0.5497
0.9977
Mean
1,902.83
Continues (extrusion )
Half width
21.40
Standard deviation
3.970
1
2.424
9.5589
26.134
2
2.453
7.3193
19.4321
3
2.447
8.2891
23.0371
4
2.460
6.5589
22.897
5
2.452
7.2165
15.465
6
2.448
8.4356
25.786
Mean
2,447.33
Injection mold
Half width
34.84
Standard deviation
12.323
1
150
2.9167
0.4404
2
151
2.9167
0.4413
3
151
2.196
0.4420
4
151
2.134
0.4303
5
151.40
2.5674
0.4405
6
151.33
2.214
0.412
Mean
150.95
Workers shift time
Half width
1.08
Standard deviation
0.5013 Table 4: Number of replication.
For PVC pipe continuous extrusion production line initial replication (no) is 6 and the initial half width (ho) is 21.40. Assuming that the h= 0.25, taking 95% Confidence Level. DF= n-1= 6-1= 5
n ≅ t 2 0.025,5
1. Suer GA (1996) Optimal Operator Assignment and Cell Loading in LaborIntensive Manufacturing Cells. Computers & Industrial Engineering 31: 155158. 2. Hasgul S (2005) Winter Simulation Conference.
s2 n ≅ t n − 1,1 − a / 2 2 h 2
n ≅ t 2 6 − 1,1 − 0.05 / 2
References
3.97 2 0.252
3.97 2 3.97 2 ≅ (2571)2* = 1, 666 0.222 0.252
By considering this equation the number of replications is 1,666
Conclusion In this study worker and machine performance in manufacturing system using simulation has been used. The simulation is done by using Arena software. The performance measure used is throughput and it is directly related to waiting time; work in process, resource or capacity utilization. Simulation models were built for the continuous (extrusion) and injection workshops separately and finally a model is prepared for the purpose of conducting the computer based simulation. The problems identified are the throughput time from the existing system is low because of occurrence of bottlenecks, and waiting time identified. Workers agent should be assigned on the machinery and workers performance to focus on each operating system due that the number of recycle products can be reduced. Otherwise, the company continues like this for a long time and it will be difficult for them to compete in today’s market. Therefore, to improve the existing performance of the company, resource utilization improvement is a mandatory. J Comput Sci Syst Biol ISSN: 0974-7230 JCSB, an open access journal
3. Marco Semini, Hakon Fauske (2006) Applications of Discrete-Event Simulation to Support Manufacturing Logistics Decision-Making: A Survey. Proceedings of the 2006 Winter Simulation Conference. 4. Juhanni Heilala (1999) Use of Simulation in Manufacturing and Logistics systems planning. VTT Industrial Horizon, Espoo. 5. David WK, Randall S, Nancy Z (2010) Simulation with Arena (5thedn.) McGrawHill. 6. Macintosh CA (1992) Research in Manufacturing Systems Integration, Integration in Production Management Systems. Pels, Worthman (eds.) Elsevier. 7. Paul B, Bennett LF, Linus ES (1986) A Guide to Simulation. (2ndedn.) SpringerVerlag, New York, Berlin, Heidelberg, London, Paris, Tokyo. 8. Francisco EM (2002) Application of SIMAN ARENA Discrete Event Simulation Tool in the Operational Planning of a Rail System. University of Puerto Rico Mayagüez Campus. 9. William PB, Henrich RG, Douglas YP (1994) An Evolutionary Model of Organizational Performance. Strategic Management Journal 15: 11-28. 10. Tayfur A, Benjamin M (2007) Simulation Modeling and Analysis with Arena. Rutgers University, Piscataway, New Jersey, Elsevier Inc. 11. Ahad SK, Hamid S (2006) Simulation Intelligence and Modeling for Manufacturing Uncertainties. Proceedings of the 2006 Winter Simulation Conference. 12. Ravindran APD (1987) Operations Research: Principles and Practices. John Wiley & Sons. New York. 13. Umit SB (1995) Modelling of performance measurement systems in manufacturing enterprises. International Journal of Production Economics 42: 137-147.
Volume 8(4) 185-190 (2015) - 189
Citation: Jilcha K, Berhan E, Sherif H (2015) Workers and Machine Performance Modeling in Manufacturing System Using Arena Simulation. J Comput Sci Syst Biol 8: 185-190. doi:10.4172/jcsb.1000187
14. Theodore TA (2011) Introduction to Discrete Event Simulation and Agent-based Modeling: Voting Systems, Health Care, Military and Manufacturing. 15. Karaman AS (2007) Performance Analysis and Design of Batch Ordering Policies in Supply Chains. 16. McDonald T, Eileen VA, Kimberly E (2011) Utilizing Simulation to Evaluate Production Line Performance Under Varying Demand Conditions. Proceedings of the 2011 IAJC-ASEE International Conference. 17. McDonald TN (2004) Analysis of Worker Assignment Policies on Production
Line Performance Utilizing a Multi-skilled Workforce. Dissertation for Virginia Polytechnic Institute and State University for the degree of Doctor of Philosophy in Industrial and Systems Engineering, Blacksburg, Virginia. 18. Arturo M, Veruzcka M (2003) Application of enterprise models and simulation tools for the evaluation of the impact of best manufacturing practices implementation. Annual Reviews in Control 27: 221-228. 19. Phillips DT, James JS (1987) Operations Research: Principles and Practice (2ndedn.) John Wiley & Sons. 20. (2014) Statistical distribution. ARENA Basic Edition User’s Guide.
Submit your next manuscript and get advantages of OMICS Group submissions Unique features: • • •
User friendly/feasible website-translation of your paper to 50 world’s leading languages Audio Version of published paper Digital articles to share and explore
Special features:
Citation: Jilcha K, Berhan E, Sherif H (2015) Workers and Machine Performance Modeling in Manufacturing System Using Arena Simulation. J Comput Sci Syst Biol 8: 185-190. doi:10.4172/jcsb.1000187
J Comput Sci Syst Biol ISSN: 0974-7230 JCSB, an open access journal
• • • • • • • •
400 Open Access Journals 30,000 editorial team 21 days rapid review process Quality and quick editorial, review and publication processing Indexing at PubMed (partial), Scopus, EBSCO, Index Copernicus and Google Scholar etc Sharing Option: Social Networking Enabled Authors, Reviewers and Editors rewarded with online Scientific Credits Better discount for your subsequent articles
Submit your manuscript at: http://www.editorialmanager.com/systemsbiology
Volume 8(4) 185-190 (2015) - 190