Medical Imaging Laboratory, School of Computing Science, ... Keywords: hanging protocols, image display, radiology workstation, PACS workflow organization, DICOM. ..... The technician will choose a scanning protocol (for example âMR brain with ... excellent light output (up to 800 cd/m2, 233 fL), and luminance uniformity.
Workflow Oriented Hanging Protocols for Radiology Workstation Adrian Moise, M. Stella Atkins Medical Imaging Laboratory, School of Computing Science, Simon Fraser University, 8888 University Drive, Burnaby, BC, Canada V5A 1S6 ABSTRACT The goal is to provide a smooth, efficient and automatic display for interpretation of medical images by using a new generation of hanging protocols (HPs). HPs refer to a set of rules defining the way images are arranged on the computer screen immediately after opening a case. HPs usually include information regarding placement of the sequences, viewing mode, layout, window width and level (W/L) settings, zoom and pan. We present the results of a survey of 8 radiologists on (1) the necessity of using HPs, (2) the applicability of a hierarchical organization of HPs and (3) the number of HPs required for interpretation. We discuss some limitations and challenges associated with the HP including automatic placement of the series on the screen despite non-standard series labeling, generation of pseudo-series, creation of the “study context” and identification of relevant priors, and image display standardization with automatic orientation and shuttering. The paper also addresses the HP selection based on the workstation’s hardware such as number and type of monitors, size of the study, and presence of image processing routines tailored to the information needs and level of expertise of particular users. Our “heads-up” approach is meant to free the user’s conscious processing for reasoning such as detection of patterns so allowing for the execution of the tasks in an efficient, yet highly adaptive manner, sensitive to shifting concepts. Automation of routine tasks is maximized through the creation of shortcuts and macros embedded in features like multistage HP. Keywords: hanging protocols, image display, radiology workstation, PACS workflow organization, DICOM.
1 1.1
INTRODUCTION
OVERVIEW
The primary goal of a radiologist is to produce an accurate diagnostic report in the most efficient manner possible. Many radiologists are remunerated based on the number of studies on which they report. During a regular task of producing a diagnostic report, the radiologist’s interaction with the radiology workstation could become increasingly more complex, involving activities not required while reading film on lightboxes. Hence the radiologist would be forced to spend a greater percentage of time manipulating, rather than reading the images. Our goal is to provide an environment that supports and enhances the user’s cognitive capabilities. The “one size fits all” approach no longer works. The users of the radiology workstation are becoming more computer savvy, more refined, more aware of workflow improvements that should result from a user centric1, task oriented workstation design. Consequently, PACS vendors will have to focus more on how to integrate the new features of a radiology workstation in order to improve the efficiency of the workflow. Instead of the user adapting to the workstation’s design paradigm, the radiology workstation software should provide the flexibility of dynamically adapting to the user. The software should continuously track the user’s actions and “calibrate” itself to the user’s needs and to the evolution of the user’s knowledge and skills over time2, providing intelligent tool selection and targeting a natural completion of the current task while providing error handling. User interaction should be consistent and informative feedback should be provided. Automation of routine tasks should be maximized through the creation of shortcuts and macros (sequence of actions linked together) embedded in features like multi-stage Hanging Protocols (HPs) and automatically opening of the next examination. This paper will focus on the importance of workflow and task oriented HPs and their role in optimizing the user-workstation interaction. Original ideas and solutions will be presented for the limitations and the challenges of the current generation of HPs for the radiology workstation.
Medical Imaging 2002: PACS and Integrated Medical Information Systems: Design and Evaluation, Eliot L. Siegel, H. K. Huang, Editors, Proceedings of SPIE Vol. 4685 (2002) © 2002 SPIE · 1605-7422/02/$15.00
189
1.2
DEFINITION
Our intent is to go beyond consideration of the individual and focus on distributing the cognitive activities3 among several agents, humans, and machines. By hanging protocols (HPs) we understand a set of rules defining the way images are arranged on the computer screen immediately after opening a case. By automatically displaying images on multiple monitors the requirement for users to interactively manipulate and sequence images is minimized. The HP usually includes information regarding series placement, viewing mode, layout, W/L settings, zoom and pan, image orientation, sorting of the series, splitting a series into pseudo-series, stages etc. Each of these factors will be described briefly.
2
VIEWING MODE
A sequence represents a collection of related images. Most of the times, a sequence is synonymous with a DICOM series, but there are situations when a DICOM series can generate several sequences (or pseudoseries). For example, in magnetic resonance imaging (MRI), multiple-slices at the same location are often acquired with two different tissue contrasts. These slices are sent by the modality in the same DICOM series, which prevents efficient comparison by the radiologist. The solution is to divide the DICOM series into two sequences, corresponding to each contrast level. A viewport is a location on the screen used to display a sequence. There are two different paradigms for the implementation of the viewport: as separate windows (can be resized independently of the other viewports on the screen) or as a matrix of disjoint (non-overlapping) windows. This paper will only address the second situation, when the screen layout can be specified as number of rows and columns (i.e. 2x2, 3x3, 1x 2, etc). 2.1
TILE VS. STACK
A sequence is usually presented on the screen in either tile or stack mode4. In tile mode images are displayed in a grid format, similar to film. Tile mode (a.k.a. survey mode) is generally used when reading CR and US studies (when there is no spatial relation between images). For CT and MR examinations tile mode will cause a fragmentation of the longitudinal component of the three-dimensional information, making tile useful only to get the ‘gestalt5’ of one series or of the entire examination. In stack mode, images are conceptually placed one on top of each other, like cards in a deck. Only the image at the top of the stack is visible. This situation is most commonly used for cross-sectional imaging (CT, MRI), allowing clinicians to create a mental 3D model of the anatomical structure in which they are interested (the 3rd dimension may be time for US cine-clips). In a study comparing these modes, radiologists were asked to unravel 20 entangled tubes from the CT scan of a complex 3D phantom6. All five CT radiologists performed 3.2-5.7 times faster in stack mode (100% accuracy) than in tile mode (90% accuracy). On the other hand, when the CT of bowel obstruction was interpreted in stack mode7, the authors stated the cases were “extremely challenging and the interpretation quite time-consuming” when following bowel loops in and out of the axial images, identifying the transition zones and the presence of adhesions. These findings will apply to all structures (such as biliary ductal or urinary tract obstruction) which track through planes perpendicular or oblique to the plane of the interpreted images. Cross-sectional sequences (from the same study or from different studies) can be linked together if the volumes they image overlap and if the images forming these sequences were acquired on the same (or very close) axis. Considering a reference image in the first sequence, the application can calculate the corresponding image (acquired in the same spatial plane) in the second sequence based on the spatial information embedded in the DICOM header of these images. For example, in an MR study of the brain, an “Axial T2 FE” sequence can be linked with an “Axial T2 SE” sequence. These sequences can be placed in stack mode, and every time the user changes the current (top of the stack) image in the “Axial T2 FE” sequence, the application will automatically display the corresponding image in the “Axial T2 SE” sequence, taking into account the possible difference in slice thickness for two sequences. Additional benefits of the stack mode result from the workstation’s ability to display two linked instances of the same series (for example a CT abdomen) with different W/L settings (lung and liver, for example).
190
Proc. SPIE Vol. 4685
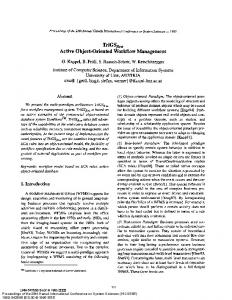
In most situations linking two sequences is straightforward and only requires the user to find one slice in each series corresponding to the same anatomical region. The situation becomes more complicated when one tries to link series with non-parallel axis, and some applications prohibit such attempts for situations like the one illustrated in Figure 1.
P
A
R
L
Figure 1. Sequences with non-parallel axis
Stack mode is more commonly used than tile mode for CT/MR, because of the lack of screen space compared to the light screen. Also in tile mode it is difficult to properly register images from current and previous studies. Another negative aspect related to the tile mode comes from the “information overload” that makes it difficult for the radiologist to pay attention to all tiled images. A 1994 study involving 3 experienced radiologists and 10 synthesized MR studies showed an improvement in efficiency with linked stack reading 1.5-4 times faster than film8. Another study from 1994 involving 5 radiologists and 20 synthesized MR studies with priors resulted in both efficiency (twice as fast as film) and accuracy improvement9. Similar results10 for reading MR examinations showed an average time of 58 seconds using a linked stack mode vs. 80 seconds for the tile mode. Similar results were published in 19955, showing the average time for CT review of 6.68 minutes in stack mode vs. 10.84 minutes with film. Another 1995 study showed that the stack mode improved the radiologists’ ability to detect nodules in spiral CT of the chest11, and a follow-up study12 from 2000 indicated that the stack mode should be used to “clarify the adjacent vascular anatomy of perceived nodules”. It has been proved that shapes can be depicted and recognized using five different attributes (grayscale, color, texture, relative motion and depth from binocular disparity), corresponding to discrete information-processing channels in the human visual system. Stack mode may activate additional perception attributes and improve lesion detection as described by Seltzer et al.13 By tracking the eyes of the radiologists10 it was determined that the tile mode corresponds to an “overviewing” pattern. In the stack mode the radiologists started MR image interpretation by scanning one series and fixating on relevant images; other series were viewed to further investigate the findings on the original series. Despite the advantages of stack display for tracing longitudinal structures (such as blood vessels, muscles, nerves, tubes etc), assessing surface contour of organs (liver, kidney etc.) and separation of adjacent structures (lymph nodes from blood vessels)6, the tile mode is still seen as an alternative viewing paradigm. One reason for the use of the tile mode comes from the radiologist’s training habits. Since most radiologists are trained using film, the way to avoid developing a new viewing strategy is to use the “digital light-boxes” metaphor, with images displayed in tile mode. The other important reason for choosing tile vs. stack is the lack of detail and context in stack mode. Since only one image is displayed at one time in stack mode, it is difficult to mentally visualize a 3D section of the anatomy5. One study that explored an alternate way to display both detail and context in a tiled display through a novel zooming technique, found that users' performance was comparable to that using thumbnails14. Preliminary results of comparisons of this novel detail-in-context in a tiled display with stack mode indicate that for certain tasks, stack mode can be twice as fast as the tiled approach15. It is possible that an augmented stack mode with some context around the focal image might provide the best of both worlds.
3
WORKFLOW ORIENTED MULTI-STAGE HPS
It is typical to change layout and content of the screen(s) sequentially during the reviewing process, particularly for reviewing extensive MR studies, and also for reading multiple studies of trauma patients. One option would be to provide the user a whole series of HPs for that study, for selecting/applying them sequentially. One could also define "virtual desktops" (a “logical” viewport that can be smaller than, the same size or larger than a single monitor16), which is independent of the actual number of screens available at the system. The user controls which desktop is currently active/displayed.
Proc. SPIE Vol. 4685
191
We define a stage as the user-workstation interaction required for completing a simple task (or a single step from a complex task). The precursor of the stage concept was described in 1990 as “automatic schemes”17 where pressing the “NEXT IMAGE” key should be translated as a request for displaying the next stage. Another earlier approach on HP stages was presented in 1995 as a “montage-display format”4 of 20 selected images with significant features/pathology. Our vision of staged HPs defines the computer model as an analogical extension of familiar activities18 and allows for the automation of user-defined sets of tasks into a “stage” of the HP. A “recording” mechanism would be available to store the screen presentation for each stage. This feature will allow the generation of user-specific shortcuts for tasks or subtasks, depending on the granularity selected by an expert user. Our concept of workflow oriented HP refers to the inclusion of both the data and the tools required to complete a certain task involved in a reading session. This will provide intelligent filtering of information, alleviating information overload, and reducing the complexity of completing a task through more manageable and meaningful views (“stages”). When reporting complex studies, many radiologists will choose to display the images for initial viewing (“image organization”), and then switch to the format for final reporting (“image navigation”19). Wang et al.20 described the following tasks that are usually involved in a reading session: (1) quality check on the image, (2) searching for new lesions or abnormalities, (3) surveillance of existing abnormalities and assessment of changes, (4) interpretation of new findings, (5) reporting, (6) measurement of new findings and eventually (7) detailed analysis of the new findings and documenting them. When the PACS is tightly integrated with the RIS/HIS system, additional information is accessible to the radiologist in digital format, such as radiology reports for previous examinations, patient’s complaint, admitting diagnoses description, laboratory test results, requested procedure description, study description and reason for the requested procedure etc. We suggest that the HP include a first stage to describe how this auxiliary information (previous reports, diagrams, EKGs) should be presented to the radiologist to help with the creation of the context (complementing information usually presented by every workstation such as the patient’s age, sex, number of prior examinations etc.) for the reading session. Consider the example of reviewing traditional chest CR studies, containing one post-anterior (PA) and one lateral (LAT) image, with different specialized CR image processing algorithms. In the first stage of the HP, images are displayed using the W/L settings from the DICOM header. In the second stage, images are presented using the combined processing techniques of gray-scale inversion and edge enhancement, which demonstrates significantly improved measures of sensitivity, specificity, and overall accuracy.21 The radiologist’s workflow depends on the software and hardware solution implemented in the radiology workstation. For example, if the workstation does not support the stack viewing mode, the radiologist will be tempted to use a “lightbox” approach of reading images in tile mode on as many monitors as possible. If a requirement for the reporting systems is to start the report with a “summary of the findings” (very useful for the referring physician, especially in the ICU), the radiologist must know the essence of the report before starting the dictation, which will usually trigger a short report. If the “summary of the findings” is optional or can be done at the end of the report, the report will be more verbose because since the radiologist is “thinking aloud.”
4
HP GENERATION AND SELECTION
Some of the biggest challenges associated with the HP reside in the workstation’s ability to generate new HPs with minimum user interaction. A radiologist should be able to arrange a study for optimal interpretation, then click on the “Save HP as…” button to store the newly defined HP. Thus, no time is wasted with the definition of a new HP, since this new arrangement of the images will be immediately used in the interpretation task. The quality of the workstation design will be evident in its capability to abstract the required information for saving the “study context” defined by the radiologist. For example, consider a radiology workstation with 2 displays (1200x1600 pixels/monitor) in the original setup. Let’s assume that the radiologist defines a HP for a “CT abdomen” as tiling the only series (a series with 64 images, 512x512 pixels each) in a 2x3 layout on each monitor. In Figure 2, three alternatives are provided for displaying the same study on a radiology workstation with 4 displays (1600x2000 pixels/monitor): case (a) displays a 2x3 layout on only the first 2 (out of 4) monitors, ): case (b) displays a 2x3 layout on all 4 monitors while in case (c) the HP infers that the user wanted to see as many images as possible at their “native” resolution and thus display a 3x4 layout on all 4 monitors?
192
Proc. SPIE Vol. 4685
1
2
7
8
3
4
9
10
5
6
11 12
Original h/w configuration
1
2
7
8
3
4
9
10
5
6
11
12
1
2
7
8
13
14
19
20
3
4
9
10
15
16
21
22
5
6
11
12
17
18
23
24
(a)
1
2
3
13 14 15
25 26 27
37 38 39
4
5
6
16 17 18
28 29 30
40 41 42
7
8
9
19 20 21
31 32 33
43 44 45
22 23 24
34 35 36
46 47 48
10 11 12
(b)
(c)
Figure 2. Three alternative solutions for adapting a HP, defined on a two monitor workstation (1200x1600), to a workstation with four monitors (1600x2000)
A radiologist should not need to interact with a cumbersome user interface to describe the properties of each series to be displayed on the screen. For example, a poor workstation implementation will generate a number of steps in the definition of a HP proportional to the number of series displayed on the screen. This could impose a big penalty on the workstation’s usability and will discourage the user from using the HP, especially for MR studies where 10 or more series is quite common. Another challenge for the PACS vendors is at the time of the deployment of a workstation to a new site. While the scanning procedures performed by the technician are similar for different customers, the acquisition protocols and series labeling compared are site-specific. In order to speed up the generation of default HPs the vendor should create a dictionary of synonyms for series names (see following section on “series placement”). This will require the implementation of an abstract layer to hide customer-specific labeling of series and modality protocols.
5
USER SURVEY
In December 1999 we performed a user survey in an outpatient radiology clinic equipped with state-of-the-art PACS and imaging scanners. The first section of the survey assessed the benefits of PACS vs. film, and it was meant to provide feedback for improving the design of the radiology workstation1. In the second section of the survey (described in this paper), our goal was three fold: (1) to asses the need for developing HPs, (2) to validate our hypothesis towards a hierarchical structure of HPs and (3) to determine the average number of HPs required, so we can estimate how practical will be for radiologists to define and use HPs. 5.1
RESULTS
All eight board-certified radiologists involved in our survey were familiar with soft-copy interpretation. Prior to our survey, each radiologist used at least 3 different radiology workstations, and were involved in soft-copy diagnostic interpretation for at least 3 years. Two radiologists specialized in cross-sectional examinations (CT/MR), two radiologists focused on projection radiography and the 4 remaining radiologists specialized in US radiography. Table 1 summarizes the average daily workload distribution for these radiologists (based on their own estimation) in either film or soft-copy environment.
Proc. SPIE Vol. 4685
193
Rad.
Number of radiology workstations used
1 2 3 4 5 6 7 8
Table 1: Profiles of the radiologists involved in our survey Years of Average daily workload experience with Film Softcopy softcopy interpretation CT/MR CR/RF US CT/MR CR/RF
3 3 5 8 4 4 3 3
6 7 3 5 3 1/2 4 3 8
32
18 30
35 25 3 4 3 7-8
50 100 50-60 75
15 2
US 5-10 35 35 50 35
55-70 60-70
We investigated the perceived impact on the radiologist’s productivity and accuracy due to switching from film to softcopy presentation. Table 2 summarizes each radiologist’s estimation of the average time spent on “image organization” (time spent preparing a study for interpretation) and on the quality of the diagnosis. The quality of the diagnosis film vs. softcopy was rated “>” (better for film), “=” (about the same) and “ = < =<
>/< < < < < (lumbar) =(chest)
Film US
=
CT/MR 15% 1-2 1 1 0.3-5 2
CR/RF
1 0.5 12 1 0.8-1
Softcopy US
1
CT/MR 7% 2 10 1
CR/RF 2 4 3-5 12
US
4
Modality->Body part->Procedure type->Priors. A matching HP can be searched on the deepest level on the tree. If the node is empty the search should go up in the tree, eventually reaching the modality level. However, this hierarchical HP organization does not offer a perfect solution for choosing the order (priority) of the filtering. An example of the HP tree presented for their validation is illustrated in Figure 2.
194
Proc. SPIE Vol. 4685
General ->MR->Extremity ->Knee
->LeftKnee->LeftKneeWithContrast ->RightKnee ->LeftArm
->Arm
->CR
->Spine
->SpineLumbar ->SpineCervical
->Chest ->Extremity
->ChestLateral ->LowerExtremity ->UpperExtremity
Figure 2: Hierarchical HP organization
In order to estimate the applicability of radiologists defining their own HP, we investigated the number of HPs that each radiologist would use to cover most of the daily work for each modality. We expected the number of the HP to be proportional to the number of body parts imaged with each modality. Table 3 reflects the estimated number of HPs each radiologist thought would be required, and the percentage of the studies that will be covered by these HPs. Table 3: Estimated number of HP and percentage of the studies covered. Rad.
Estimated # of HP req. CT/MR (#)
1 2 3 4 5 6 7 8
>15 3/10 20 6 50-100 2
CR/RF (%) 5 15/5 50
15-20
Percentage of studies covered CT/MR (#) 90-95 90-95 85 >90 75-90 >95
CR/RF (%) 75 80/90 >90
>90
We also investigated the impact of the display devices on the radiologist’s workflow. The radiologists were familiar with monitors with different properties: grayscale and color, portrait and landscape, and spatial resolution of 1, 2, 3 or 5 megapixels. We investigated the importance (0-5 scale: 0-not important, 4-most important) of the spatial resolution by comparing 2 types of high-resolution grayscale monitors: 1728x2304 (3 megapixels) vs. 2048x2560 (5 megapixels). We inquired about the “frame effect” produced by 2 adjacent monitors: “Yes” means the radiologist would prefer a bigger monitor to replace the 2 smaller ones, “No” means the frame effect is not disturbing. The preferred number of monitors (1-4) and the preference for a general, multimodality workstation (“Yes”) vs. a suite of specialized workstation (“No”) are also presented in Table 4. 5.2
DISCUSSION
Our hypothesis on the radiologist’s need for an automatic arrangement of images was confirmed, with the potential effect of reducing the interpretation time by 10-20%. The data collected suggests that 10-20 HPs / modality can accommodate the radiologist’s needs in 80-90% of the studies displayed for interpretation. Less than twenty HPs / modality will not be too difficult for the radiologist to generate, nor for the radiology workstation to manage and select from. The remaining 10-20% of examinations will be impractical to cover under HPs. These remaining studies represent either very rare examination types or exceptions, that will occur in situations when the patient moved and the technician had to add another series, or when the study was sent twice from modality to PACS so each series is duplicated. The new data increased our confidence the HPs will be critical in combating the limitations of the screen real-estate, especially for complex situations like MR brain/angiography or ICU22 when comparison with prior examinations becomes critical.
Proc. SPIE Vol. 4685
195
Table 4: Effect of display devices: general vs. specialized workstation; is frame effect disturbing? preferred number of monitors, and importance of spatial resolution. Rad General Frame Preferred number of monitors Importance of spatial resolution vs. spec. effect CT/MR CR/RF US CT/MR CR/RF US 1 2 3 4 5 6 7 8
Yes Yes
Yes No Yes No Yes No No Yes
4 2 3 1
same 3 2 4
2 3
2 0
4 1 2 1
4 3 4
3 0 0
3 4
While the hierarchical structure we proposed in December 1999 was very well received at that time, further refinements presented in this paper (such as workflow matching, stages and loading of relevant prior examinations) could contribute further to an improved softcopy interpretation.
6 6.1
CURRENT LIMITATIONS AND CHALLENGES ASSOCIATED WITH HP
SERIES PLACEMENT
When a HP is created, the position on the screen of each series is recorded as an identifier. This name comes from the “ID series description” field present in the DICOM header of each image. For a HP to work, a consistent naming mechanism for the series should be used. When series naming is not consistent, series identification and placement is compromised. Unfortunately series names are sometimes missing - most CR chest exams don’t come up with the “PA” and “LAT” identifiers in the DICOM header. One solution for this problem relies on the consistent ordering of the series. For example, in a CR examination, the first series is always the “PA”; if a second series exists, that will be the “LAT”. Another solution consists of image processing algorithms for detection of “PA” and “LAT” series. Series names are sometimes inconsistent because different technicians are in charge of the acquisition of medical images. Different technicians may use different names to describe the same series (“Chest” vs. “CR/Chest”). Typing errors are also responsible for the different series naming. This type of situation could be corrected by eliminating the manual (error prone) input through the use of DICOM worklists combined with predefined acquisition protocols with consistent series labeling for modalities. The technician will choose a scanning protocol (for example “MR brain with contrast”) with a predefined format (first series “T1 axial”, second series “T2 axial”, and third series “Contrast”). In order to facilitate both the maintenance/ upgradeability of the software and the installation of default configuration protocols when deploying a PACS system to a new customer, we propose that a separate layer should be introduced between the naming conventions used by the radiology workstation and the modalities. This layer will create a translation of different DICOM series names used by each site to the abstract series names used internally for the HP. We also suggest introducing a set of aliases to compensate for spelling errors and inconsistencies due to manual labeling of the series. For example, the HP for a “CT of the abdomen” will specify how and where to present the 2 series: the scout (“s1”) and the main series (“s2”). In this situation, the series names “s2” will act as an alias for series names like “Routine abdomen”, or “Chest/abd” or “Dissection chest and abd” etc. 6.2
LAYOUT
A flexible workstation design should allow for a hierarchical layout configuration. At the root level, the display area should be divided into several “virtual monitors.” A virtual monitor is usually mapped onto a physical monitor. If the design for the radiology workstation assumes “one study per monitor” it is imperative to be able to assign 2
196
Proc. SPIE Vol. 4685
simultaneous half-sized virtual monitors on a physical monitor. This will allow the user to compare 2 or more studies for the same patient when using workstations with only one (physical) monitor. The second level of layout control should be at the level of each individual monitor, which will allow the users to independently control the number of “viewports” on each monitor. For example, the user can have only one viewport (for a single CR image) on the first monitor, and 4 viewports (a 2x2 layout) for an MR study on the second monitor. 6.3
BRIGHTNESS AND CONTRAST SETTINGS
Images are generally displayed for soft copy presentation on diagnostic grayscale monitors. These monitors provide high resolution (up to 2048 x 2560), excellent light output (up to 800 cd/m2, 233 fL), and luminance uniformity correction. These monitors can also be calibrated for image conformance and consistency. The radiology workstation is responsible for mapping the pixels intensity values stored in the DICOM images (for images with 16 bit stored, this is up to 65536 levels of gray) onto monitors with less than 256 shades of gray. This is usually done by applying a linear transfer function like W/L, with its variants (min/max, slope/intercept etc.). For non-linear transfer functions, a DICOM Modality, Presentation or VOI LUT (volume of interest look-up table) can be used, but they are rarely used in practice. For the scope of this paper, only the W/L solution is considered for adjusting for brightness and contrast. It is important to be able to customize the default W/L values when loading the series on the screen. It may also be useful to replicate a series for display with different contrast settings (for example, a CT abdominal scan can be presented with both “Lung” and “Liver” W/L values). Both of these options can considerably reduce the time required by the radiologists to present CT or MRI images with the optimum brightness and contrast values. For the situations mentioned above, some fixed (predefined) W/L values are used. It is also important to be able to define HP using explicit W/L values, like “original” (present in the DICOM header of the image), “estimate” (using various algorithms such as histogram analysis) and “inverted.” There are no “perfect” estimators; some may work well for some modalities (CT), but not as well for others (CR). Some estimators, using image recognition algorithms, will have good results on some body parts (CR chest), but not as good on others (CR extremities). Therefore it is essential to provide efficient interactive tools for manual W/L adjustment. 6.4
LOADING OF PRIOR EXAMINATIONS
If prior studies are stored on slow archive devices, these studies should be retrieved in advance using prefetching algorithms. The likelihood of obtaining a prior examination that matches the current one was investigated with selection of priors based on their number (2 priors 83%, 4 priors 91%) or defined time interval (one month for 80%)23. More complex strategies based on metagroup categories for examination type mnemonics24 resulted in a sensitivity of 98.3% and a specificity of 100%. These algorithms should be coupled with real automatic loading of the next examination. By loading the images for the next study in the background BEFORE the user closes the current study, the delay for loading the next study is completely eliminated. The complexity of arranging the studies can increase dramatically when prior examinations must be automatically loaded. The eligibility criteria for the selection of significant prior examinations should take into consideration relevant modalities, procedure types, body parts, availability of the report, the date of the study, the type of media the study is stored on, the hardware configuration (number and type of the monitors), and the characteristics of each study (the series description, the number of images). We are investigating new mechanisms based on new concepts like “anchor” (reference) study, “priors” (old examination), “study context,” study “manifest,” and families of multi-staged HP. 6.5
IMAGE DISPLAY STANDARDIZATION
In order to further reduce unnecessary user interaction for personalized display of medical images, we introduce the concept of image display standardization. This includes automated orientation (for CR images, flip and/or rotation are often required to compensate for the inconsistent acquisition of medical images). It also refers to automatic shuttering (removal of unexposed background), especially for pediatric and extremity images, which reduces the unwanted white background4 and allows for more accurate image processing.
Proc. SPIE Vol. 4685
197
For CR images of extremities it is important to present images at their “real size” so that a 4cm finger will have a 4cm physical image on the screen. This requirement cannot be satisfied by displaying images in a 1:1 format since a CR image of a hand will look several times bigger than in reality on a monitor with a resolution of 2000x2500 pixels. Nor it will be acceptable to simply display the CR with a 1:1 mapping of the image pixel to a screen pixel - an image will look twice as big on a monitor at 800x600 pixels resolution as on the same monitor at a resolution of 1600x1200 pixels! The solution is to “calibrate” each type of monitor that a workstation supports by calculating the ratio between the width of the visible area and the number of pixels in each row. While most medical images have “square” pixels, when the imager pixel spacing is different on the x and y axes, special image processing routines should be used to convert without distortion the image content on a screen with square pixels. For teleradiology or when operating over slow network connection, there is always a trade-off between the quality of the image and the transfer speed. It is important for the HP to be able to specify if progressive loading of the images should be considered and what compression factor should be used, depending on the network connection and the type of interpretation. Since a facility may employ different compression methods for different modalities, the relevant compression factor depends on the compression method used. An additional JPEG 2000 compression factor could be provided based on the relative performance JPEG 2000 vs. a proprietary compression algorithm. For real-time teleradiology interpretation, the radiologist may want to get a gestalt of the examination (first stage of the HP: inspection of compressed images displayed at low resolution) followed by retrieval and display of the selected images full fidelity (second stage: interpretation). 6.6
THE ERA OF HUGE STUDIES
Today a head-to-toe CT scan (about 2000 images) can be performed in less than 15 minutes due to technological improvements in helical scanning. This may prove very convenient in the emergency department for a trauma case and may result in increased overall efficiency of patient care by reducing the discomfort caused by several trips to the hospital for additional investigation. Other potential advantages include improved quality and increased confidence of diagnosis, which translates into a reduced number of calls for new tests. For example, a radiologist reading a head exam can easily access the images corresponding to the patient’s neck or spine. In addition, the radiologist can get extra information from a 3D volume reconstruction using images from different series. Better utilization of the scanner also means a shorter amortization time, making its purchase a more viable business solution for the health care provider. However, all the benefits mentioned above come with a price. Storage is not the main problem, since prices are reasonable: in the range of $60/GB for Redundant Array of Independent Disks and $0.6/GB for Network Attached Storage. With current PACS architectures, one could upgrade its archive on the fly. A big challenge is how to display so much data? These studies can exceed the 2GB limit a process can address on a Windows NT workstation. Another issue relates to who will read them and considers the fact many radiologists are paid for the number of studies on which they create reports. The solution could reside in the “Presentation of Grouped Procedures”: viewing image subsets that result from a single acquisition; each image subset is related to a different requested procedure (e.g. CT chest, abdomen and pelvis). Even if a single acquired image set is produced, the combined use of the scheduled workflow transactions and the consistent presentation of images allow separate viewing and interpretation of the subset of images related to each of the requested procedures. As a result, several reports (eventually by different radiologists) can be produced that match the billing policies of the healthcare facility.
7
SUMMARY AND FUTURE RESEARCH
Future research will focus on other issues for state-of-the-art HP. We will present solutions for handling pseudo-series, automatic-adaptation of a predefined HP to different hardware configurations, advanced selection of relevant prior studies, sharing HP between different workstations and vendors, use of HP in the context of the recently released DICOM Grayscale Presentation State (GSPS), support for “cooperation” mode (users will be able to consult each other on difficult cases, or to get an expert opinion), and how non-image medical data is displayed on screen (e.g. medical reports for prior examinations, waveform data, etc.).
198
Proc. SPIE Vol. 4685
8
REFERENCES
1
Moise, A. and Atkins, M.S. “New trends in radiology workstation design”, Proc SPIE 2002: 4685. Patel, V.L.; Kushniruk, A.W. “Interface design for health care environments: the role of cognitive science”, Proc AMIA Symposium, 1998, : 29-37. 3 Grosz, B.J. “Collaborative systems”, AI magazine, 1996, 67-81. 4 Lou, S.L.; Huang, H.K.; Arenson, R.L. “Workstation design. Image manipulation, image set handling, and display issues”, Radiol Clin North Am, 34 (3), May 1996: 525-44. 5 Beard, D.V.; Molina, P.L.; Muller, K.E.; Denelsbeck, K.M.; Hemminger, B.M.; Perry, J.R.; Braeuning, M.P.; Glueck, D.H.; Bidgood, W.D.; Mauro, M.; et-al. “Interpretation time of serial chest CT examinations with stacked-metaphor workstation versus film alternator”, Radiology, 197 (3), Dec 1995: 753-758. 6 Mathie, A.G.; Strickland, N.H. “Interpretation of CT scans with PACS image display in stack mode”, Radiology, 203 (1), Apr 1997: 207-209. 7 Memel, D.S.; Berland, L.L. “CT of bowel obstruction: interpretation using cine-paging”, AJR Am J-Roentgenol, 164 (3), Mar 1995: 766-767. 8 Chang P.J., Ziegelbein K. “Performance of multiband cine workstation vs film in interpretation of MR studies”, Academic Radiology 1, 1994: 416. 9 Chang P.J., Ziegelbein K. “Improved MR image interpretation accuracy and efficiency compared with that of film with use of a multiband cine workstation with temporal”, Radiology, 193, 1994: 225. 10 Niimi, R.; Shimamoto, K.; Sawaki, A.; Ishigaki, T.; Takahashi, Y.; Sugiyama, N.; Nishihara, E. “Eye-tracking device comparisons of three methods of magnetic resonance image series displays”, Journal Digital Imaging, 10 (4), Nov 1997: 147-51. 11 Seltzer, S.E.; Judy, P.F.; Adams, D.F.; Jacobson, F.L.; Stark, P.; Kikinis, R.; Swensson, R.G.; Hooton, S.; Head, B.; Feldman, U. “Spiral CT of the chest: comparison of cine and film-based viewing”, Radiology, 197 (1), Oct 1995: 73-8. 12 Jacobson, F.L.; Judy, P.F.; Feldman, U.; Seltzer, S.E. “Perceived features reported as nodules: interpretation of spiral chest CT scans”, Acad Radiol, 7 (2), Feb 2000: 7. 13 Seltzer S.E., Judy D.F., Adams D.F. “Cine display of spiral chest CT scans”, Radiology, 193, 1994: 339. 14 Kuederle, O.; Atkins, M.S.; Inkpen, K. M.; Carpendale, M. S. T. “Evaluation of viewing methods for magnetic resonance images”, SPIE 2001 Proceedings, 4319: 536-545. 15 Hunter, Susanto and Atkins S. Simon Fraser University, School of Computing Science internal report, , Dec. 2001. 16 Ghosh, S.; Andriole, K.P.; Avrin, D.E. “Viewport: an object-oriented approach to integrate workstation software for tile and stack mode display”, Journal of Digital Imaging, 10 (3 Supplement 1), Aug 1997: 177-179. 17 Arenson R.L., Chakraborty D.P., Seshadri S.B. “The digital imaging workstation”, Radiology, 176, 1990: 303-315. 18 Caroll J.M. “Human-computer interaction: psychology as a science of design”, Annual review of psychology, 48, 1995: 61-83. 19 Roger E., Goldberg M., Dillon R.F. “Image organization and navigation strategies for a radiological workstation”, Journal of Digital Imaging, 2, 1989: 229-244. 20 Wang, J.; Langer, S. “A brief review of human perception factors in digital displays for picture archiving and communications systems”, Journal of Digital Imaging, 10 (4), Nov 1997: 158-68. 21 Reiner, B. I., Siegel, E. L., Hooper, F .“Utility of Specialized Image Processing for the Detection of Pulmonary Nodules in the Soft-Copy interpretation of Chest Computed Radiography Images”, SCAR2001. 22 Moise, A. and Atkins, M.S. “Radiology Workstation Design for the Medical Intensive Care Unit”, Proceeding SCAR 2002. 23 Siegel, E and Reiner B “Recommendations for image prefetch or film digitization strategy based on an analysis of an historic radiology image database, Journal of Digital Imaging, 11 (3 Suppl 1), 1998: 30. 24 Andriole, K.P.; Avrin, D.E.; Yin, L.; Gould, R.G.; Luth, D.M.; Arenson, R.L. “Relevant priors prefetching algorithm performance for a picture archiving and communication system”, Journal of Digital Imaging, 13 (2 Suppl 1), May 2000: 73-5. 2
Proc. SPIE Vol. 4685
199